
Our annual snapshot of how many researchers NIH supports is back. As with previous posts, the data presented here are also available in the NIH Data Book and represent awards made with traditional and supplemental coronavirus appropriations. The data are distinct from success rates, however, which are application-based metrics (see this post).
Our cumulative investigator rate is an NIH-wide person-based metric. The metric is calculated as the number of unique principal investigators who were designated on an NIH Research Project Grant (RPG), activity or mechanism, divided by the number of unique principal investigators who were designated on applications over a five-year period. For simplicity, we will refer to those investigators as either “awardees” or “applicants” in this post. And, we focus on a five-year timeframe because most research grants last for more than one year, and applicants submit applications with the goal to secure multiple years of funding. We also only count someone once if they are designated on separate awards from multiple NIH Institutes or Centers in a particular five-year timeframe.
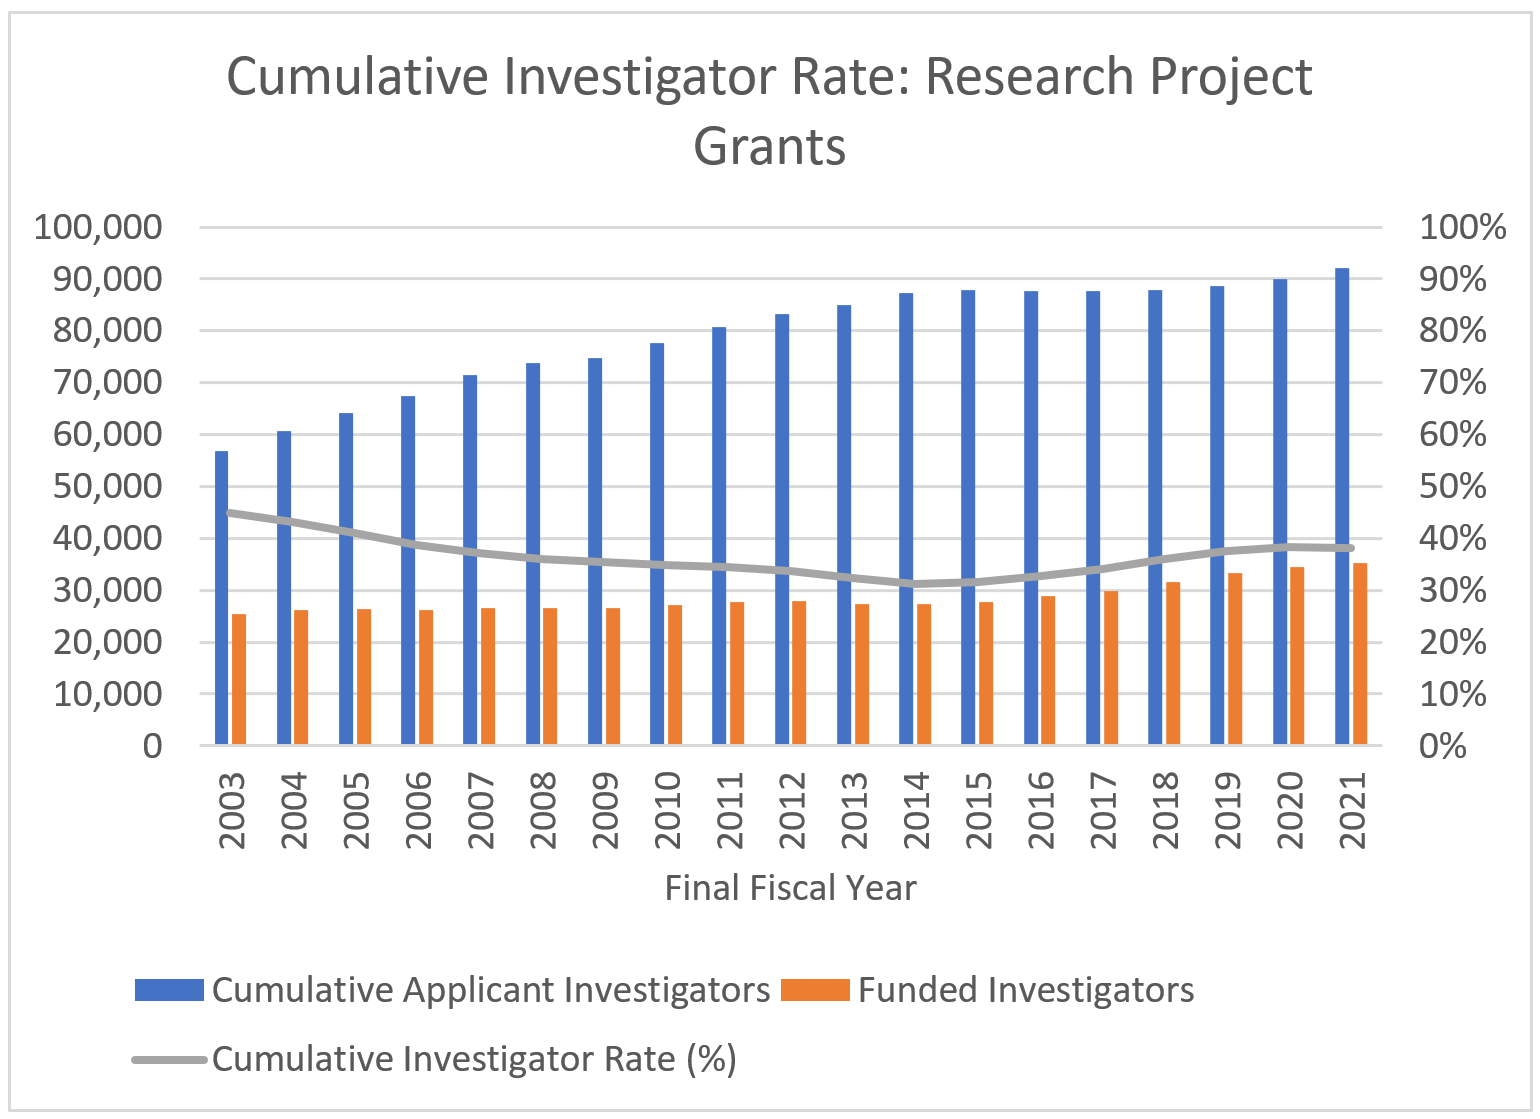
Figure 1 shows cumulative investigator rate data for RPGs between fiscal years (FYs) 2003 and 2021. Applicants are in blue bars, awardees in orange bars, and the funding rate itself is the gray line. FY 2021 saw 35,179 awardees out of 92,044 applicant investigators, which was a 2.0% and 2.3% increase over FY 2020, respectively. This made for a 38.2% cumulative investigator rate.
Figure 1: Cumulative Investigator Rate: Research Project Grants
The table below highlights FY 2021 data for R01-equivalent, R21, and P01 grant types. More complete data going back to FY 2003 are available in the NIH Data Book.
| Activity Code | Cumulative Applicant Investigators | Funded Investigators | Cumulative Applicant Investigators change from FY 2020 (%) | Funded Investigator Change from FY 2020 (%) | Cumulative Investigator Rate (%) |
| R01-equivalents | 68,370 | 29,278 | 3.3% | 3.7% | 42.8% |
| R21s | 40,532 | 4,684 | 1.6% | -5.6% | 11.6% |
| P01s | 1,191 | 447 | -4.0% | -3.5% | 37.5% |
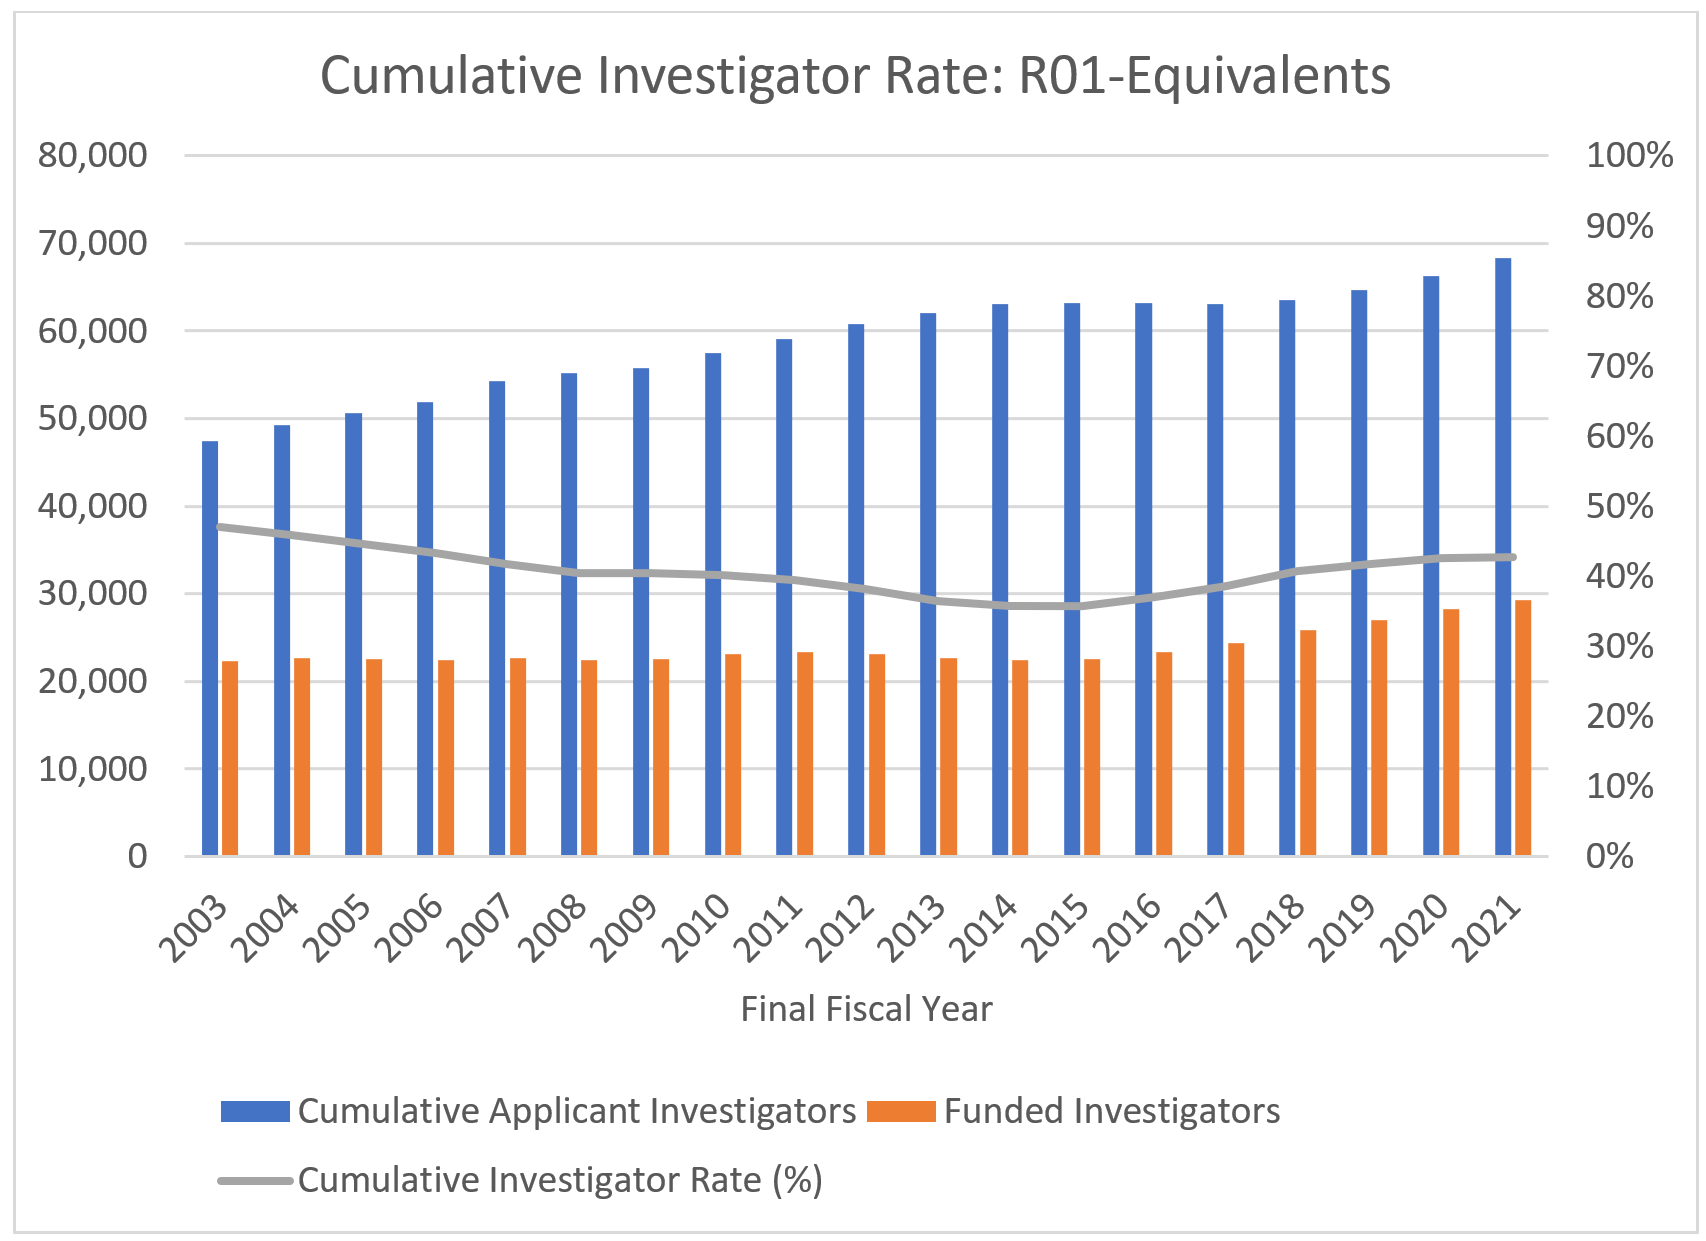
The cumulative investigator rate for R01-equivalent grants ticked up again in FY 2021 to 42.8% (Figure 2). We also saw a rise in the overall numbers of applicant and awardee investigators for these grant types.
Figure 2: Cumulative Investigator Rate: R01-equivalent Grants
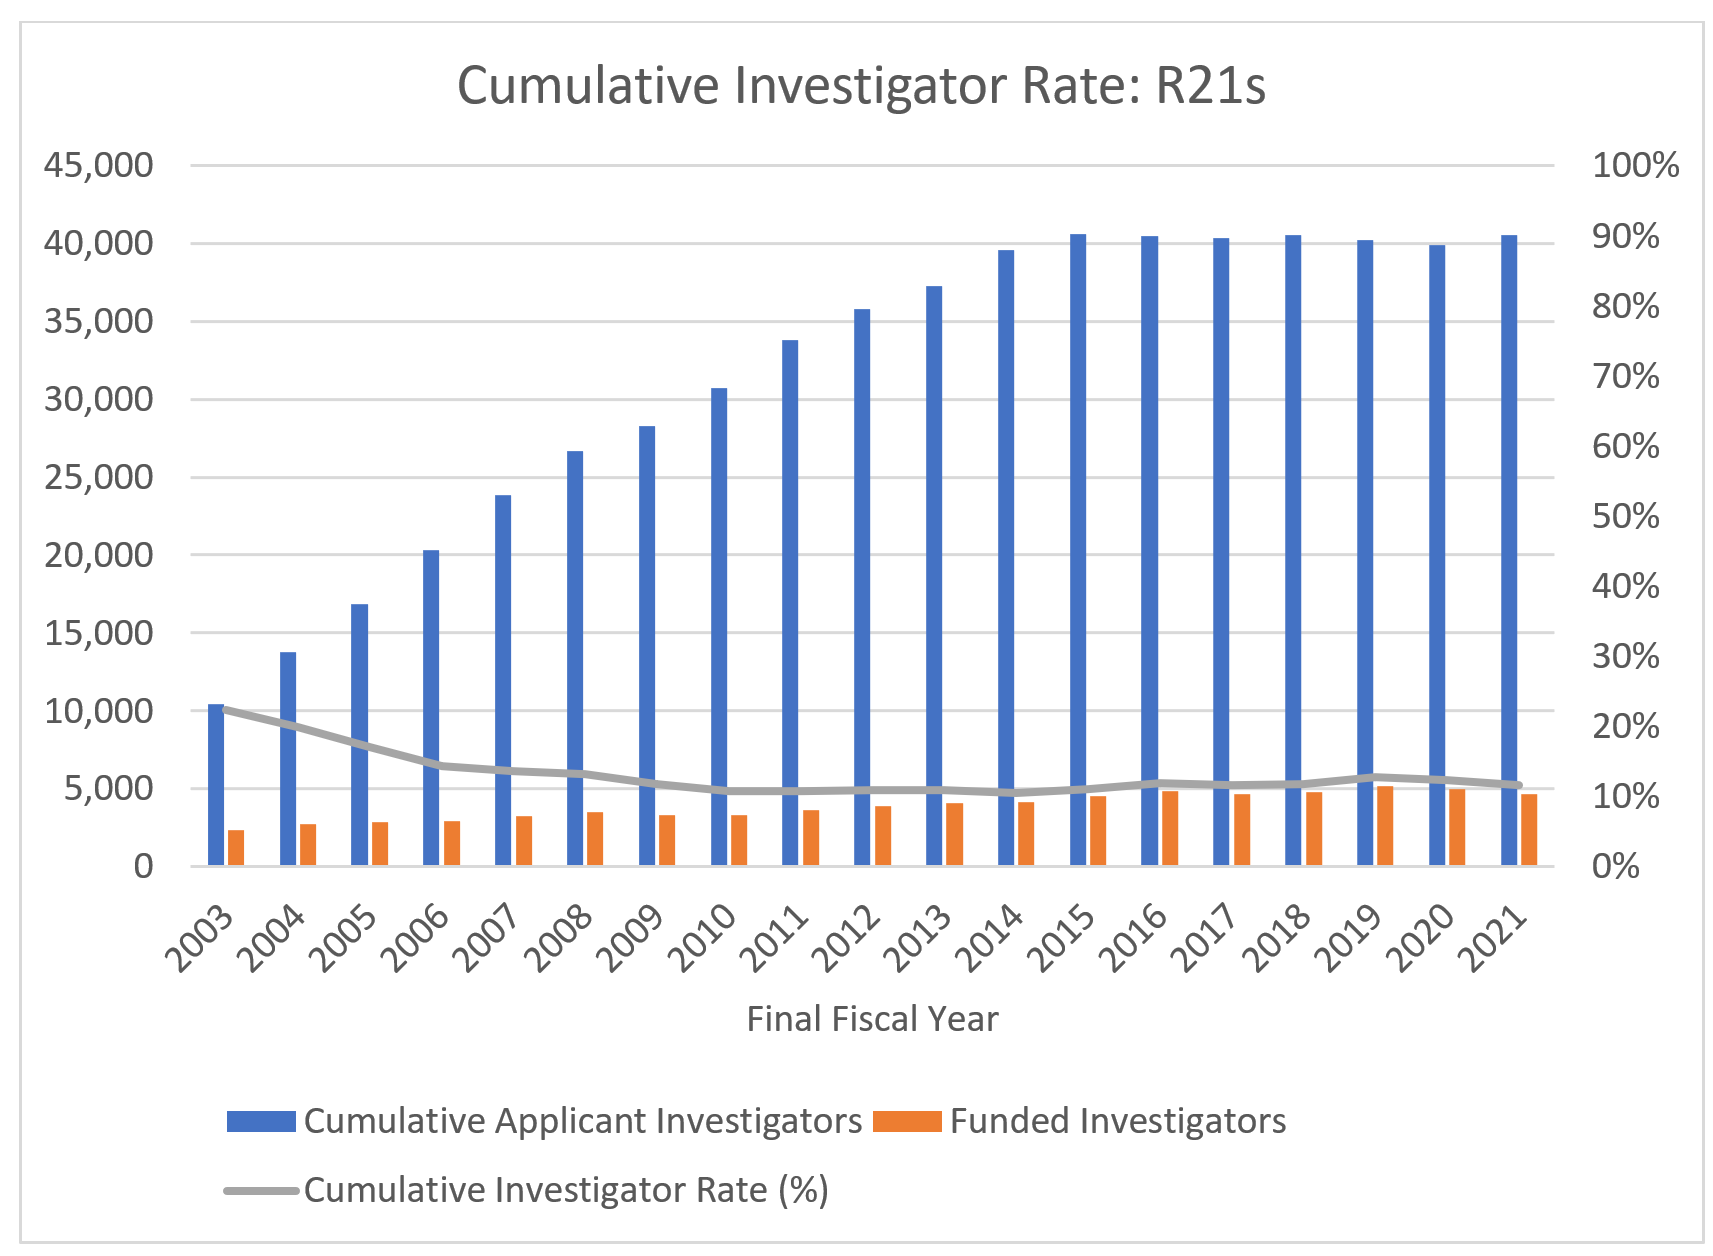
Similar to what we saw in FY 2020, the R21 cumulative investigator rate decreased again in FY 2021. This time it went down to 11.6% (Figure 3). This result is due to NIH supporting 276 fewer R21s last fiscal year, while having 626 more applicants. These decreasing R21 funding trends over time have led us to encourage applicants focus their attention on other NIH grant types (like R01-equivalents), especially as R21s are shorter and smaller grants and do not necessarily increase success for a future larger award.
Figure 3: Cumulative Investigator Rate: R21s
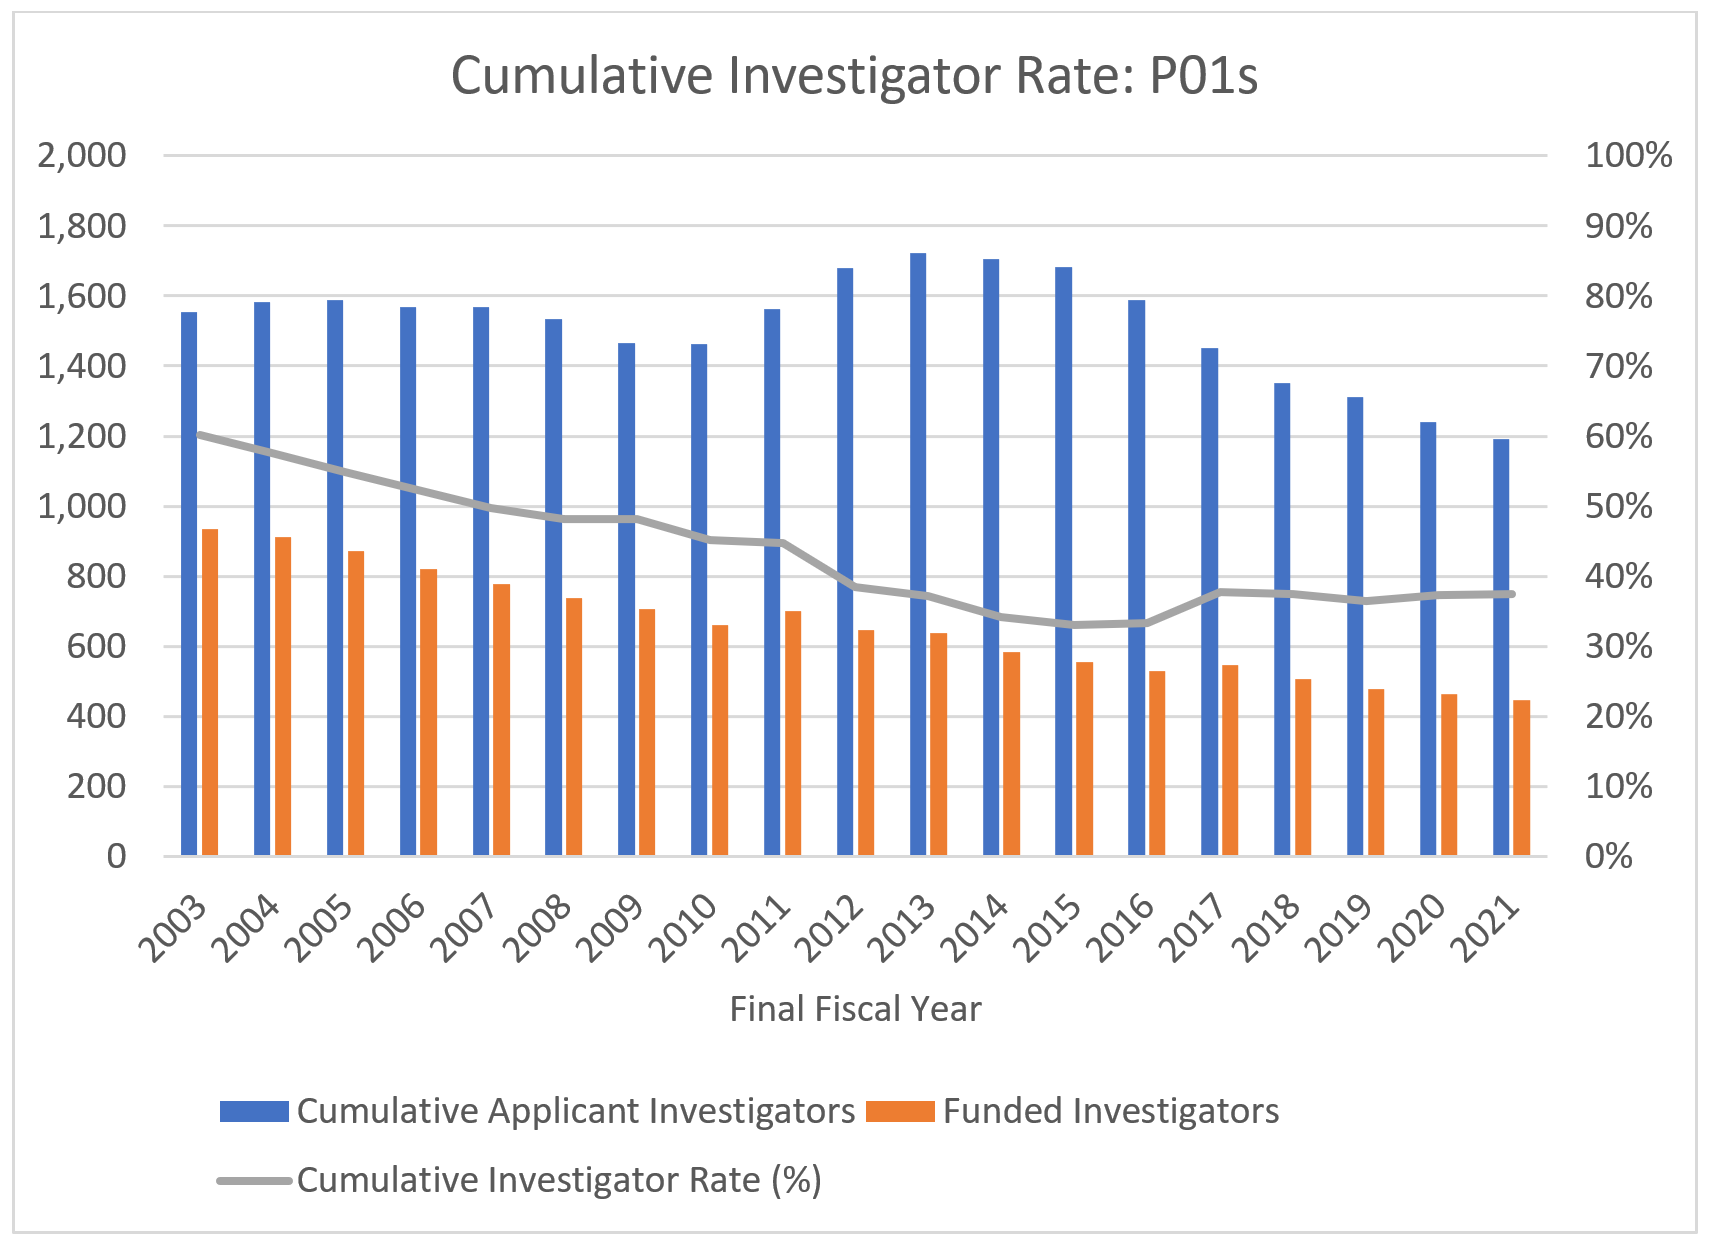
Fewer investigators applied for P01 program grants in FY 2021, and there were also fewer awardee investigators (Figure 4), a drop of 50 applicants and 16 awardees respectively compared to FY 2020. The cumulative investigator rate, however, did tick up 0.2 points to 37.5% in FY 2021.
Figure 4: Cumulative Investigator Rate: P01s
We remain pleased that the cumulative investigator rate for RPGs and R01-equivalents continues to go up each year, even as the public health emergency continues.
I would like to thank my colleagues in the Office of Extramural Research Division of Statistical Analysis and Reporting for their work on these analyses.
0 Comments