
3 Comments
We previously showed in this January 2022 blog (based on this paper) that the inequalities in the distribution of Research Project Grant (RPG) funding to principal investigators increased, especially at the top end of funding, during the NIH budget doubling and the first few years after the 2013 budget sequestration. The degree of inequality appeared to fall, however, after NIH implemented the Next Generation Researchers Initiative (NGRI) near the end of FY2017. Here we present follow-up data that shows that the trends seen in recent years appear to be continuing in fiscal year (FY) 2023.
When reading this post, please keep in mind that, in general, NIH awards grants to institutions, not individual scientists. For simplicity here, we refer to PIs receiving awards, but understand this means the scientists designated by their institutions as Principal Investigators.
Measuring Inequality
Our previous post details how economists describe inequality, which we used for our analyses here. In brief:
- The “Top-proportion” allows us to track the percent of funds awarded to the top XX percent of investigators. For example, what percent of funds go to the top 1% of investigators. Were funds allocated uniformly, the top 1% of investigators would receive 1% of the funds. In an extremely unequal situation, the top 1% of investigators might receive over 50% of the funds.
- The “standard deviation of the log of funding (“SD-log”)”, by contrast, reflects more on the low and middle rungs of funding.
- The “Theil Index” is more sensitive to the higher rungs of funding, like the top-proportion approach. It enables us to explore inequalities between groups as well as those within groups.
Inequality of RPG Funding for Principal Investigators
As we saw previously, the percent of RPG funds going to the top 1% and top 10% of investigators increased during the NIH budget doubling and following the first years after budget increases following the FY2013 budget sequestration (Figure 1, panels A and B). After the announcement of NGRI late in FY2017, however, the degree of inequality fell. We can see that in FY 2023 the percent of funds going to the top 1% of investigators dropped below FY2013 levels (Figure 1, panel B). The Theil index showed a similar trajectory (Figure 1, panel D). we did not see any clear trends in the SD-log (Figure 1, panel C), suggesting no changes seen for researchers at the lower or middle rungs of funding.
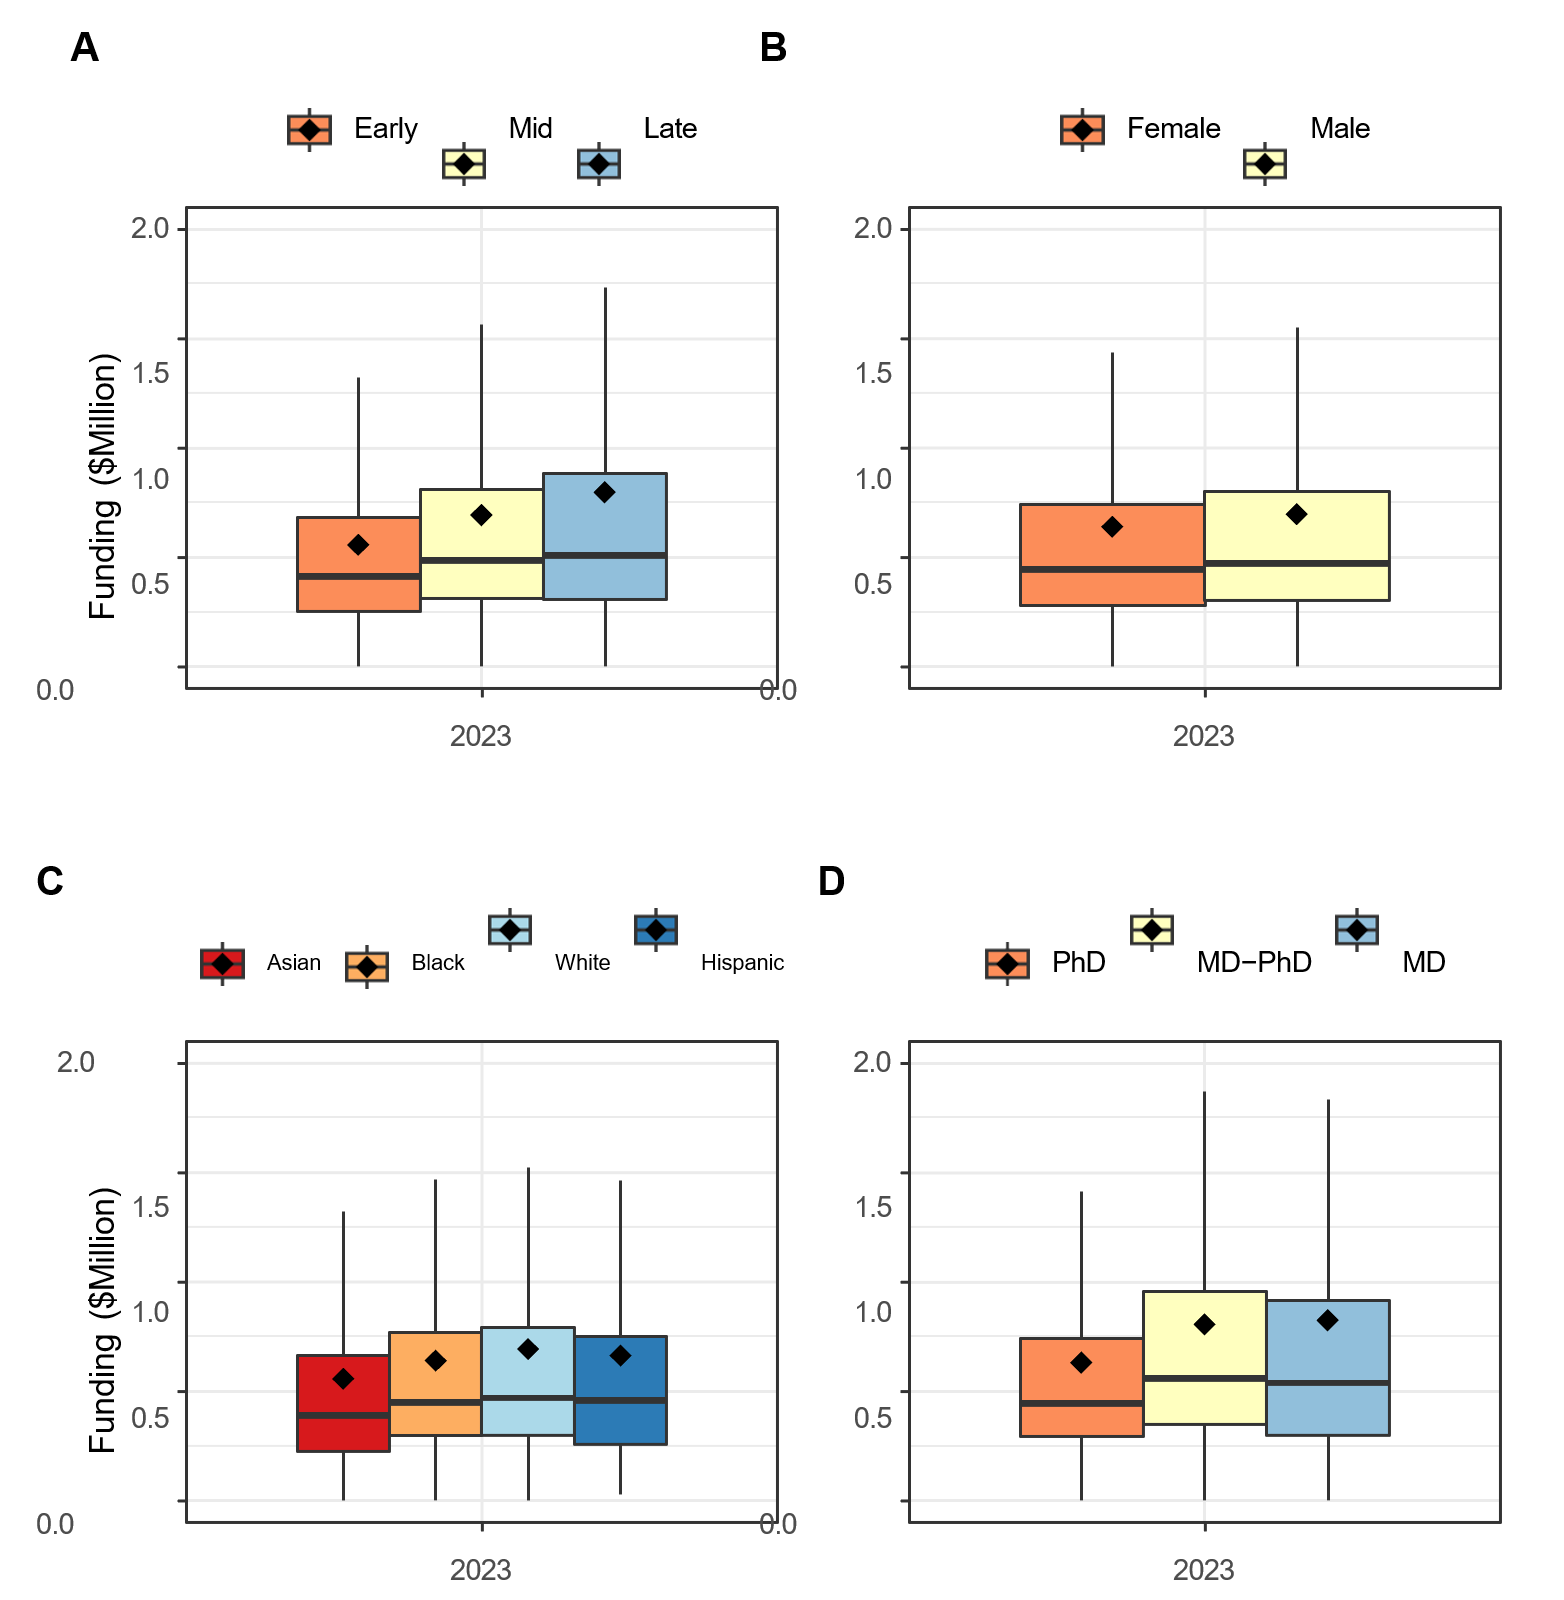
The FY 2023 data also demonstrate similar characteristics for the top 1% of funded investigators as seen before. They are more likely to be in late career stages (Panel A), male (Panel B), white (Panel C), hold an MD degree (Panel D), and supported by multiple RPG awards (see also Table 1).
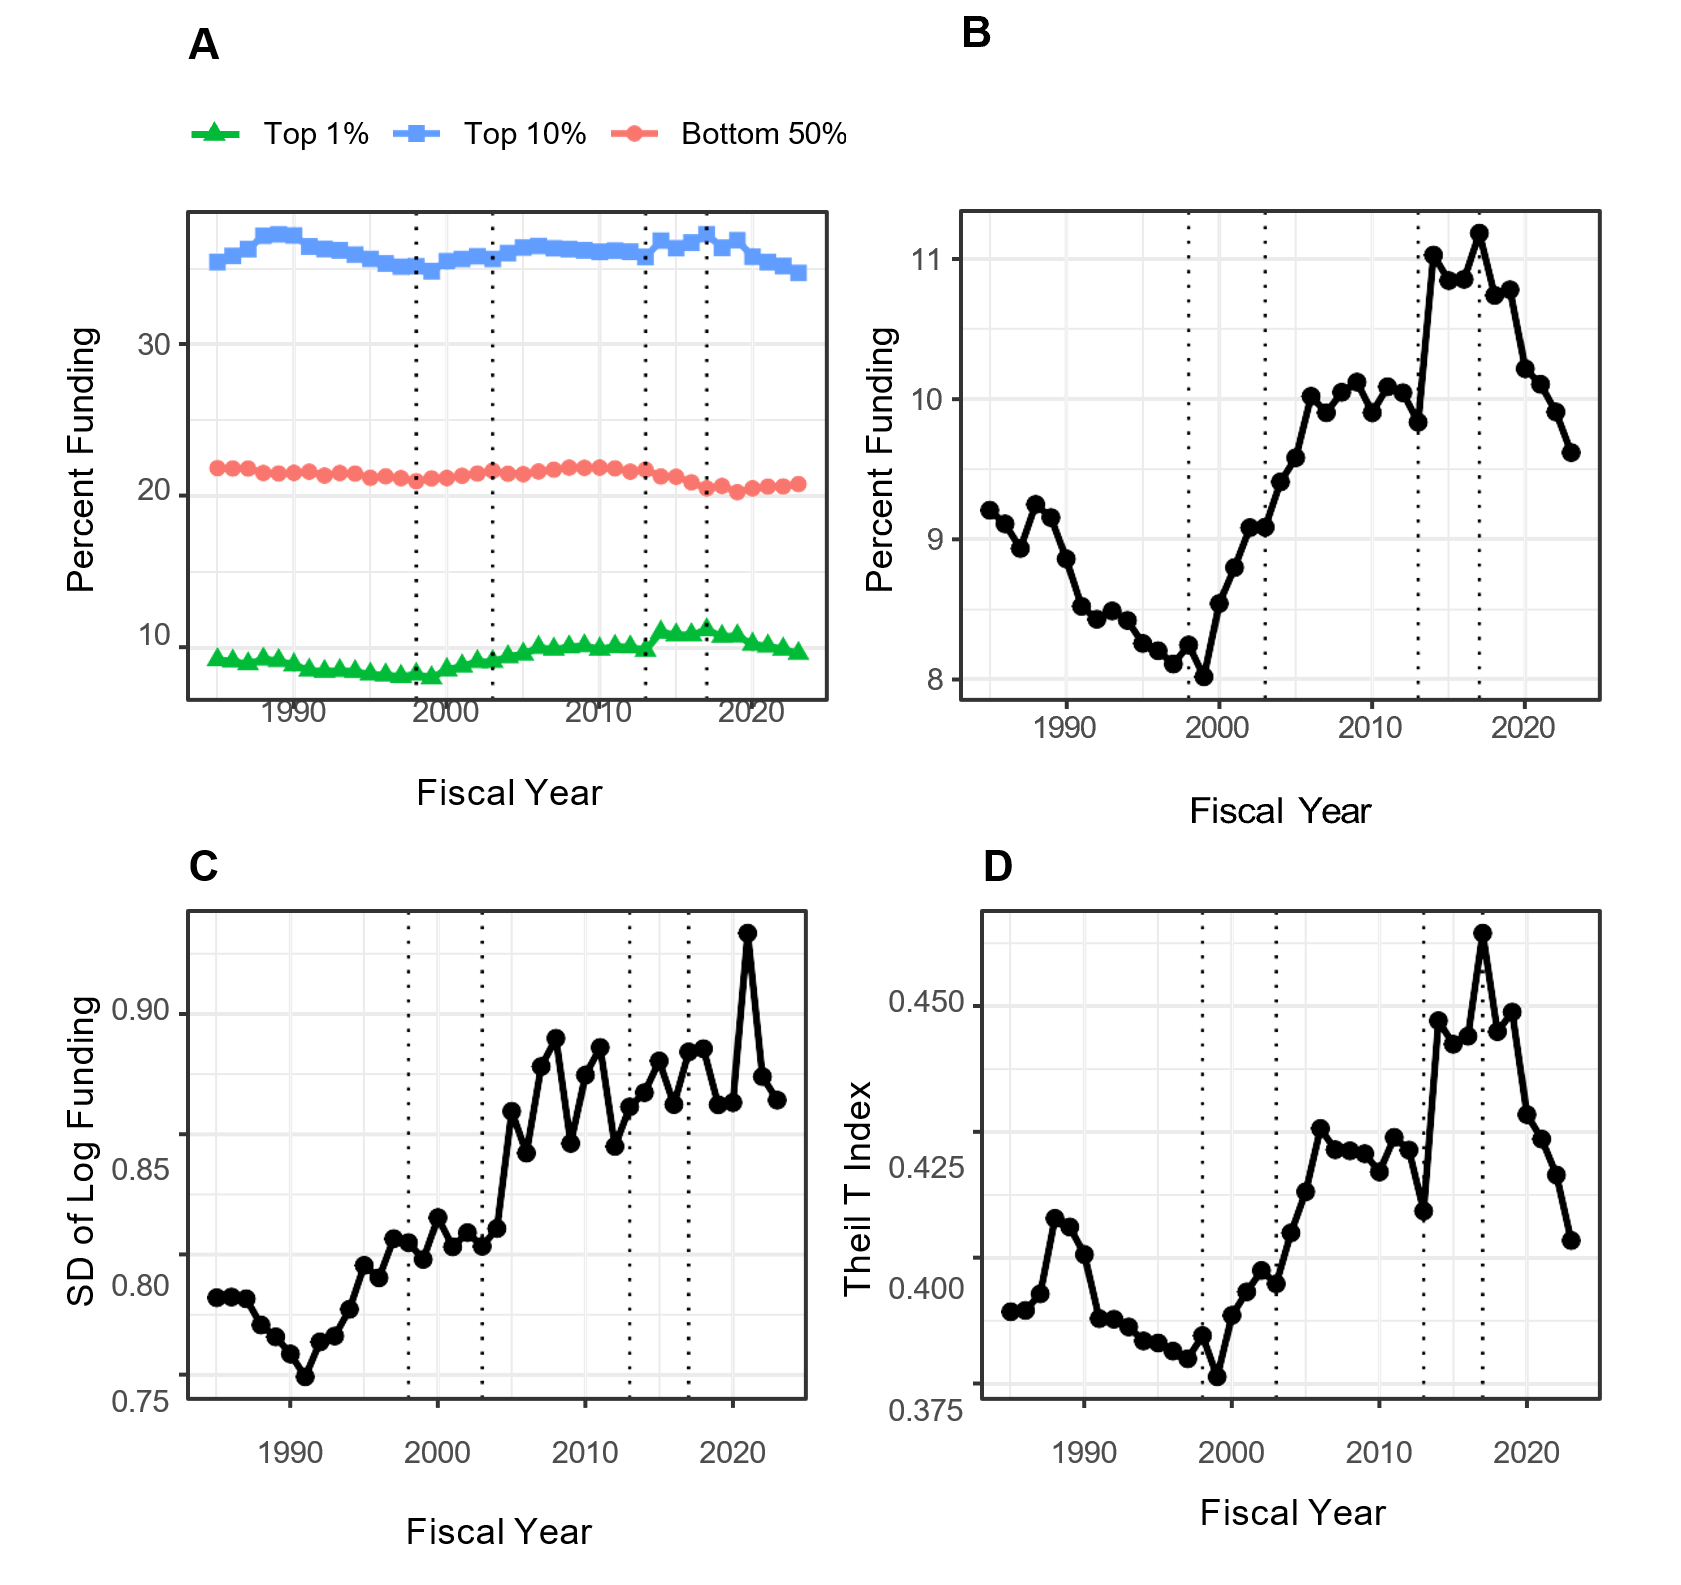
Table 1: Investigator Characteristics According to Centile of Funding in Fiscal Year 2023.
Values shown in parentheses are percentages for categorical variables and IQR for continuous variables. IQR = inter-quartile range. ND = not displayed due to small cell size.
| Characteristic | Top 1% | Bottom 99% | |
| Total N (%) | 380 (1.0) | 37719 (99.0) | |
| Career Stage | Early | 32 (8.4) | 11381 (30.2) |
| Mid | 145 (38.2) | 14458 (38.3) | |
| Late | 177 (46.6) | 9008 (23.9) | |
| Gender | Female | 119 (31.3) | 13951 (37.0) |
| Male | 255 (67.1) | 22492 (59.6) | |
| Race | White | 266 (70.0) | 22938 (60.8) |
| Asian | 61 (16.1) | 8717 (23.1) | |
| Hispanic | ND | 1902 (5.0) | |
| Ethnicity | Black or African-American | ND | 926 (2.5) |
| More than One Race | 4 (1.1) | 458 (1.2) | |
| Hispanic | 17 (4.5) | 1933 (5.1) | |
| Not Hispanic | 329 (86.6) | 32572 (86.4) | |
| Degree | PhD | 205 (53.9) | 26822 (71.1) |
| MD | 118 (31.1) | 5661 (15.0) | |
| MD-PhD | ND | 3819 (10.1) | |
| Funding in $Million | Other | 8 (2.1) | 1417 (3.8) |
| Median (IQR) | 4.8 (4.0 to 6.8) | 0.4 (0.3 to 0.8) | |
| Number of RPG Awards | One | 84 (22.1) | 25432 (67.4) |
| Two | 85 (22.4) | 8191 (21.7) | |
| Three | 83 (21.8) | 2790 (7.4) | |
| Four | 50 (13.2) | 887 (2.4) | |
| Five or More | 78 (20.5) | 419 (1.1) | |
Inequality Between and Within Groups
Next, we sought to understand if the inequalities seen were “within-group” or “between-group.” As a reminder from our prior post, we can consider height inequalities of athletes to conceptualize this concept. For instance, there is a great deal of “between-group” inequalities in the heights of jockeys and professional basketball players. On the other hand, we would primarily observe “within-group” inequalities if we focused on professional basketball players from either the east or west coast.
Focusing our attention back on NIH supported scientists categorized by career stage, we can use Theil index to assess these types of inequalities. A visual look at the distribution of funding for these PIs in FY 2023 shows the inequalities are primarily within- group for gender, race-ethnicity, and degree (Figure 2).
Organizational Inequalities
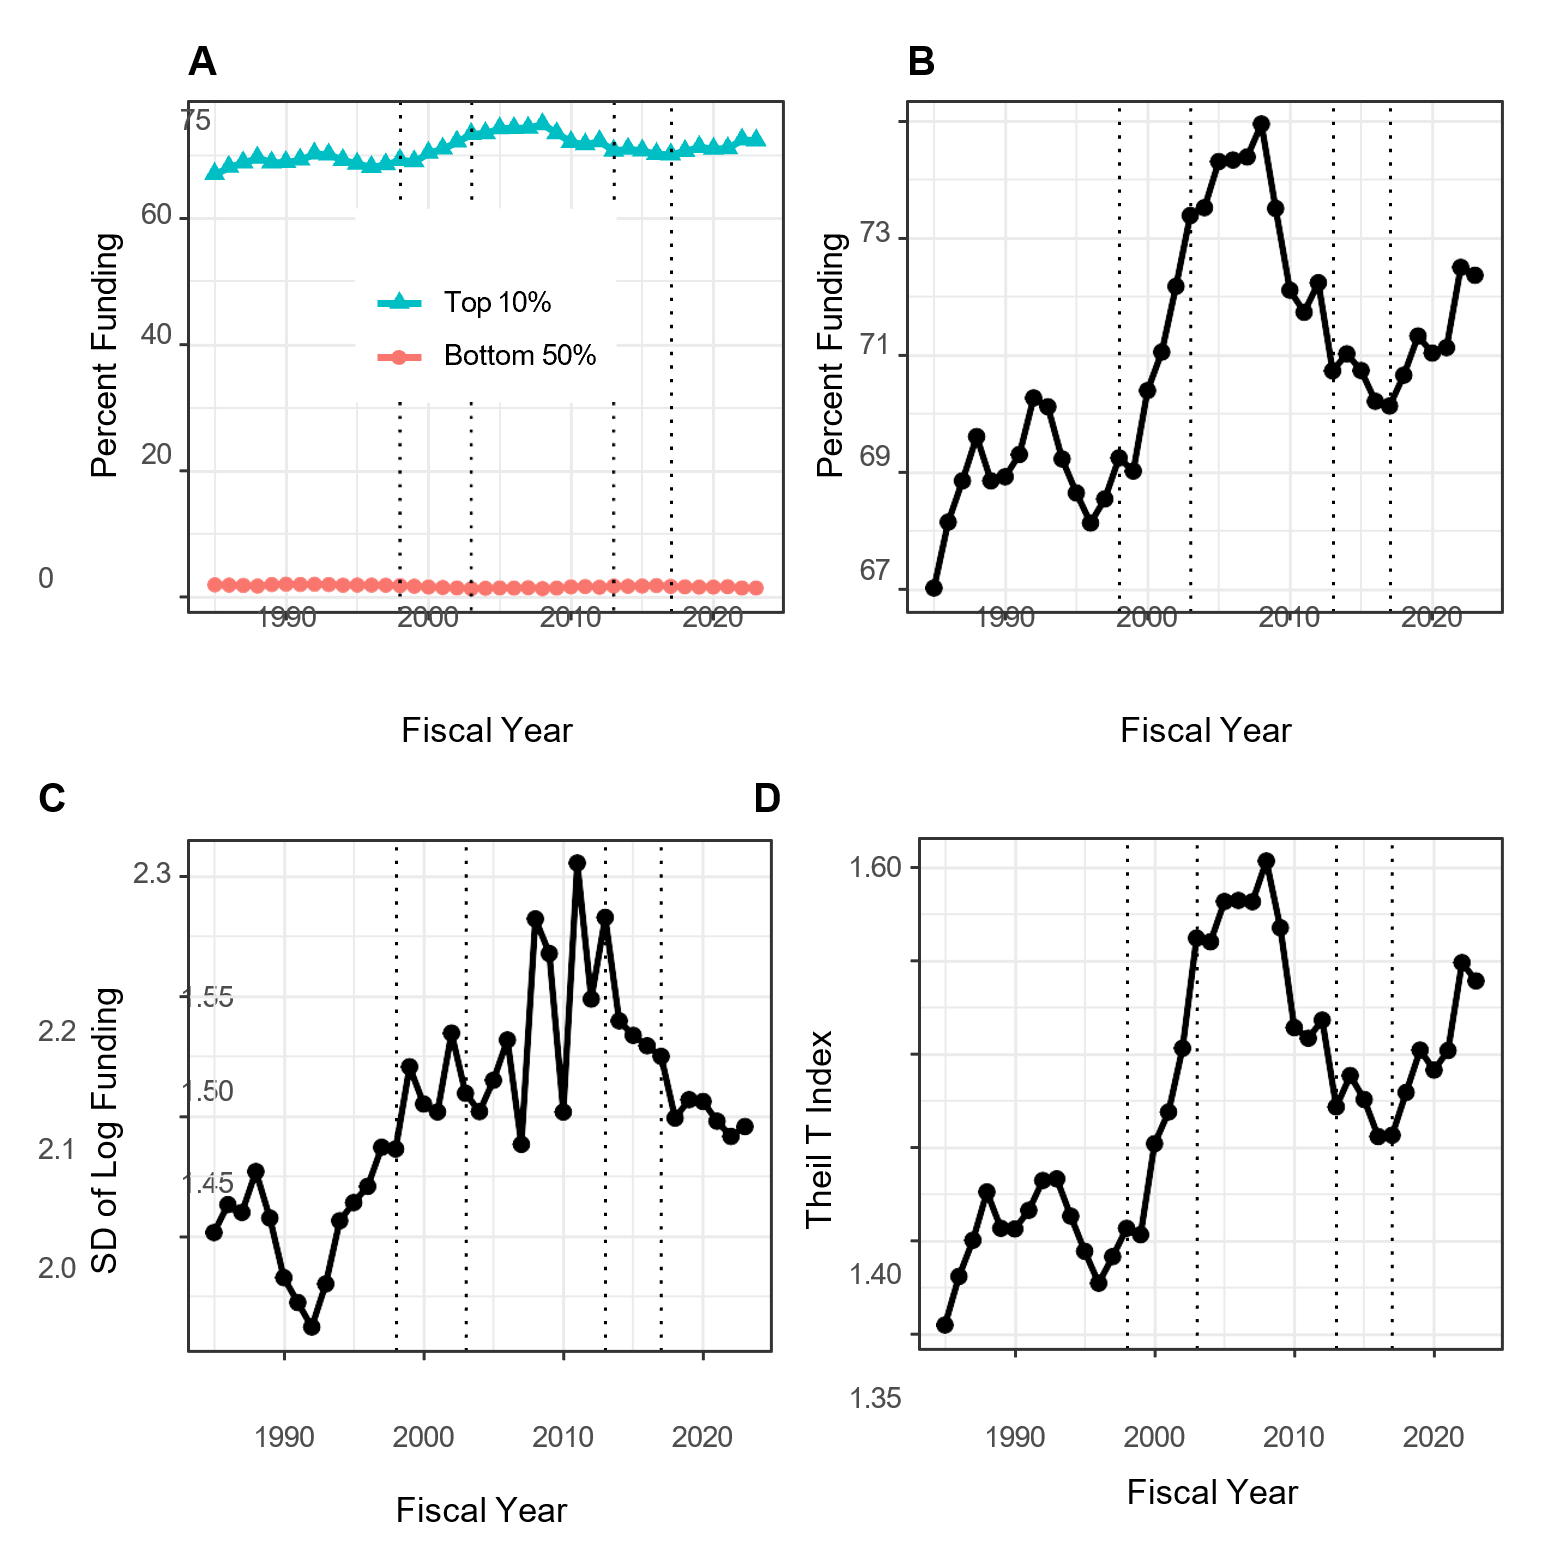
While investigator inequalities declined since FY2017 (Figure 1, panels A, B, and D), we saw an increase in organizational inequalities over the same time (Figure 3, Panels A, B, and D). The degree of organizational inequality was still lower in FY2023 than when it peaked in the late 2000s.
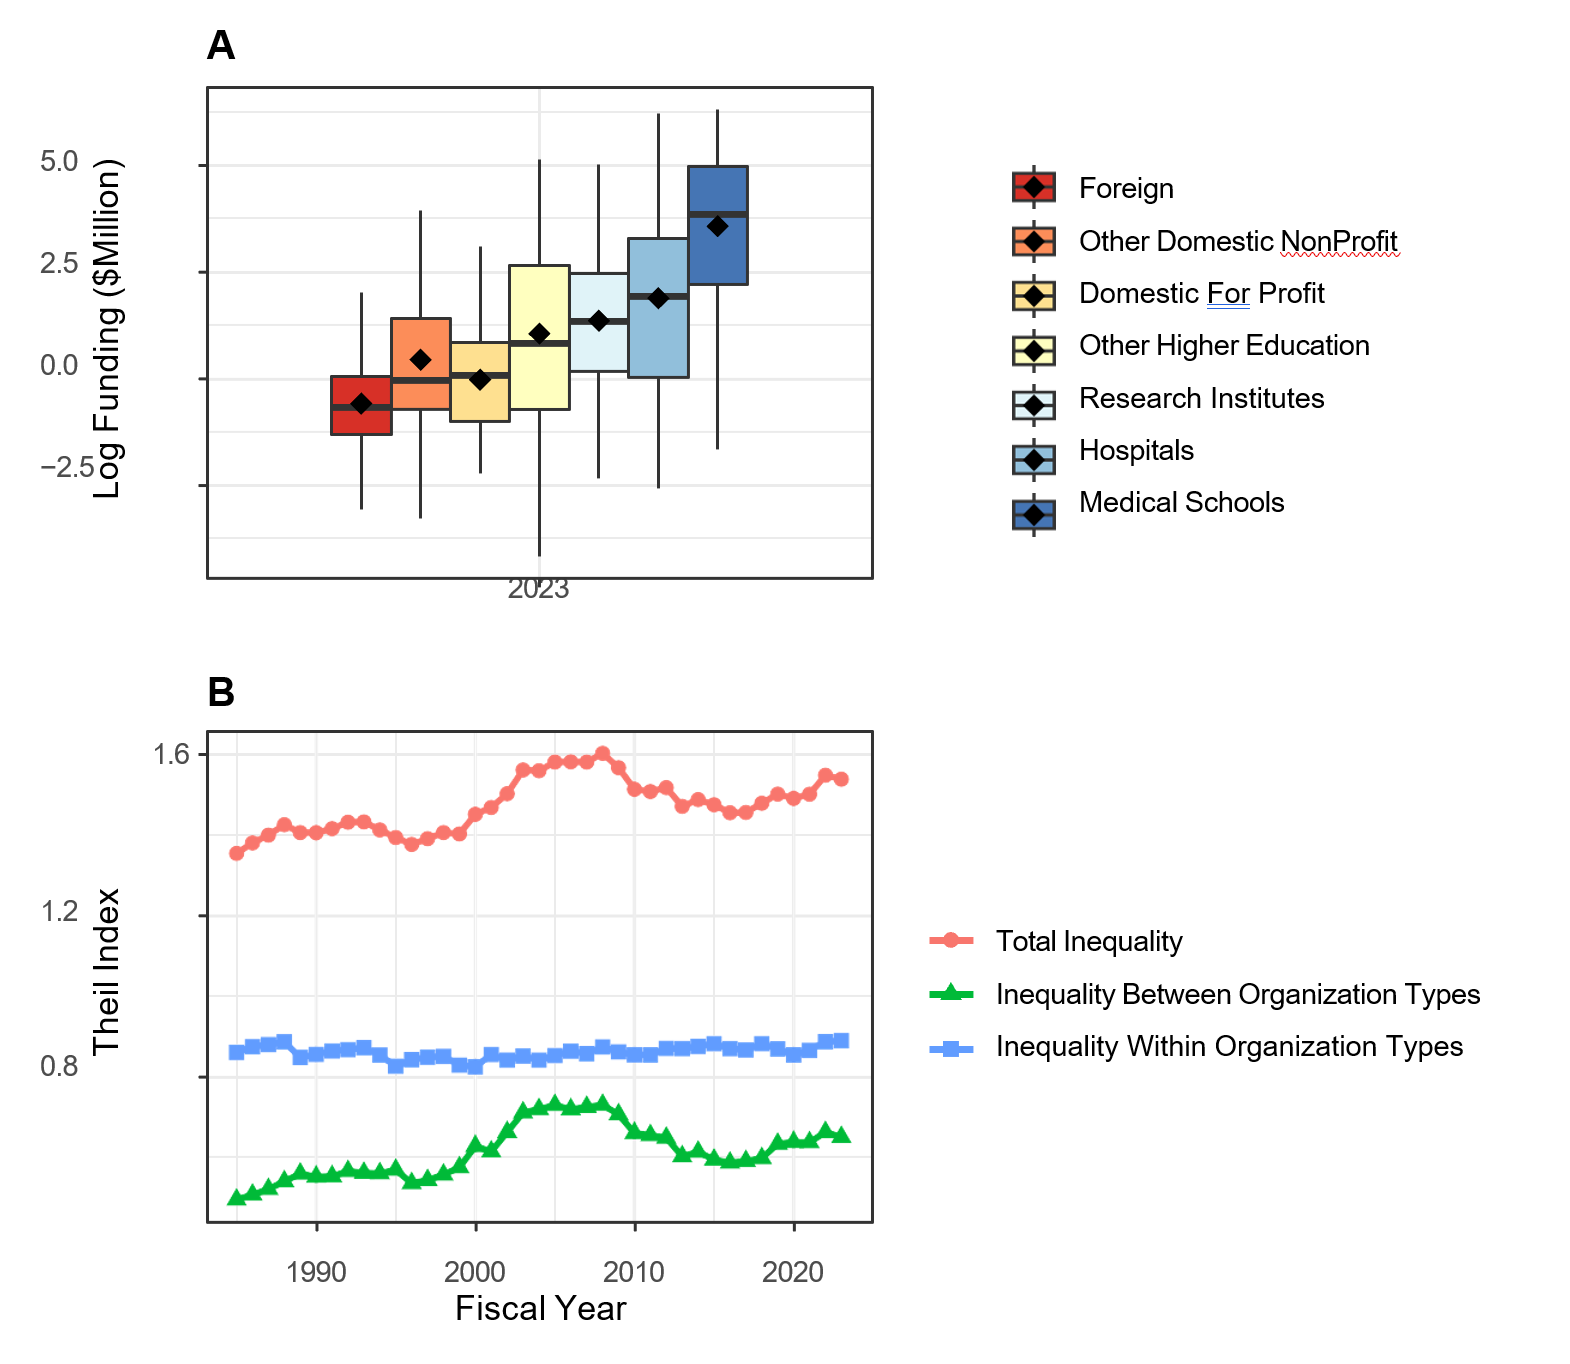
There were also between-group inequalities, with medical schools receiving substantially more funding than other kinds of institutions (Figure 4).
Our follow-up (FY 2023) analyses continue to show that investigator inequalities substantially declined since NGRI. However, organizational inequalities modestly increased during the same time. We will continue to follow these data to better understand how our programs and policies can help us reduce funding inequalities when possible.
This was an exceptionally informative publication and we thank yo so very much. Our organization, which is quite small and receives a small 1.4 million dollar grant from NIH had to make a series of obscure hurdles in the submission process. With a single grants manager who serves other roles in our organization, the submission was wrought with possible single critical failures, as NASA would say, that would have tanked our months of work before it was able to be reviewed. As an example, after submitting our first proposal years ago, we had not received a confirmation and wondered what was wrong. After over an hour of calls, we were informed we had not had a “signing official signature”. Such things have improved, but there is so much more that could be done to ensure small institutions can compete with universities that had pre-approval grant managers that exceed the total employees of a the small institutions. I will not go into the details, but a very detailed seminar for small org submitters that includes small numbers of attendees to allow for many questions would be wonderful.
On another level, the review process, in which I have participated in multiple times. had a substantial improvement with the bias training recently instituted. My experience is that the readers give famous institutions with massive funding streams and seasoned PI’s, far more latitude and do not question the proposal on the same level they do for smaller institutions.
More access to program, managers/officers in the proposal process would help. They have been very helpful in ensuring we execute the grant to its best level.
How would the numbers change if awards funding clinical trials were excluded?
What is very clear, Hispanics are segregated and not supported by NIH funds, we are 60 million and get nothing from the NIH and elsewhere, no matter how well trained we are. So, latinas are the absolute worse in terms of support and all your talk about equality in ethnicity and female gender is just that bla, bla, bla.
Also, worth mentioning MD and worse MD/PhD are not supported, the more training we have, the worse treatment in terms of reviews. I wonder why?
So the combination of highly trained Latinas, highly productive, MD PhD is dismal, so stop talking about equal opportunity, there is no such thing. You get treated like trash,