
Now that fiscal year (FY) 2020 grants data are available in the NIH Data Book, let’s see how many unique scientists sought support on NIH research project grants (RPGs). The “cumulative investigator rate,” a person-based metric that looks at the likelihood that unique investigators are funded over a five-year window, has moved in a positive direction in recent years (see here for FYs 2019, 2018, and 2017), and we were pleased to see the trend mostly continue into FY 2020.
Before diving into the 2020 data, a quick reminder about the NIH’s five-year cumulative investigator rate. To determine it, we take the number of unique principal investigators who were designated on an NIH RPG, activity or mechanism (simply referred to as “awardees” here) divided by the number of unique principal investigators who were designated on applications (simply referred to as “applicants” here) over a five-year period. This timeframe was chosen because most research grants last for more than one year and applicants submit applications with the goal being securing multiple years of funding.
As this is an NIH-wide metric, if an investigator is designated on separate awards from multiple NIH Institutes or Centers in a particular five-year timeframe, they will still only be counted a single time across the entire period at the NIH level. Please also keep in mind that this metric is distinct from the success rate computed annually for applications (i.e. not people) submitted to NIH.
The FY 2020 data presented here also includes awards issued using special supplemental COVID-19 appropriations (e.g. Public Law 116-123 and Public Law 116-136). We continue to review these additional related grants data, and encourage readers to visit our COVID-19 funding page or RePORTER to learn more.
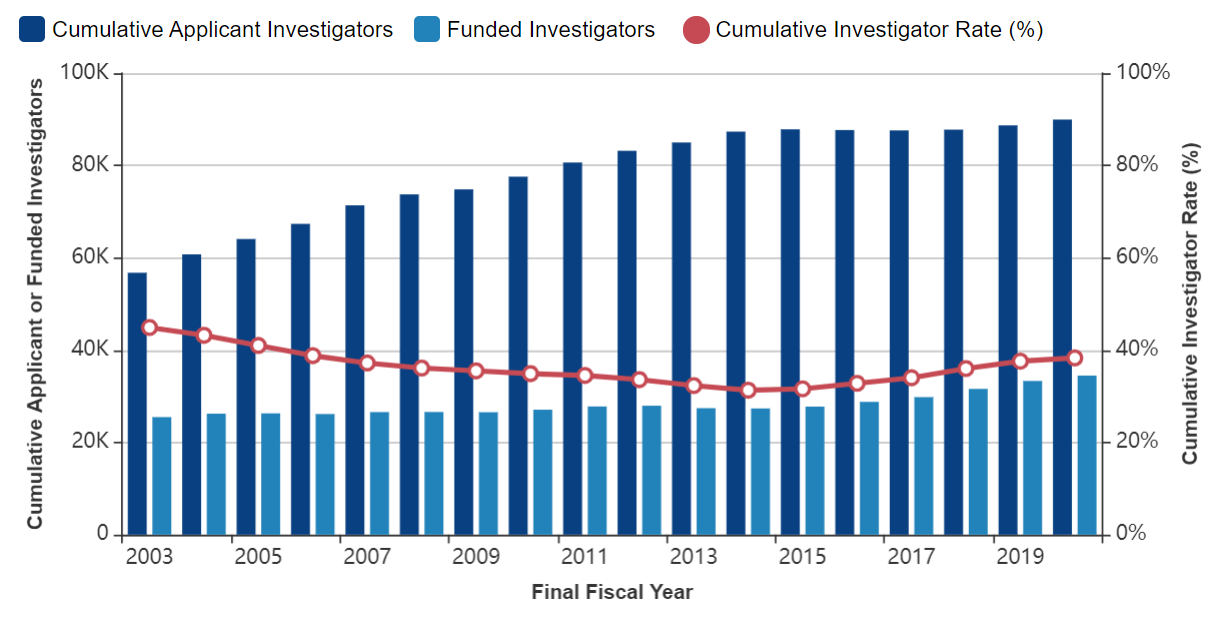
Starting with research project grants (RPGs) in Figure 1, there were 89,957 unique applicants who over a 5-year window sought to be funded in FY 2020 (dark blue bar), a 1.4 percent increase over FY 2019. The number of awardees rose 3.5 percent over FY 2019 to a total of 34,477 (light blue bar). This made for a 38.3 percent cumulative investigator rate (red line).
Figure 1: Cumulative Investigator Rate: Research Project Grants
We next focus on R01-equivalent, P01, and R21 grant types. For simplicity in describing the data, the table below reports information for FY 2020. We encourage readers to review all of the available data in the NIH Data Book to get a fuller picture going back to FY 2003.
| Grant Type | Cumulative Applicant Investigators | Funded Investigators | % Applicant Change from 2019 | % Awardee Change from 2019 | Cumulative Investigator Rate (%) |
| R01-equivalent | 66,208 | 28,235 | 2.3% | 4.4% | 42.6% |
| P01 | 1,241 | 463 | -5.4% | -3.3% | 37.3% |
| R21 | 39,906 | 4,960 | -0.8% | -3.4% | 12.4% |
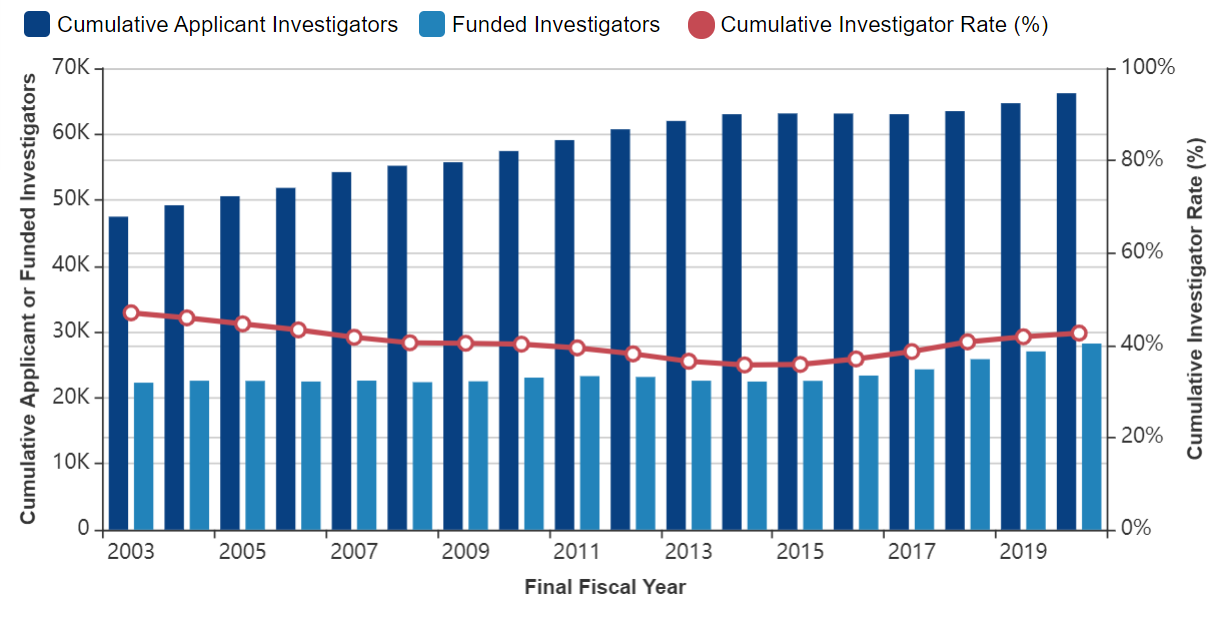
Figure 2 shows the steady rise (beginning in FY 2014) in applicants and awards for R01-equivalent grants continued in FY 2020, with a corresponding increase in the cumulative investigator rate to 42.6 percent.
Figure 2: Cumulative Investigator Rate: R01-Equivalents
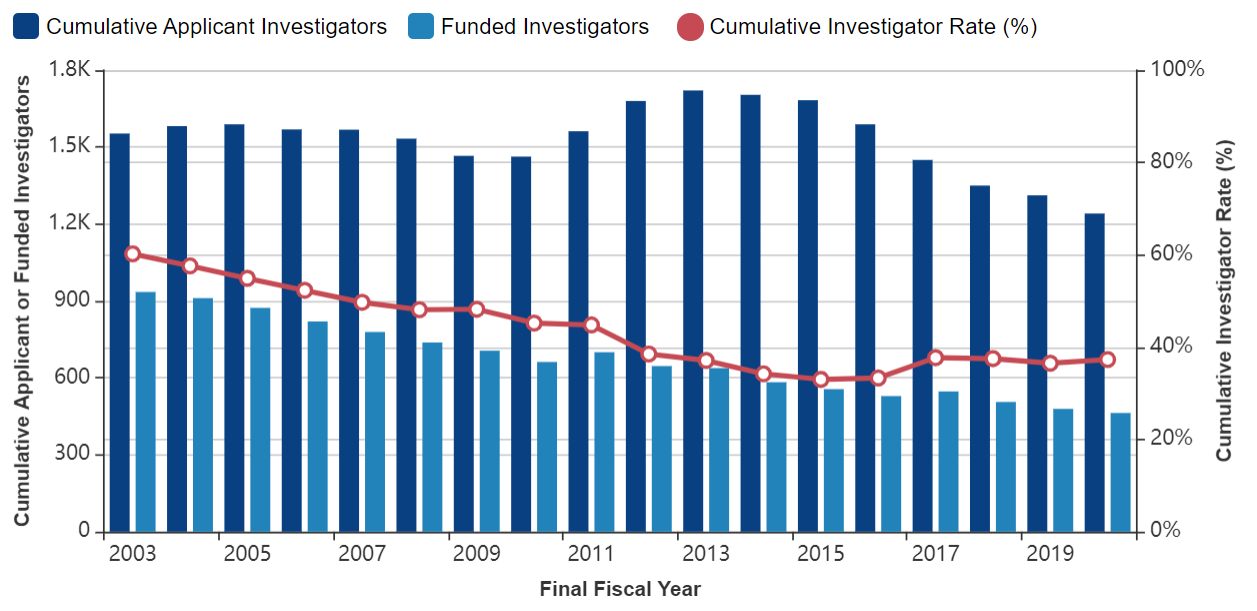
For P01 program projects (Figure 3), fewer applicants and awards were seen again in FY 2020, but the cumulative investigator rate still increased slightly from the previous year to 37.3 percent.
Figure 3: Cumulative Investigator Rate: P01s
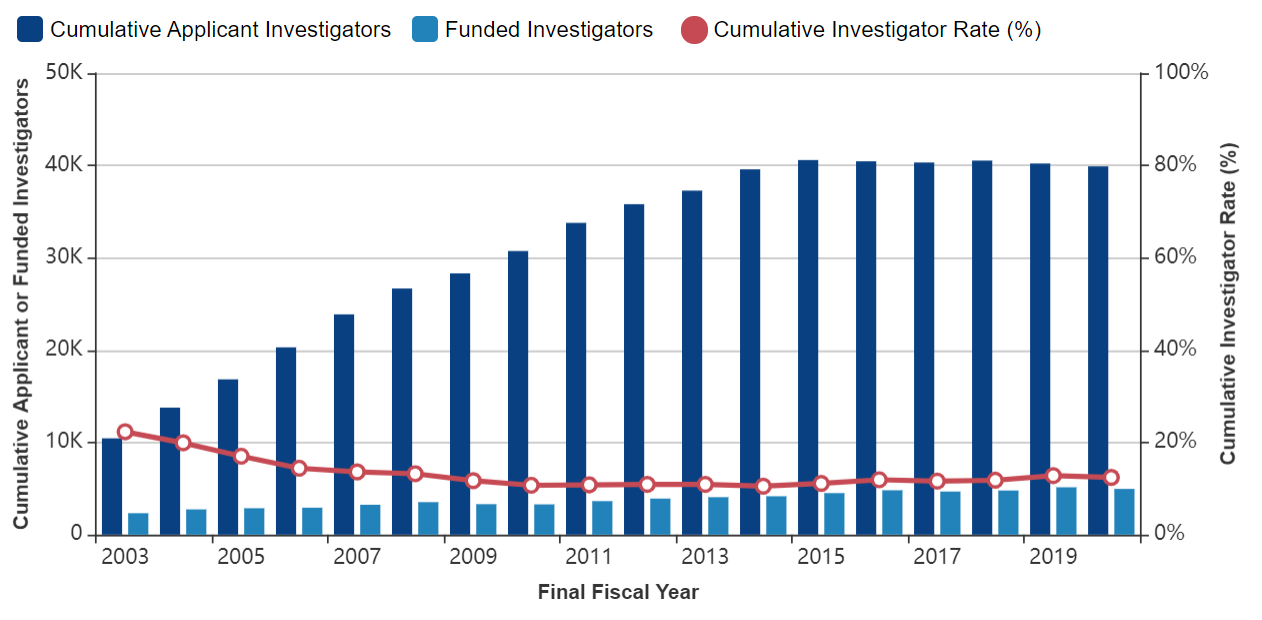
Though rising for the other grant types, the cumulative investigator rate for exploratory R21 grants slightly decreased to 12.4 percent in FY 2020 compared to 12.8 percent in FY 2019 (Figure 4). The total number of applicants and awardees were also lower last year compared to the previous year. That said, all three values were still higher than at their lowest in FY 2014.
Figure 4: Cumulative Investigator Rate: R21s
We recognize that, while the cumulative investigator rate is moving in the right direction, many researchers, such as women and those from diverse backgrounds, still face varied challenges when seeking and receiving NIH support. More analyses on this person-based metric are expected going forward, including understanding any on-going effect the pandemic may have.
0 Comments