
19 Comments
In May 2016, we posted a blog on “How Many Researchers” NIH supports. We cited the findings of a University of Wisconsin workshop, which concluded that the biomedical research enterprise suffers from two core problems: too many scientists vying for too few dollars and too many post-docs seeking too few faculty positions. We also noted that NIH leadership and others were increasingly interested in describing the agency’s portfolio not only in terms of the numbers of awards and dollars (as we do each year in our “By the Numbers” reports), but also in terms of the numbers of researchers those awards support. Today we show updated figures on how many researchers are vying for NIH support and how many are successful.
Figure 1 shows the number of unique applicants and awardees for Research Project Grants (RPGs). The green (triangle) and red (circle) lines (and points) refer to unique people who applied for and received funding as a principal investigator on at least one RPG. As before, the number of applicants is based on a 5-year window – that is, the number of applicants seeking funding in 2017 includes scientists who submitted applications in 2017, 2016, 2015, 2014, and 2013. We see that the number of applicants increased substantially from 2003 (when the NIH doubling ended) to 2015, but since that time has slightly decreased (from a peak of 87,885 in 2015 to 87,567 in 2017).
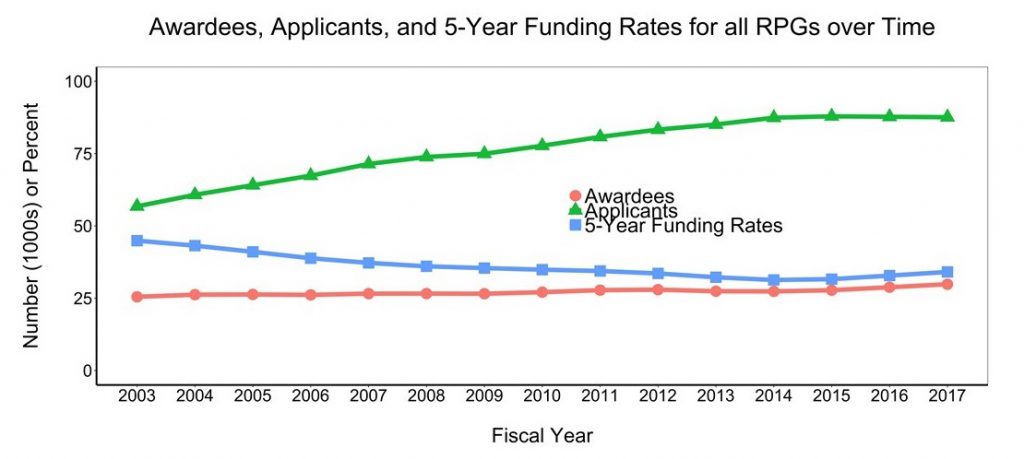
The number of awardees increased, particularly in the past 3 years (see Figure 2, from 27,761 in 2015 to 29,835 in 2017). As before, we used these two variables to generate a “cumulative investigator rate” (the ratio of unique awardees in any given year divided by the number of unique applicants over a 5-year window). This allows us to capture a broader view of NIH-supported scientists seeking funding over a window of time. The cumulative investigator rate increased since 2014 from 31.3% to 34.1% as shown in Figure 1 (blue line with squares) and Figure 3), reversing a long-standing downward trend – but still much lower than 2003 when it was 44.9%.
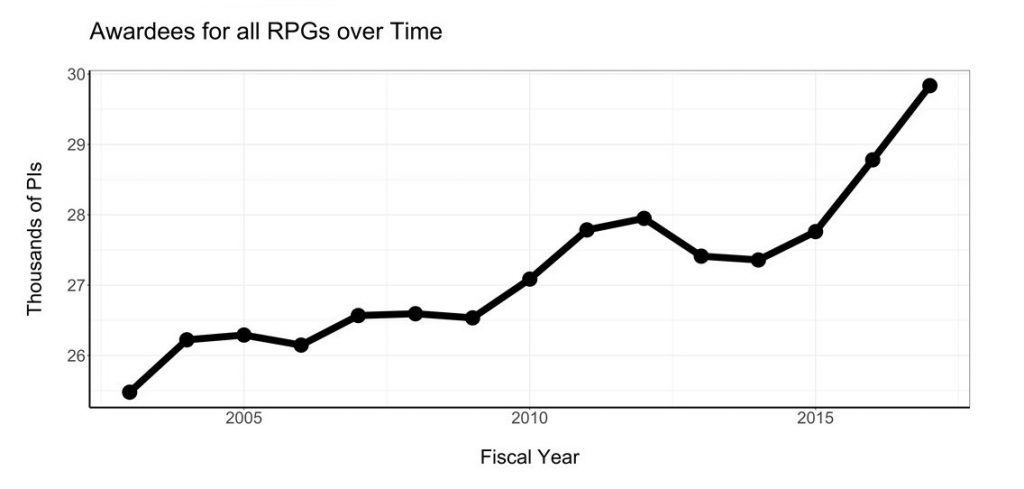
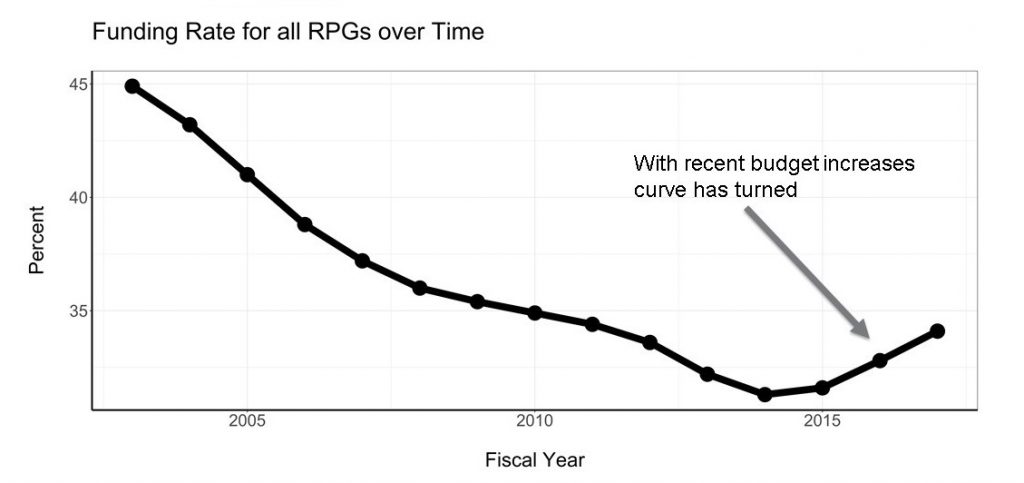
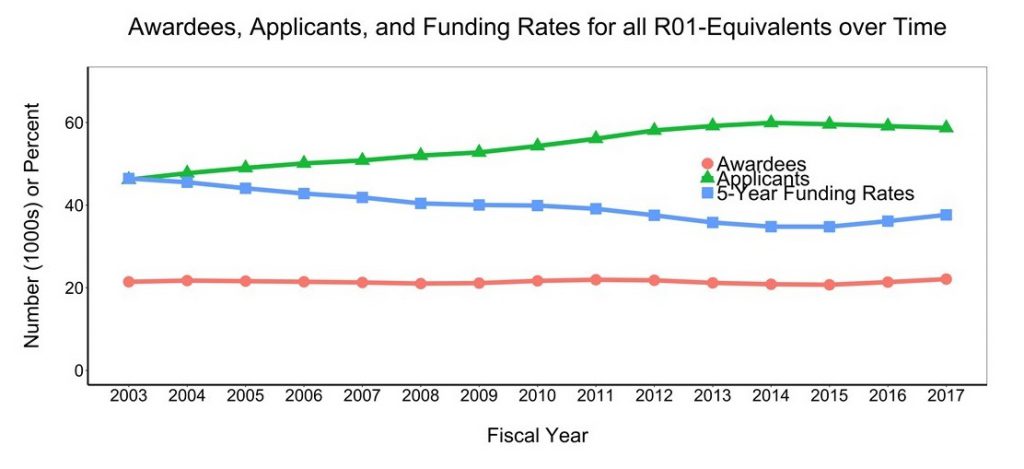
Figure 4 shows corresponding data for R01 equivalents (R01, R37, RF1 and – for FY 2017 only – DP2 awards). Since 2015, the number of unique R01 awardees increased from 20,726 to 22,100, but this number is only slightly higher than it was in 2003 when it was 21,447. The number of unique R01 applicants has declined slightly, from a peak of 59,926 in 2014 to 58,669 in 2017, still much higher than it was in 2003 when it was 46,166. The 5-year cumulative investigator rate increased from 34.8% in 2014 to 37.6% in 2017, again reversing a long-standing trend, but still much lower than 2003 when it was 46.5%.
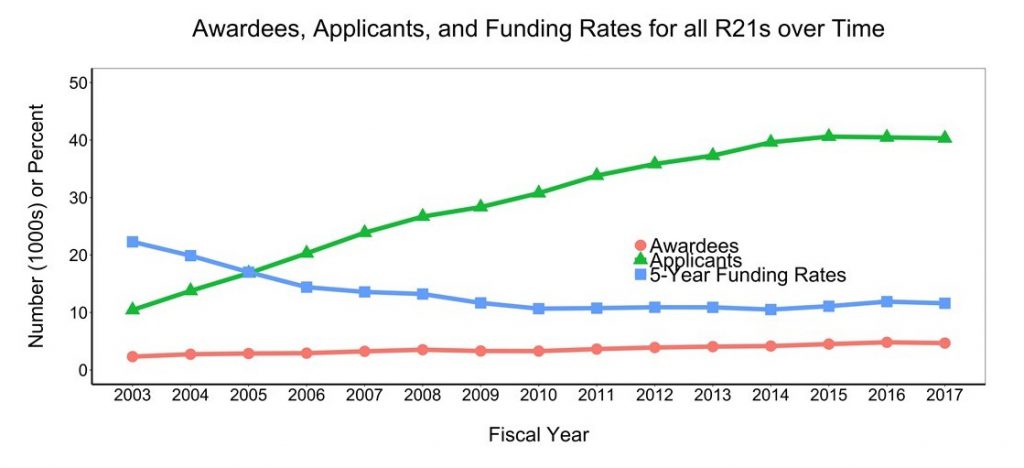
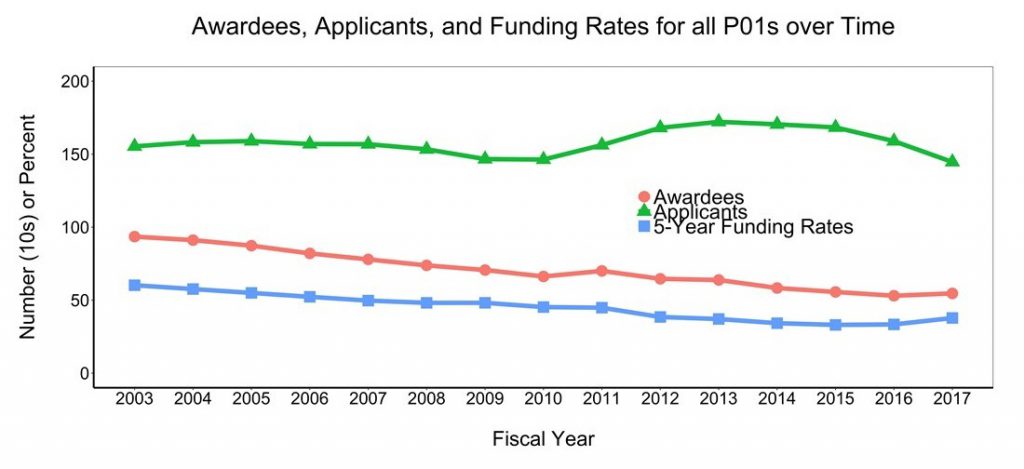
Figures 5 and 6 show corresponding data for R21 and P01 awards. For R21 awards, the patterns are similar as with R01 equivalents, though funding rates are much lower (11.6% for R21s compared to 37.6% for R01s). The number of P01 applicants and awardees continue to decline (Figure 6).
An important caveat is that the data shown in these figures focus on principal investigators, not all scientists and personnel involved with NIH research awards. Those data are more difficult to capture, though we have reported on those previously and anticipate taking another look before too long.
Looking at these data, it appears that:
- We are still very much in a state of hyper-competition, though the severity may be a bit less than it was a few years ago.
- The number of unique applicants appears to be stabilizing after many years of un-interrupted growth. This may reflect a previously described decline in the numbers of post-doctoral fellows.
The cumulative investigator rate, a person-based metric that looks at how many individual investigators are seeking funding over 5-year windows, has reversed its longstanding decline. The recent improvement (though still far lower than it was at the end of the NIH-doubling) may reflect increased extramural research budgets as well as increased interest in programs that focus on funding and supporting a larger number of independent investigators.
Umm… I am confused. This article states “The cumulative investigator rate, a person-based metric that looks at how many individual investigators are seeking funding over 5-year windows, has reversed its longstanding decline. The recent improvement (though still far lower than it was at the end of the NIH-doubling) may reflect increased extramural research budgets as well as increased interest in programs that focus on funding and supporting a larger number of independent investigators.”
Isn’t the real issue that the NIH doubling increased the production of Ph.D.s which led to an increase in the number of people who are seeking independent NIH funding? As the average R01 award has been increasing at the same rate as the increase in the NIH budget essentially, an increase in the number of applicants will essentially cause negative pressure on paylines, thus keeping the current hypercompetitive environment alive and well. It is entirely possible that such hypercompetition is good for biomedical research overall since it means that there is culling of weaker research programs (ie makes research more like acting where only an elite few succeed with the goal of culling those who are not the elite). However, if that is the policy, let us not pretend differently with a lot of navel gazing about those who are lost from the field. In a competitive model, this would be a “feature” not a flaw.
Agree with Seasoned reviewer – that increasing the number of people chasing each dollar doesn’t do anything to improve overall research output, except insofar as the weak are culled and only the elite remain. Let’s not pretend differently.
Also, with the recent Wisconsin study out in full view, showing results that are completely plausible to this likewise seasoned reviewer and member of “the elite”, let’s also not pretend that a study section can in any reliable way differentiate between the great proposals and the greatest proposals.
A corollary to the foregoing, of course, is that we are not culling the weak, but only the merely great. We do so by assigning priority scores of 1 through 6 with all the rigor of a roll of a dice, yet while dispatching those with priority scores of 7 through 9 with the same fate as scores from 3 through 6. Is it any wonder that our best and brightest students are not drawn to research careers?
37.6% funding rate for R01s? Who are you kidding? I haven’t seen a proposal funded above 20% for years, and most programs seem to have paylines around 10-11%. You are playing with the numbers here, measuring “unique investigators” so that if someone submits 3 proposals and only gets one funded, you can call that a 100% success rate. From outside of NIH, it appears that paylines are falling, budgets are routinely cut by 20% or more, and we spend ever more of our time writing proposals, and less of it doing the work we most want to do – research.
If you’re going to publish graphs like this, you should include a straight plot of the percent success rate of R01 proposals. That’s what really counts to those of us on this endless treadmill.
Agreed, most institutes are in the 8-12% range for paylines. I believe that 37% reflects resubmissions, which may not be the fairest way to present the data. If it takes 3 tries and 3+ years to get that R01 grant, that is a considerable waste of time and effort that could be spent doing actual work rather than scrounging for money.
Agree with experienced investigator and reply…..only with the caveat that submitting more than an A-1 requires a massive re-write, so saying that grants on the 3rd and 4th try are getting funding argues against the NIH’s shortsighted elimination of the A-2, a mechanism that allowed a give and take from a thoughtful study section (a dying breed?) and a responsive reviewer to improve the application. At NCI, don’t tell me that the payline is above 7-8%, where it has languished for many years, driving so many talented investigators out of research. C’mon now, if you get a score of 9% you are not going to see a penny of funding!! Why can’t NIH say these words to us?????
Seasoned reviewer: Yes, but the hyper-competitive are the very people who are overproducing PhD graduates and post-docs. This will always be a pyramid scheme.
Seasoned reviewer, your analysis assumes that weaker researchers are being culled, as opposed to less well-connected ones.
Thank goodness for the “hyper-competitive” P.I.s who do the good science to get the funding to support the researchers who are indispensable to generating the preliminary results required to get more funding. (And don’t forget the required support positions indirectly covered by F&A, from janitors to IACUCs to staff scientists.) Funding means GOOD JOBS, and not just for P.I.s with R01s and institutions with training grants. Expand the definition of “researcher” to include staff scientists (e.g. PhDs who can’t find an academic position because funding is so tight) as well as postdocs, grad students, and technicians who are supported in part (or in total) by R01/equivalents, and it’s crystal clear that funding rates are decreasing.
I am not convinced that the “hyper-competitive” PIs are doing science that is any better than the slightly less “hyper-competitive” PIs who aren’t quite as well connected. Many of the “hyper-competitive PIs” are engaged in work that is currently deemed to be “cutting edge”, but can be more appropriately described as the “current consensus mainstream”.
It is clear that behaviorally aggressive gorillas (researchers) from larger and socio-politically significant troops (institutions) find it easier to collect bananas (grants) than less aggressive primates who have similar or superior publication, citation and impact metrics. These same chest-beating gorilla traits also make it easier to find high level university/institute jobs and publish in high impact journals. Until we change the culture to reward more of the thoughtful and insightful problem solvers, science will continue to be an unattractive field for many.
Excellent points, Contrarian Observer and Run On. The rich keep getting richer, and you raise several reasons why. Medical schools at R1-R2 institutions, by dint of both internal support but especially prior NIH grants, provide the physical and human resources (core facilities, animal colonies, etc.) to support research of all types. P.I.s at such institutions can more readily pitch “current consensus mainstream” as “cutting edge” with plentiful (if perhaps not biologically meaningful) preliminary data; they can afford fishing expeditions. Moreover, given the extensive infrastructure and personnel support, they can write more grants per unit time. In the end, they win funding more often, irrespective of the novelty of the question or the potential impact on the field.
I think we need (a) more funding overall (hello, Congress – biomedical research is a lot more important / will generate a lot more jobs than building a giant fence between the US and Mexico); (b) funding mechanisms for young and mid-career scientists alike, including but not limited to physician-scientists; (c) funding mechanisms for R3 and even M institutions which bridge existing (and significant) NIH investment in institutional infrastructure and scientist training with less-well-connected faculty at traditionally less-well-funded universities.
When I read NIH’s analyses of grant success I just wonder then why are PI’s shutting down labs, Assistant and Associate Professors not getting tenure because of lack of funding and having to leave academia, grad students not wanting to get into research in academia.
It is very clear that the PIs and labs at NIH don’t have to worry about funding as the rest of us.
In spite of NIH statistics telling us improvement in sucess rates I just don’t see how funding is getting better.
Agree with seasoned reviewers above. These 37-39% rates are not real. Only the paylines are real: 8-12% for the past 10 years. By comparison, paylines were 30% for many institutes from 1998-2003.
Given the capriciousness of the current review process, we are not culling the weak. We are an equal-opportunity culler, culling both strong and weak, young and old, wiping out established investigators with great track records as well as stopping promising careers in their tracks.
Why can’t we be like China, which invests $400 billion/year in medical research? We should, by all accounts, have more wealth to invest than China does.
A hypercompetitive research environment begets a lot of “mansions of straw” instead of “houses of bricks,” as stated eloquently in a recent Nature perspective by W. Kaelin. It does not benefit the research enterprise or the taxpayers that are paying for the research. I agree with many of the other posters – I am not convinced that these numbers sufficiently support the hypothesis that there is a decrease in the hyper-competitive research environment.
I will also add a point about physician-scientists. While we train too many PhDs and post-docs, we have acknowledged for years that there is a scarcity of physician-scientists. The pipeline is “leaky,” much to the detriment of taxpayers that have invested a lot of money in the training of physician-scientists. The hyper-competitive research environment contributes to this problem. Additionally, the practice of medicine has become more complex and the time needed to care for patients has expanded to include electronic messaging, further eroding the amount of time a physician-scientist can spend doing what they were specifically trained to do – research.
I don’t understand why NIH has not protected their investment in physician-scientists by creating different funding sources for physician-scientists or altered paylines, the way they do for early stage investigators. Is there a reason for this?
Well, “culling of weaker research programs” suggests that the manner of choosing has some validity to it; “elite” can be “chosen” based on networks and connections (not to mention sex and ethnicity) rather than merit. I like your choice of “elite” rather than “stronger” vs. “weaker,” as there are probably other bases than quality of research contributing to the final decisions, as suggested previously and this week in PNAS:” Low agreement among reviewers evaluating the same NIH grant applications
This is Trumpian. Who is making up these numbers? 40% success rate for R01s? I would like for Open Mike to post the raw data–If these are the true numbers, why was my R01 on the bubble with a 11 percentile score?
The data for this blog post are publicly available at NIH RePORT – https://RePORT.nih.gov/FileLink.aspx?rid=955n
We also wanted to take the opportunity to remind our readers about the difference between the 5-year funding rate and success rate. The 5-year funding rate is the number of unique people who applied for and received funding as a principal investigator on at least one research project grant over a five-year period. The success rate, however, is the number of unique applications submitted and awarded during a single fiscal year.
The FY 2017 By The Numbers blog, posted the same day, provides data on the NIH success rate: https://nexus.od.nih.gov/all/2018/03/07/fy-2017-by-the-numbers/. The data for this post are also publicly available at NIH RePORT: https://RePORT.nih.gov/FileLink.aspx?rid=954.
It is also important to note that success rate varies between NIH-funding Institute or Center. For those interested, you can review success rate data on NIH RePORT throughout the years within each NIH funding Institute or Center: https://report.nih.gov/success_rates/Success_ByIC.cfm.
I think many people (myself included) are very frustrated with the definition that NIH uses for “success rate” since it counts an A0 and A1 as one application, but only if considered in the same fiscal year. This means that the true chances for an application to be funded are opaque and are inflated compared to what we know is the case as applicants. Keep in mind that from the applicant’s perspective, the A1 is still alot of work, and needing to do one delays funding for nearly a year. Why can’t NIH just be transparent and calculate success rate by the number of applications filed, regardless whether they are an A0 or A1.
I agree. Is there anyway to see the true data. How many grants are submitted and how many are funded counting every R01 as 1 grant? How many new investigators are being funded? In any case, it is disheartening to young and old scientist who love science. I encourage my students to go into healthcare or engineering.
And all of these success rate discussions ignore the other gorilla in the room – the amount of work we need to propose to do in an R01 to actually get the R01 can’t possibly be done with a $250K per year budget.
Therefore, even if we successfully obtain an R01, we simply are setting ourselves up for failure for the renewal.