
3 Comments
As we continue to explore the question of how many researchers NIH funds, we have been observing a positive trend over the last few years where the number of unique scientists seeking support on NIH research project grants (RPGs) is stabilizing along with a commensurate rise in the corresponding NIH cumulative investigator rate (see these posts from 2019, 2018, and 2016). Now with fiscal year (FY) 2019 data available on the NIH Data Book, let’s see if this trend continued.
NIH’s cumulative investigator rate, as a reminder, is a person-based metric that looks at the likelihood that unique investigators are funded over a five-year window. To determine this, we take the number of unique principal investigators who were designated on an NIH RPG, activity or mechanism (simply referred to as “awardees” here) divided by the number of unique principal investigators who were designated on applications (simply referred to as “applicants” here) over a five-year period. This timeframe was chosen because most research grants last for more than one year and most applicants submit applications over a period of time measured in years, not just 12 months, that may overlap with their periods of funding, if they are funded.
As this is an NIH-wide metric, if an investigator is designated on separate awards from multiple NIH Institutes or Centers in a particular five-year timeframe, they will still only be counted a single time across the entire period at the NIH level. Please also keep in mind that this metric is distinct from the success rate computed annually for applications (i.e. not people) submitted to NIH.
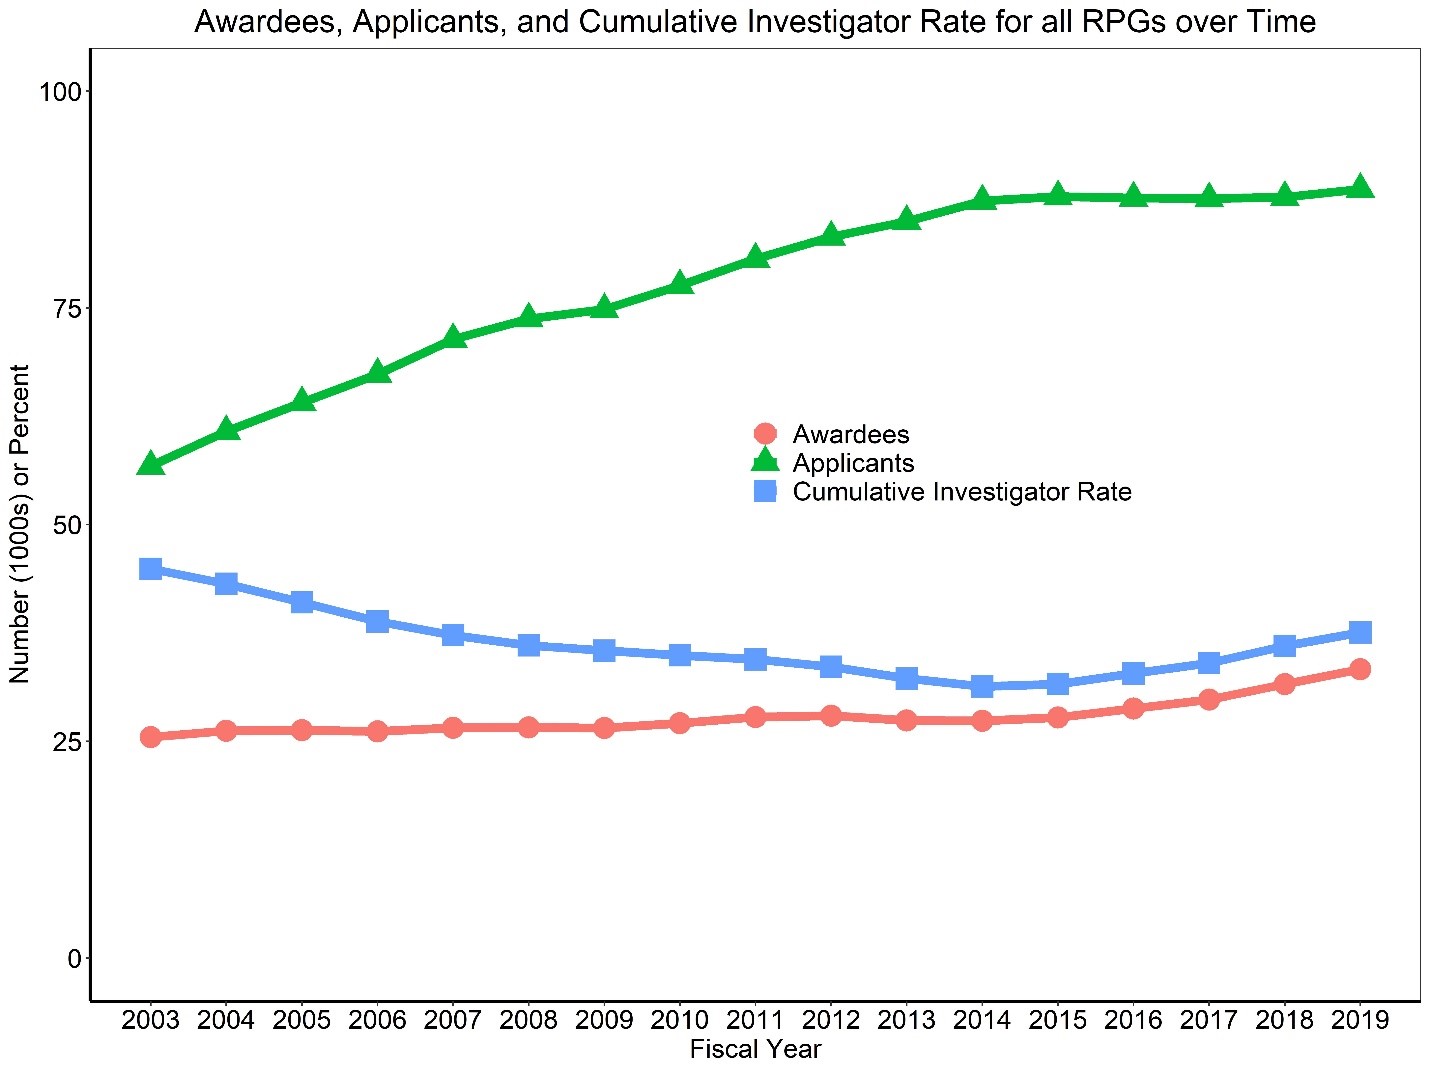
Starting with overall counts for RPGs in Figure 1 (click graph to enlarge), the number of unique applicants to NIH in FY 2019 was 88,695 (green triangle line). This amount has appeared to generally hold steady since FY 2015, where there were 87,838 applicants. Prior to that time, NIH experienced a gradual rise in applicants from 56,758 in FY 2003, which was the final year of the “NIH Doubling.” The number of awardees continued its increase into FY 2019, landing at 33,312 (red circle line). Taking these figures together, the FY 2019 cumulative investigator rate for RPGs ticked upward to 37.6 percent from the previous year (blue square line).
Like earlier posts discussing our cumulative investigator rate, next we will focus on R01-equivalent (see definition), P01, and R21 grant types. For simplicity, we will only talk about the FY 2019 data below, but encourage you to take a look at the earlier posts for more description of the data from previous years.
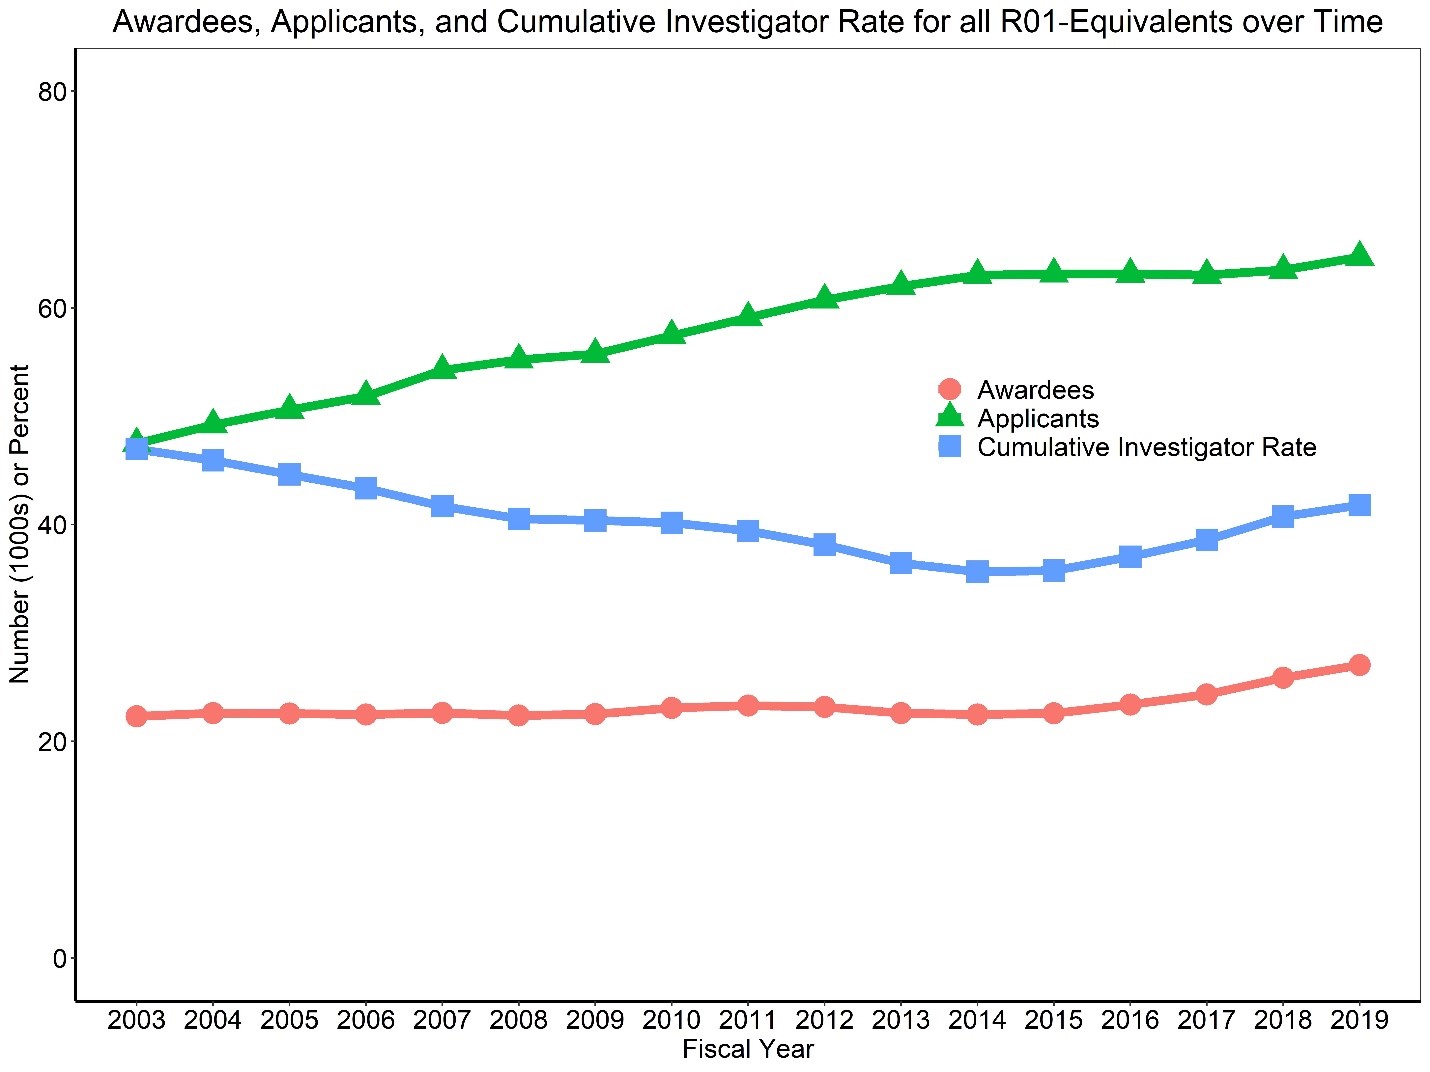
Figure 2 (click to enlarge) shows that, in FY 2019, the number of applicants and awardees for R01-equivalent grants was 64,693 and 27,040, respectively. The cumulative investigator rate for R01-equivalent grants rose again from previous FYs to 41.8 percent.
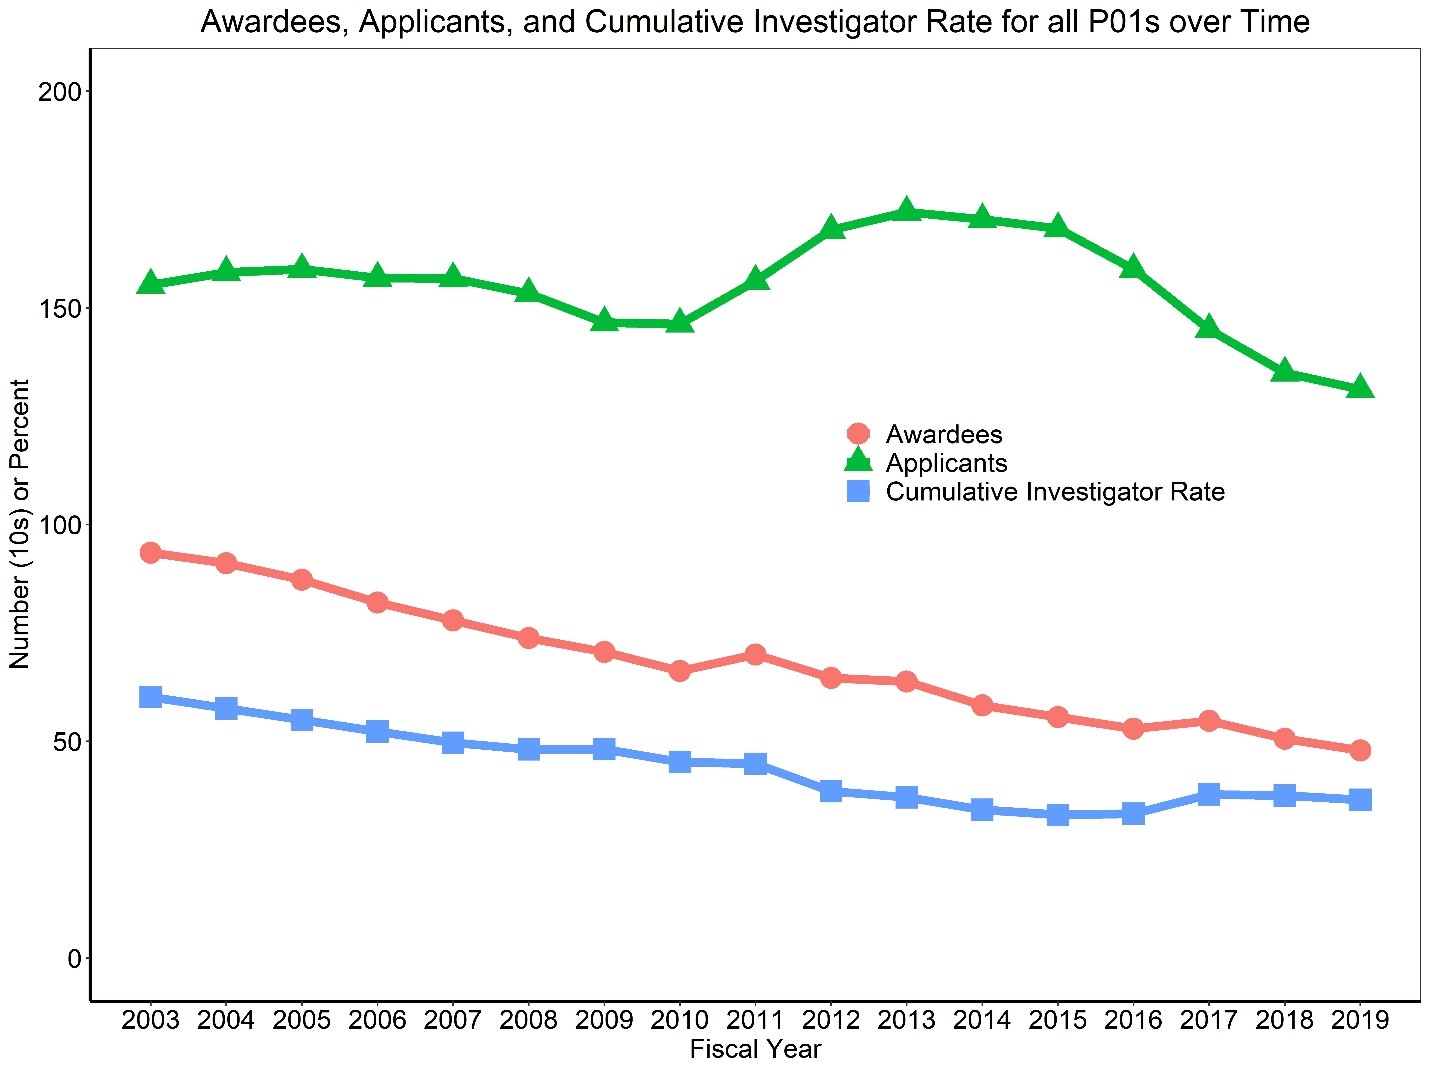
P01 program grants show similar trends in FY 2019 as observed in recent years (Figure 3, click to enlarge). The number of applicants again declined to 1,312, with 479 awards. This equates to a 36.5 percent cumulative investigator rate in FY 2019. Though this is lower than what was seen in FY 2018, it still higher than its FY 2016 nadir.
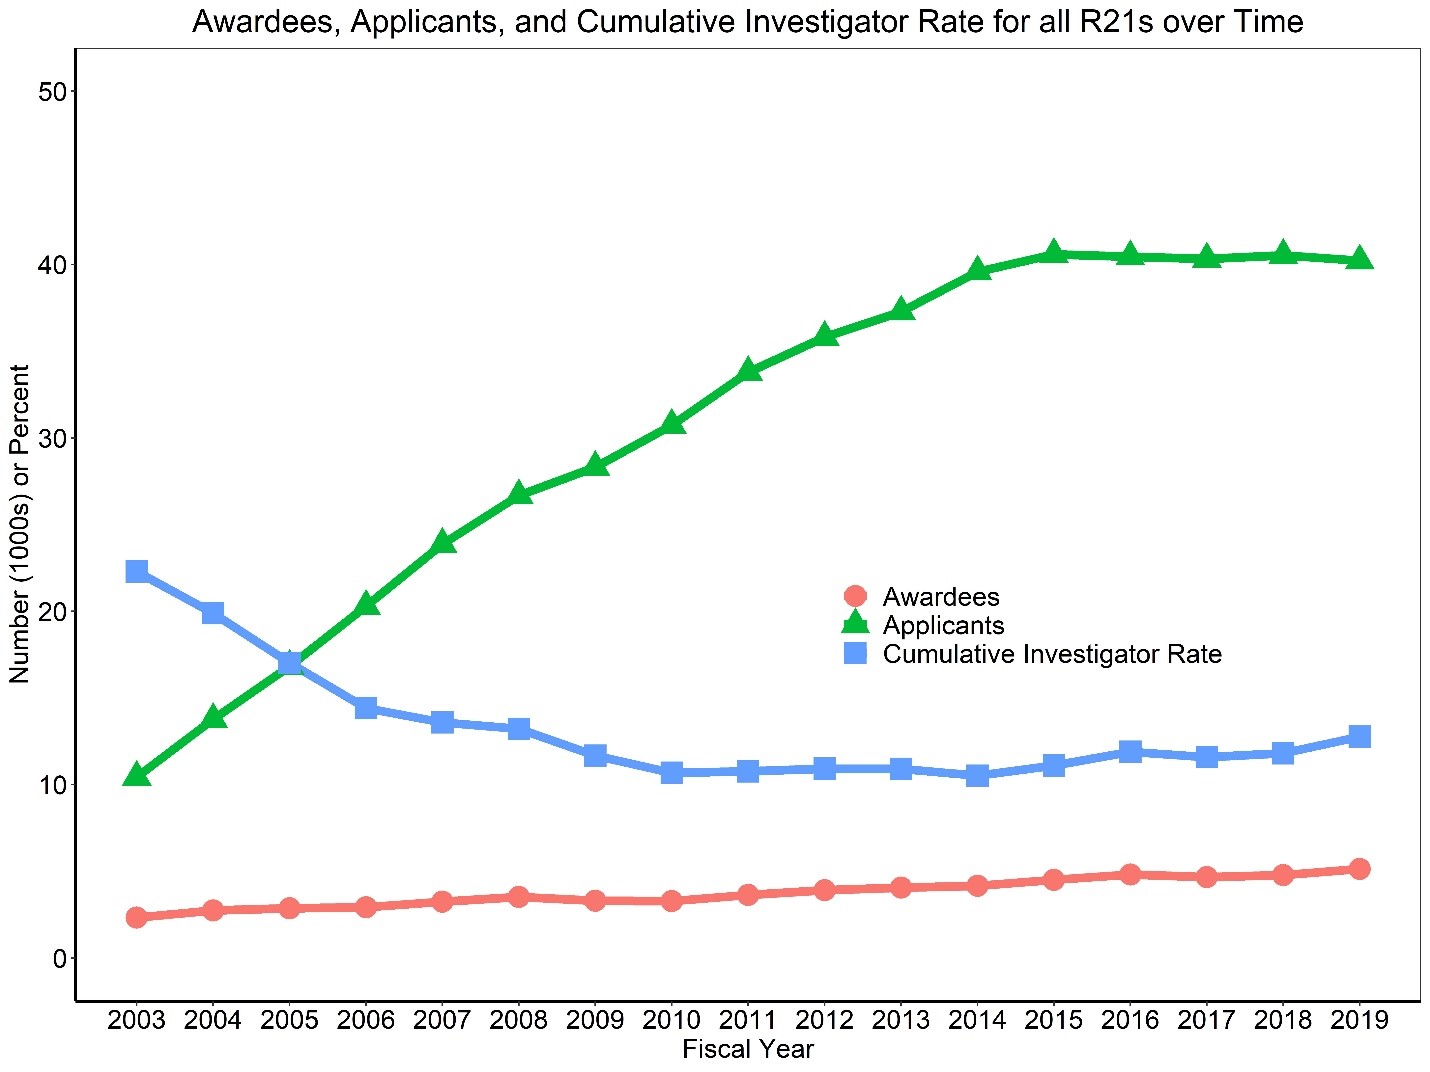
NIH saw 40,217 applicants seeking support from our conceptual, exploratory R21 research grants in FY 2019 (Figure 4, click to enlarge). With 5,134 awardees, the resulting cumulative investigator rate for R21s moved up to 12.8 percent in FY 2019. Though not at the 22.3 percent level seen in FY 2003, it is still a move in the positive direction from FY 2014.
While these trends are promising, we recognize that scientists continue to contend with challenges brought on by hyper-competition. We will continue to follow the NIH cumulative investigator rate going forward.
I would like to thank my colleagues in the Office of Extramural Research Division of Statistical Analysis and Reporting for their work on these analyses.
What about the new investigators? Do they have an upward trend as well?
Are there data on the number of people supported by NIH funds that are not PIs? In know of several people who are key personnel on R01s of multiple investigators. I appreciate that these data are harder to track, however.
Spoken too soon. With the economy tanking, that trend is sure to reverse. But I have faith in the NIH to continue to cook the numbers to put itself in a good light. They get their directives in managing PR straight from Azar and POTUS.