
1 Comments
We are pleased to share our annual snapshot of how many researchers NIH supports. These fiscal year (FY) 2023 data are also available in the NIH Data Book (see report #303) and represent awards made with traditional and supplemental coronavirus appropriations. Please keep in mind that these data are distinct from success rates, however, which are application-based metrics (see this recent post).
Our cumulative investigator rate is an NIH-wide person-based metric. The metric is calculated as the number of unique principal investigators who were designated on an NIH research project grant (RPG) award, divided by the number of unique principal investigators who were designated on applications over a five-year period. For simplicity, we will refer to those investigators as either “awardees” or “applicants” in this post, even though NIH receives applications from and issues awards to institutions, not individual scientists. We focus on a five-year timeframe because most research grants last for more than one year, and applicants submit applications with the goal to secure multiple years of funding. We also only count someone once if they are designated on separate applications from the same or multiple NIH Institutes or Centers in a particular five-year timeframe.
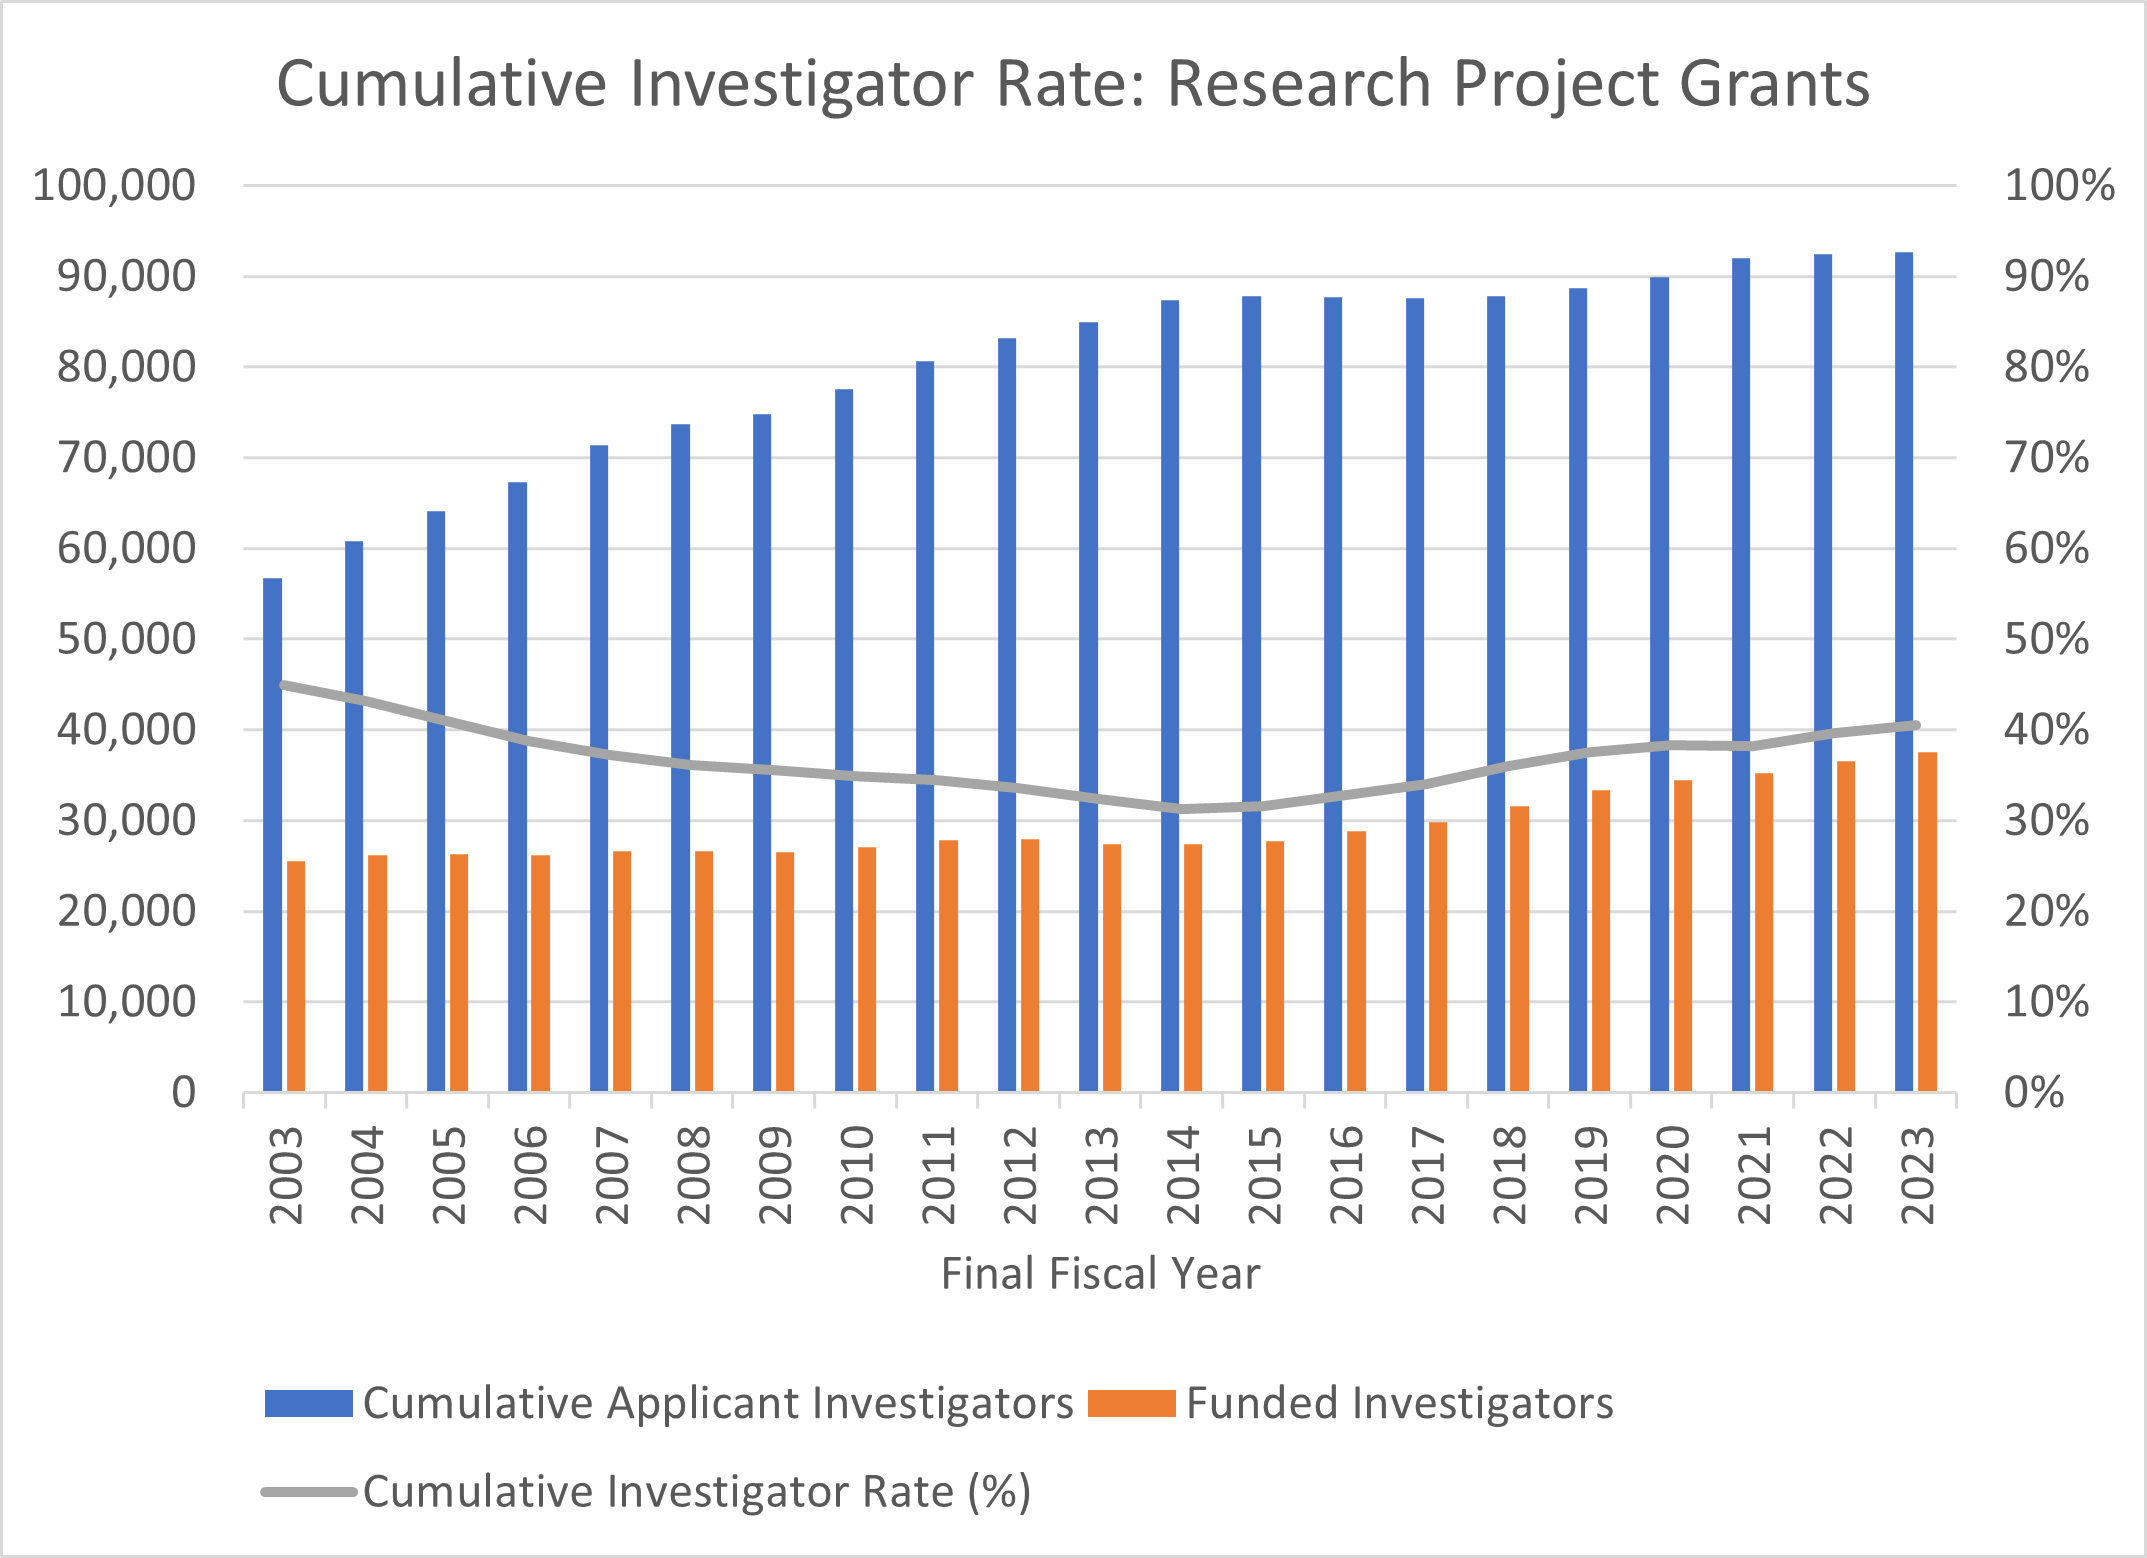
Figure 1 shows cumulative investigator rate data for RPGs between FYs 2003 and 2023. Applicants are in blue bars, awardees in orange bars, and the cumulative investigator rate itself is the gray line. NIH supported 37,543 awardees in FY 2023, out of 92,691 applicants. This is an increase of 2.6% and 0.2%, respectively, over FY 2022, and the cumulative investigator rate was 40.5%.
Figure 1. Cumulative Investigator Rate: Research Project Grants: FY 2003 to 2023
The table below highlights FY 2023 data for R01-equivalent, R21, and P01 grant types. As noted earlier, please see report #303 in the Data Book for more details.
| Grant Type | Applicants | Awardees | Cumulative Investigator Rate |
| R01-equivalent | 70,440 | 31,043 | 44.1% |
| R21 | 38,115 | 4,768 | 12.5% |
| P01 | 1,186 | 417 | 35.2% |
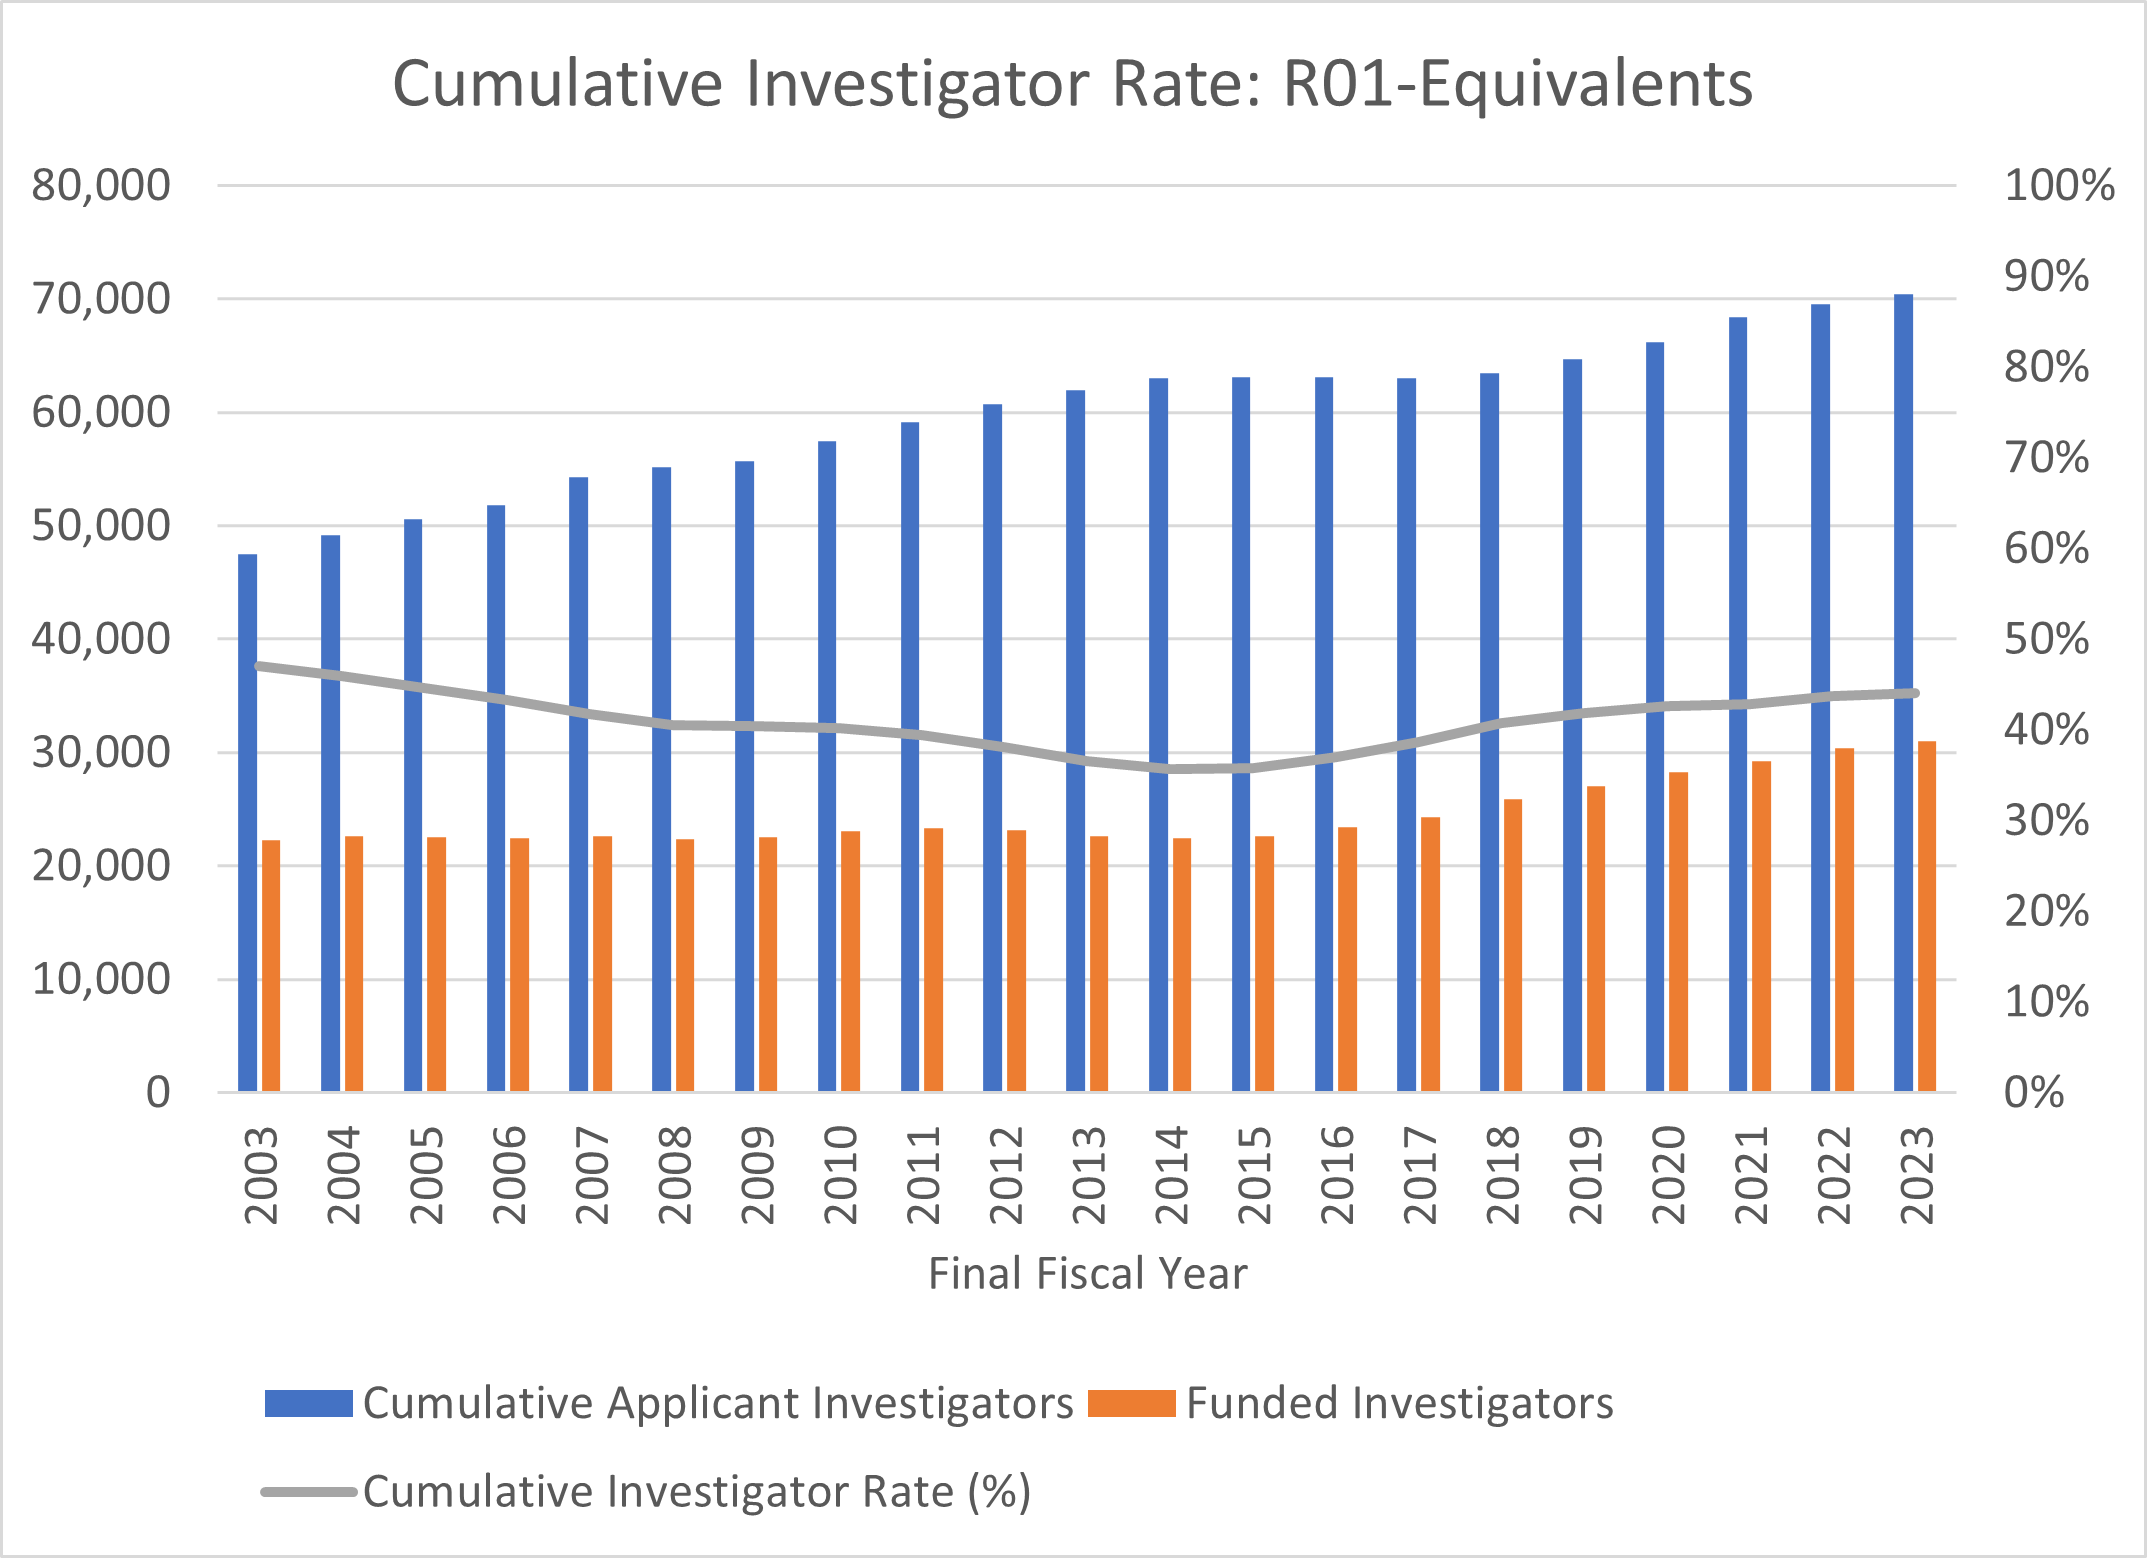
The cumulative investigator rate for R01-equivalent grants rose to 44.1% in FY 2023, a 0.4 percentage point increase over the previous year (Figure 2). There were 31,043 awardees out of 70,440 applicants, which is 2.1% more awardees and 1.3% more applicants than in FY 2022.
Figure 2. Cumulative Investigator Rate: R01-equivalent Grants FY 2003 to 2023
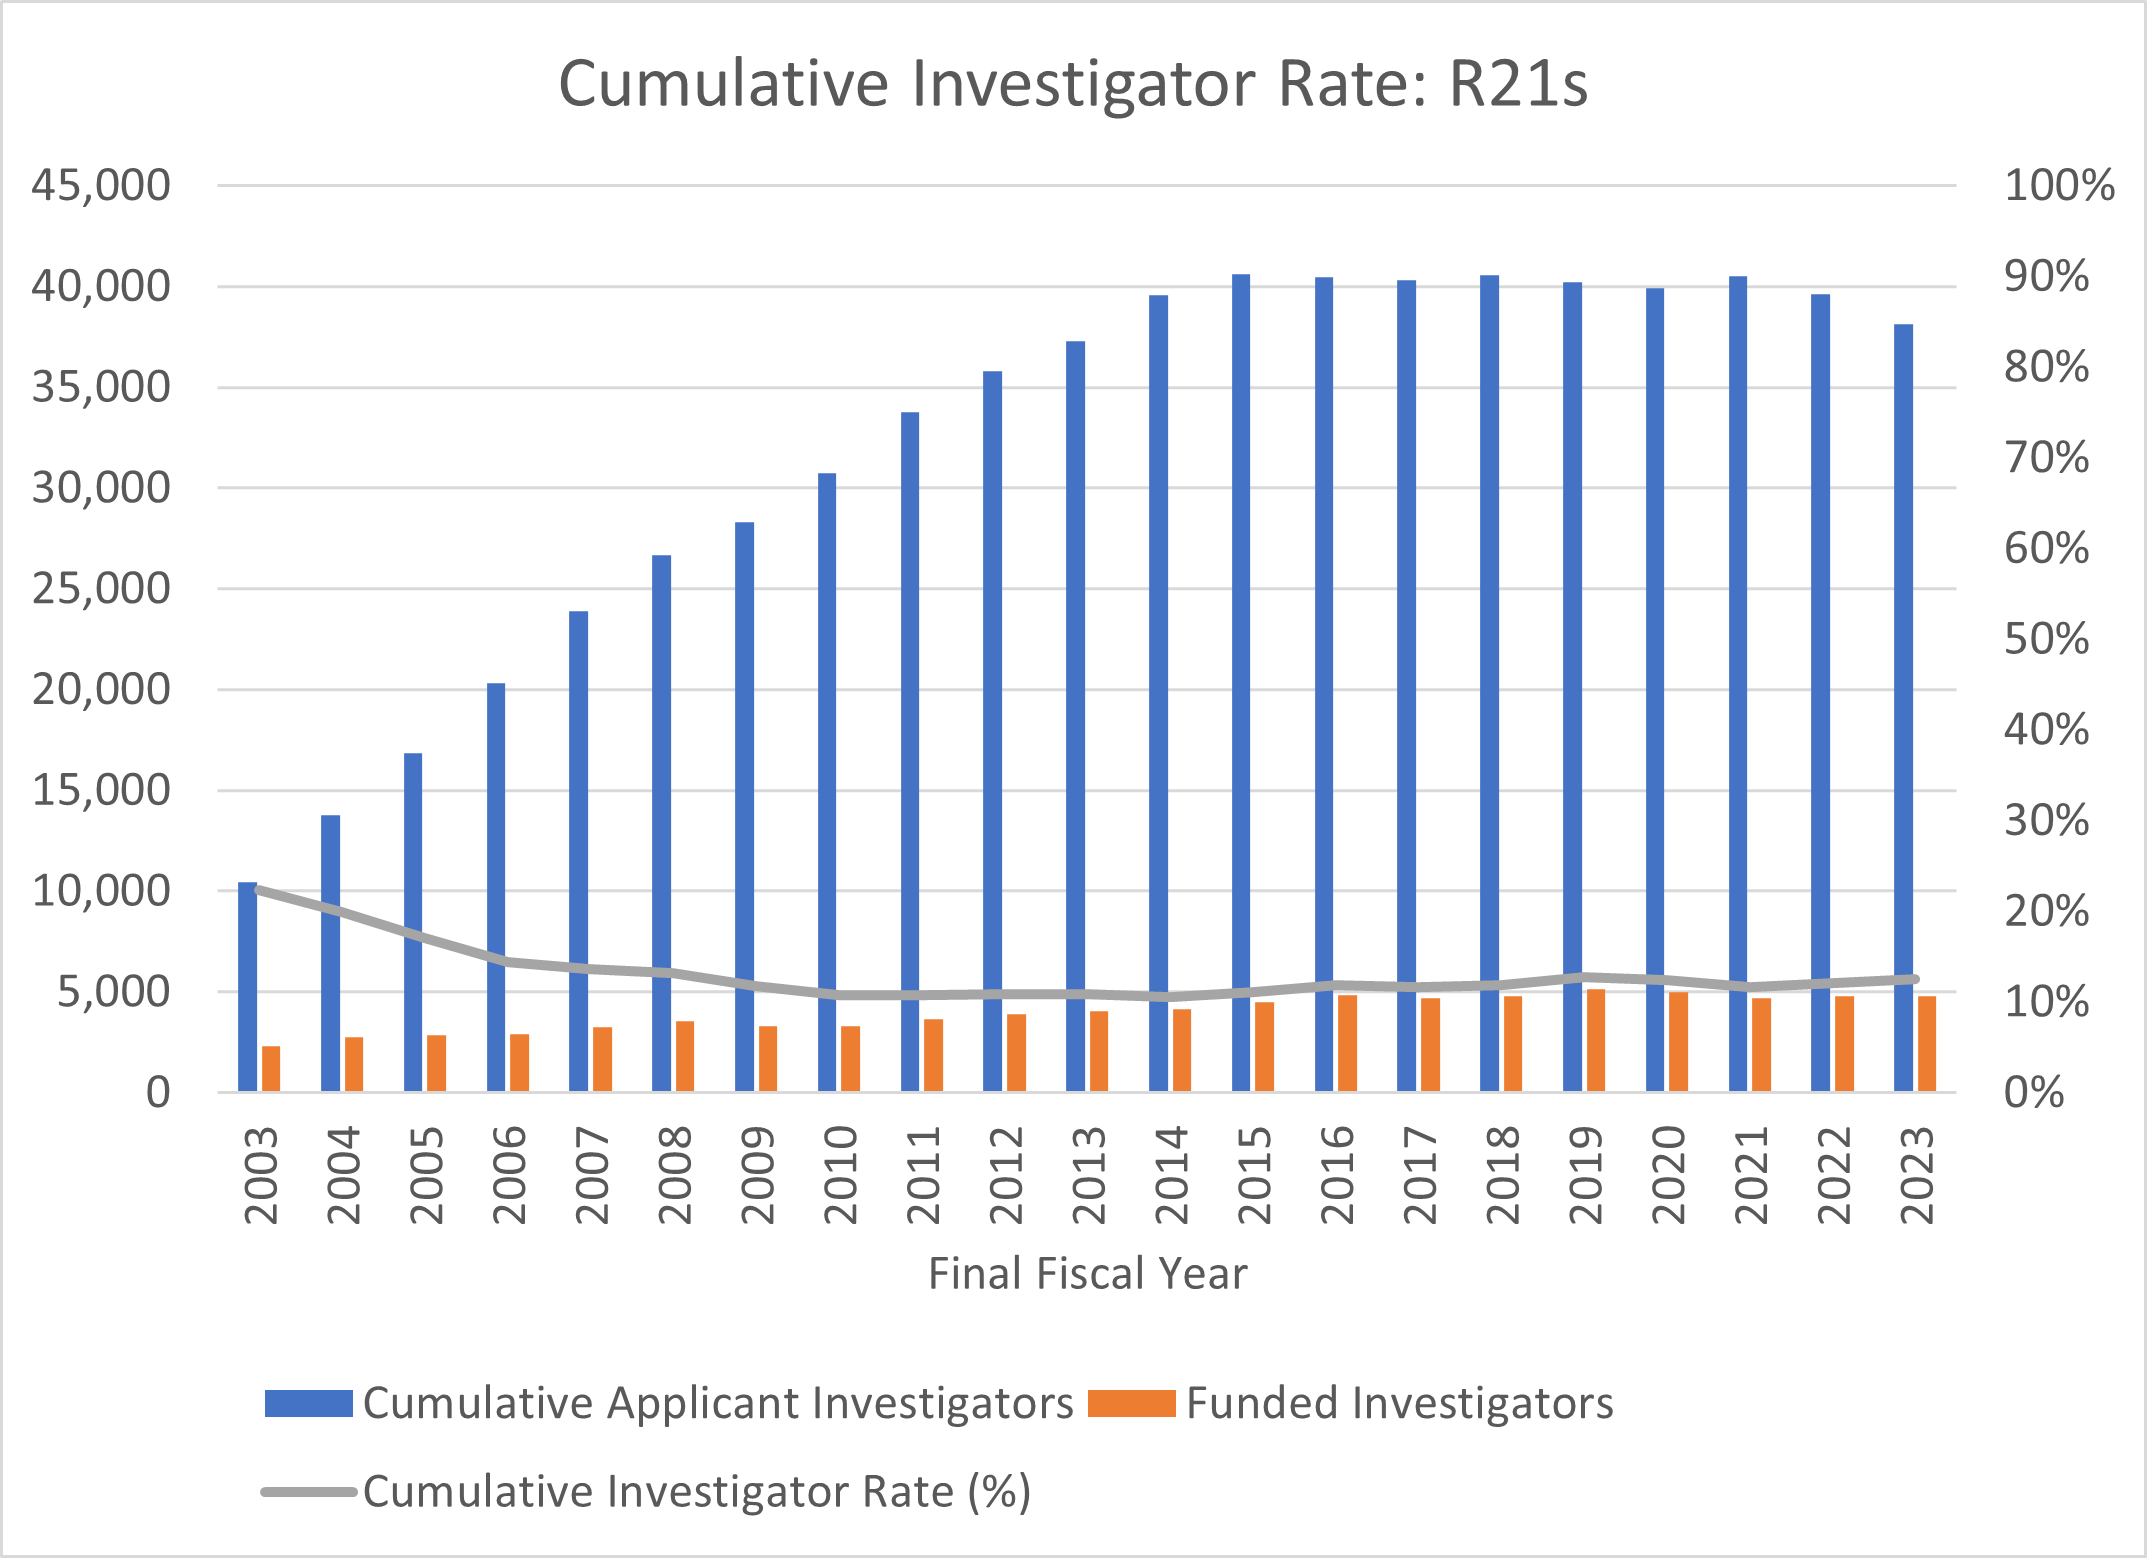
The R21 cumulative investigator rate went up by 0.4 percentage point in FY 2023 compared to the past FY (Figure 3). Out of 38,115 applicants, there were 4,768 awardees, for a 12.5% Cumulative Investigator Rate. Though the rate did inch up compared to FY 2022, it has been markedly low for over a decade. Thus, reiterating some informal advice from prior years, we still encourage applicants to consider other NIH grant types (such as R01-equivalents), especially since R21s are shorter and smaller grants and do not necessarily increase success for a future larger award.
Figure 3. Cumulative Investigator Rate: R21 Grants FY 2003 to 2023
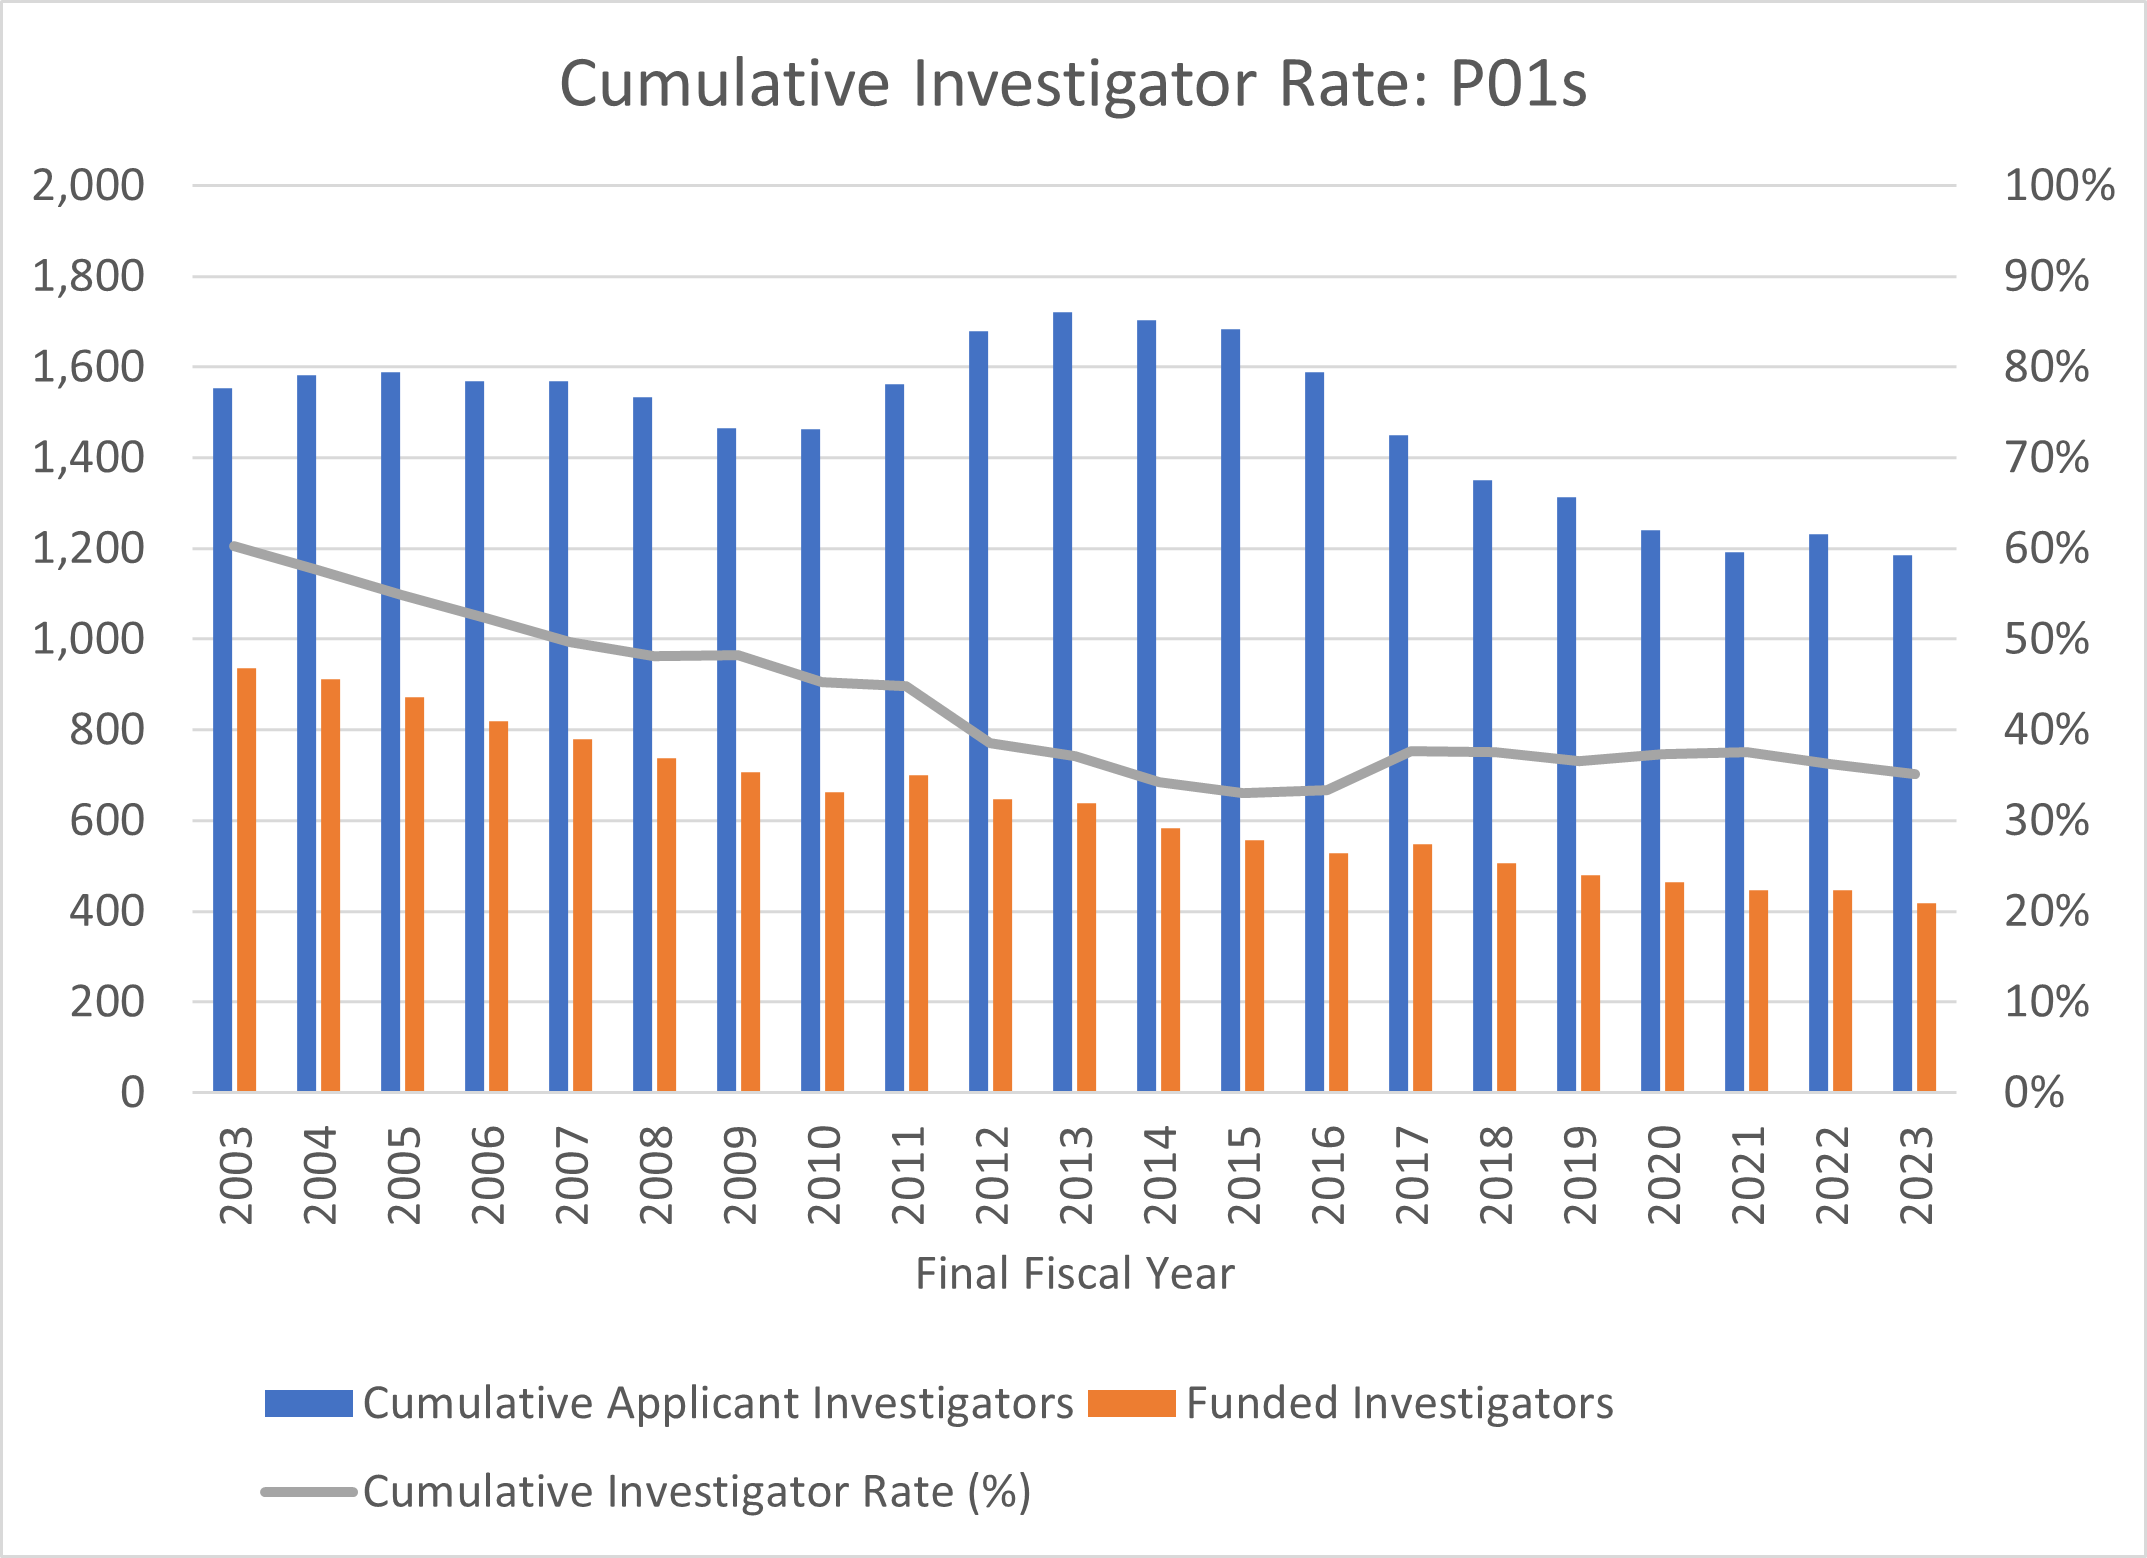
There were fewer P01 program applicants in FY 2023 compared to 2022, and fewer awards were made (Figure 4). This resulted in the cumulative investigator rate decreasing by 1 percentage point, from 36.2% to 35.2%.
Figure 4. Cumulative Investigator Rate: P01 Grants FY 2003 to 2023
We are pleased that the cumulative investigator rate for RPGs and R01-equivalent grants continued to increase over recent years.
I would like to thank my colleagues in the Office of Extramural Research Division of Statistical Analysis and Reporting for their work on these analyses.
These data are interesting. It would be nice to have the data by regions or states or types of higher ed institutions for comparisons.