
6 Comments
An investigator’s long-term success depends not only on securing funding, but on maintaining a stable funding stream over time. One way to assure continued funding is to submit a competing renewal application. However, as we noted earlier this year, while new investigators were almost as successful as experienced investigators in obtaining new (type 1) R01s, the difference between new investigator and experienced investigator success rates widens when looking at competing renewals (type 2s), and success rates of new investigators’ first renewals were lower than those of experienced investigators. In addition, we know that since the end of NIH’s budget doubling in 2003, success rates for competing renewals of research project grants overall have decreased.
To further understand trends in success rate for R01 competing renewals (“type 2s”) I’d like to share some additional analyses where we look at characteristics of type 2 R01 applications, and the association of their scores for individual review criteria (“criterion scores”) with overall impact score and funding outcomes.
You might recall our previous blog where we described the association of criterion scores with overall impact score among a sample of over 123,000 competing R01 applications NIH received over 4 years. My colleagues published their findings ![]() , which demonstrated that the strongest correlates, by far, of overall impact score were approach and, to a lesser extent, significance criterion scores. Here we follow up on that analysis, this time focusing on outcomes for only the subset of R01 applications which were competing renewals.
, which demonstrated that the strongest correlates, by far, of overall impact score were approach and, to a lesser extent, significance criterion scores. Here we follow up on that analysis, this time focusing on outcomes for only the subset of R01 applications which were competing renewals.
![Table 1 [click to expand]](https://nexus.od.nih.gov/all/wp-content/uploads/2016/12/Capture2.jpg)
Figure 1 shows box plot distributions for criterion scores and overall impact scores. Consistent with what we saw for all applications, the approach criterion score most closely approximates overall impact scores.
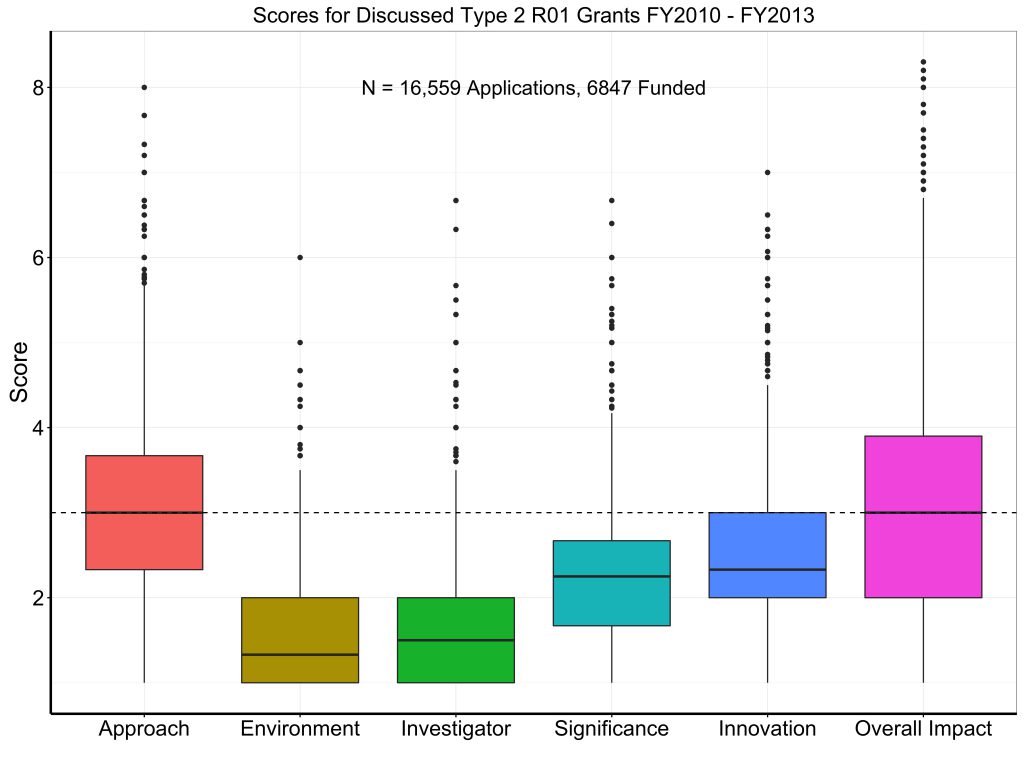
Figure 2 shows a heat map of Spearman correlation coefficients for the different criterion scores. Once again we see that approach scores were highly correlated with overall impact scores (r=0.83), while other criterion scores had weaker correlations.

Now let’s dive a little deeper into understanding potential predictive variables correlated to the success of a type 2 R01 application. We next performed a series of random-forest multivariable regressions to describe what factors are the most important correlates to four selected outcomes in the path from application to award: discussion in a study section; approach score; overall impact score; and finally, of course, funding. We have used this approach to assess factors associated with NIH funding and research outcomes.
We first looked at correlates of discussion in a peer review study section. Figure 3 shows variable importance in a 100-tree forest; the model explained 50% of the variance. The strongest correlates by far were approach score and significance score. Personal and organizational characteristics were not materially correlated with discussion.
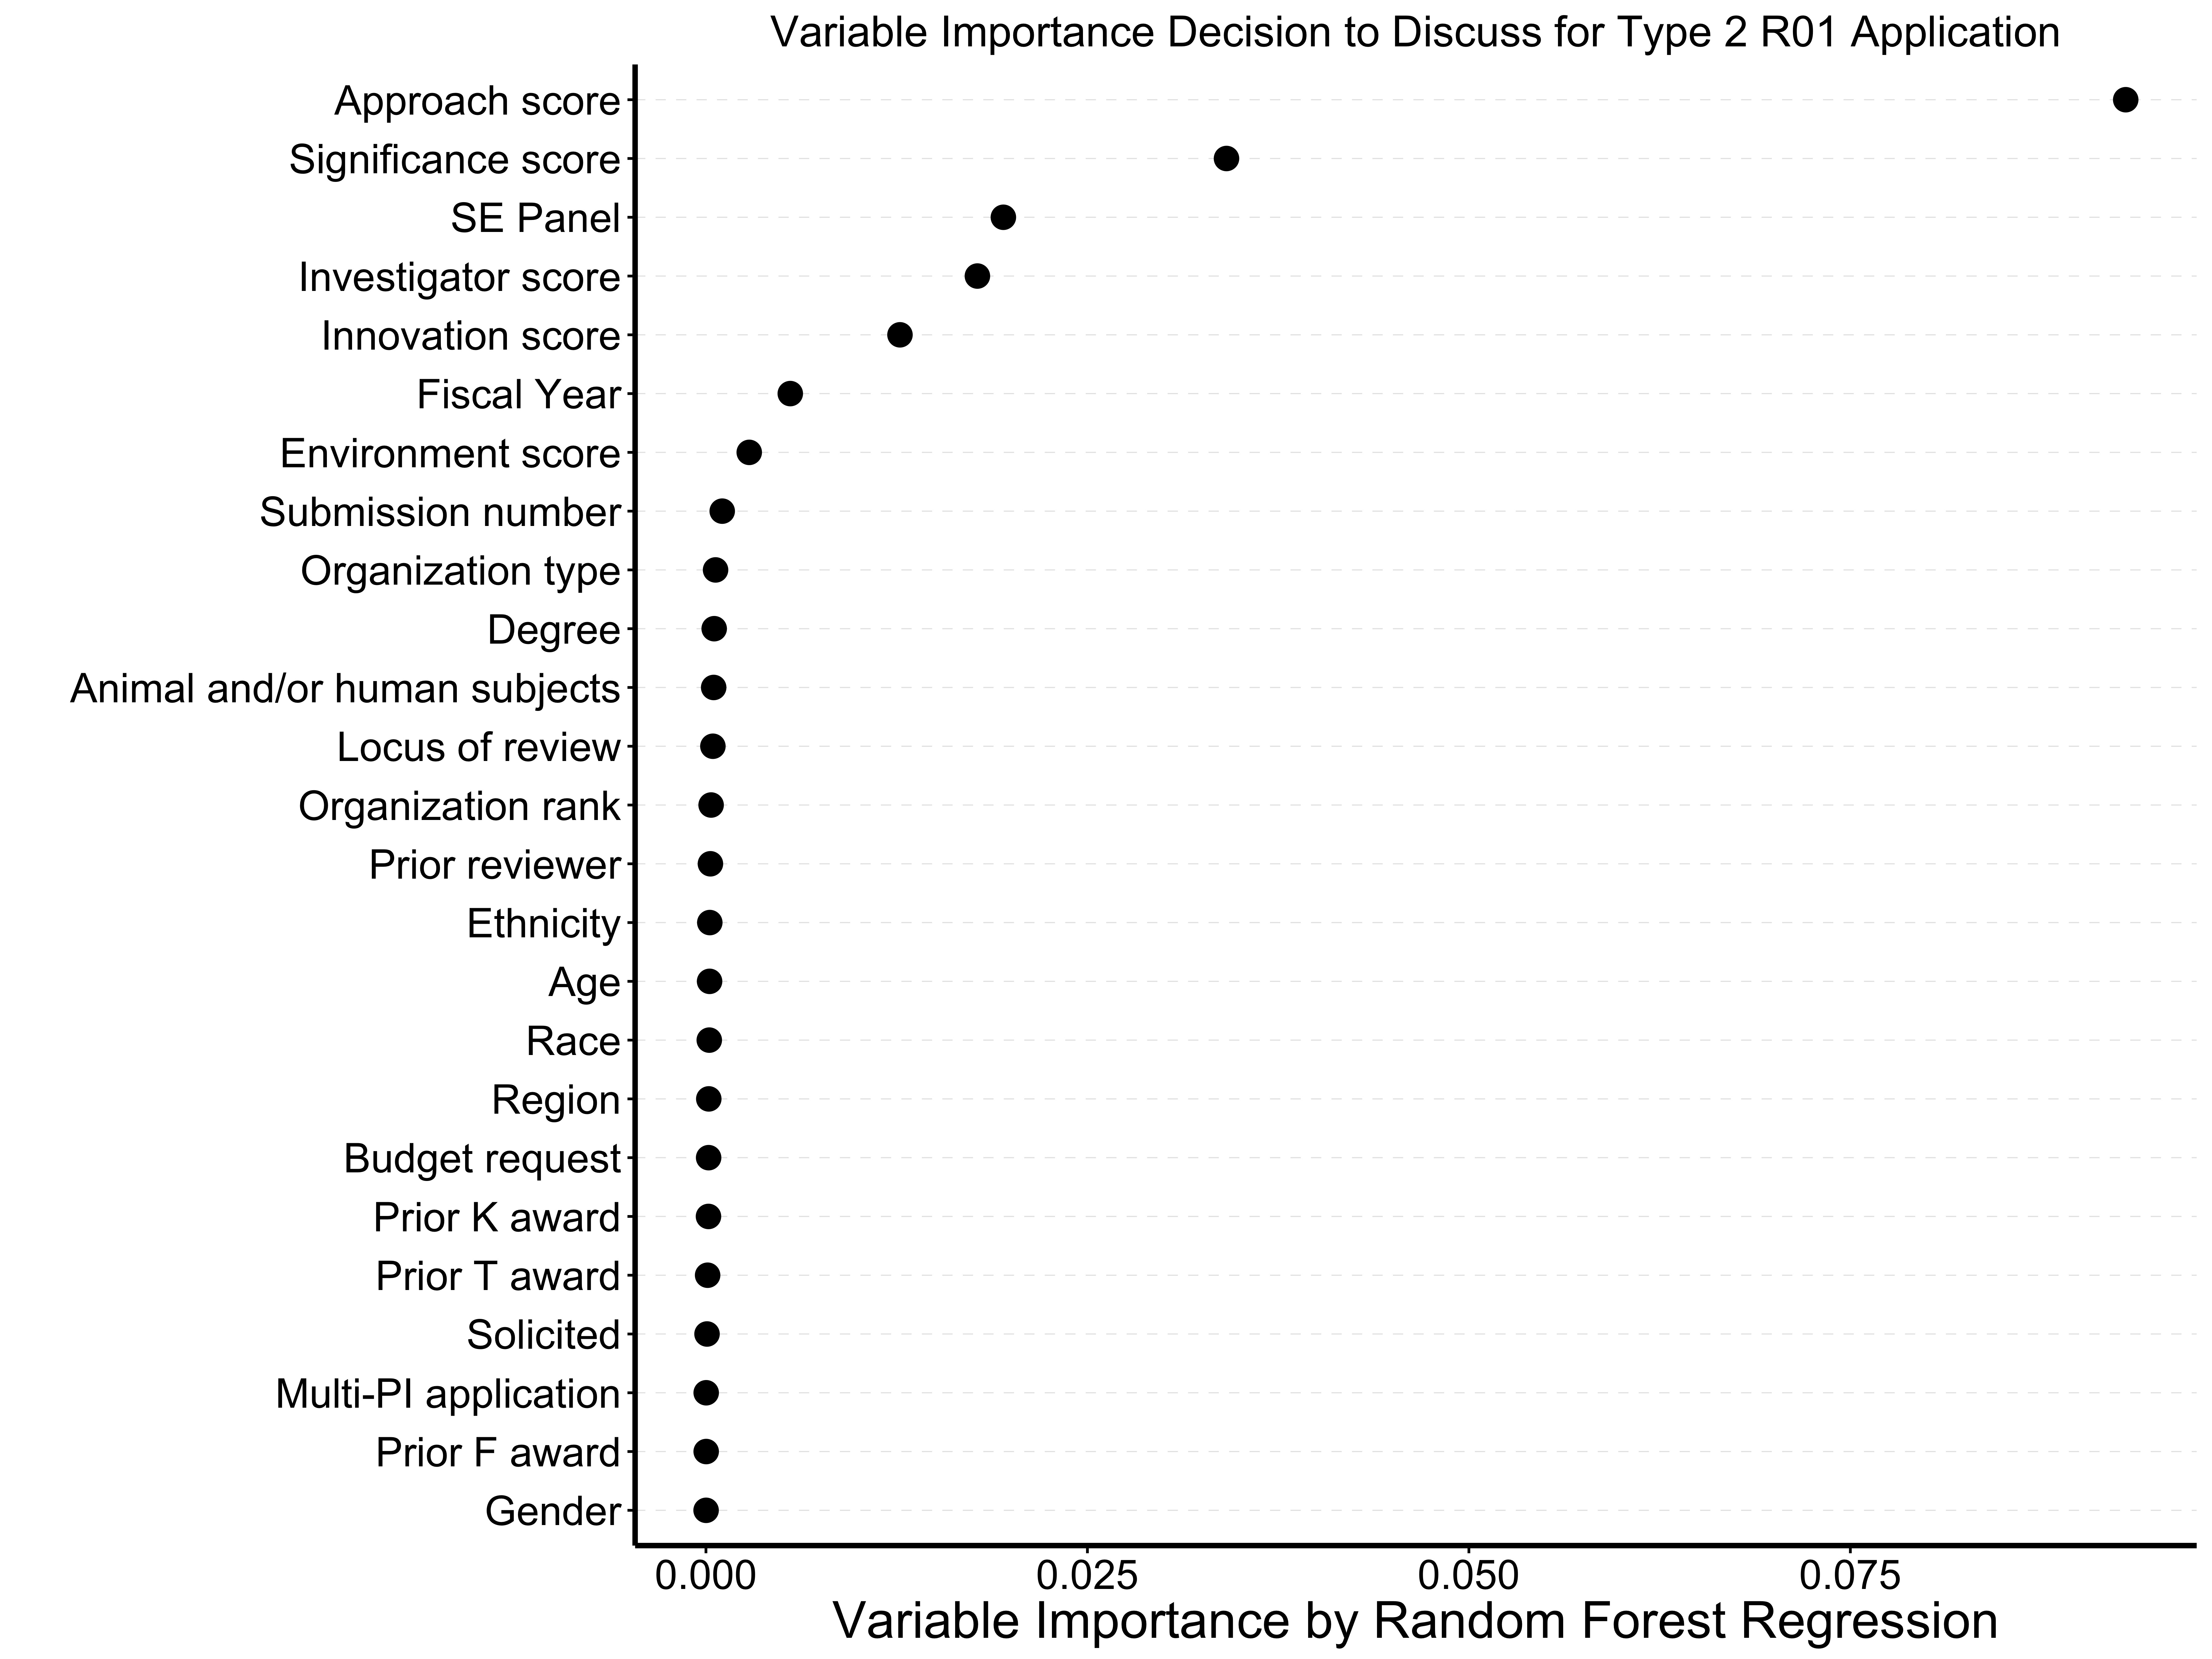
Figure 4 shows the random-forest correlates of approach score; the model explained 63% of the variance. The strongest correlates were significance score, innovation score, and investigator score. When we removed the other criterion scores, the model (which was left with personal and organizational characteristics) only explained ~ 3% of the variance.
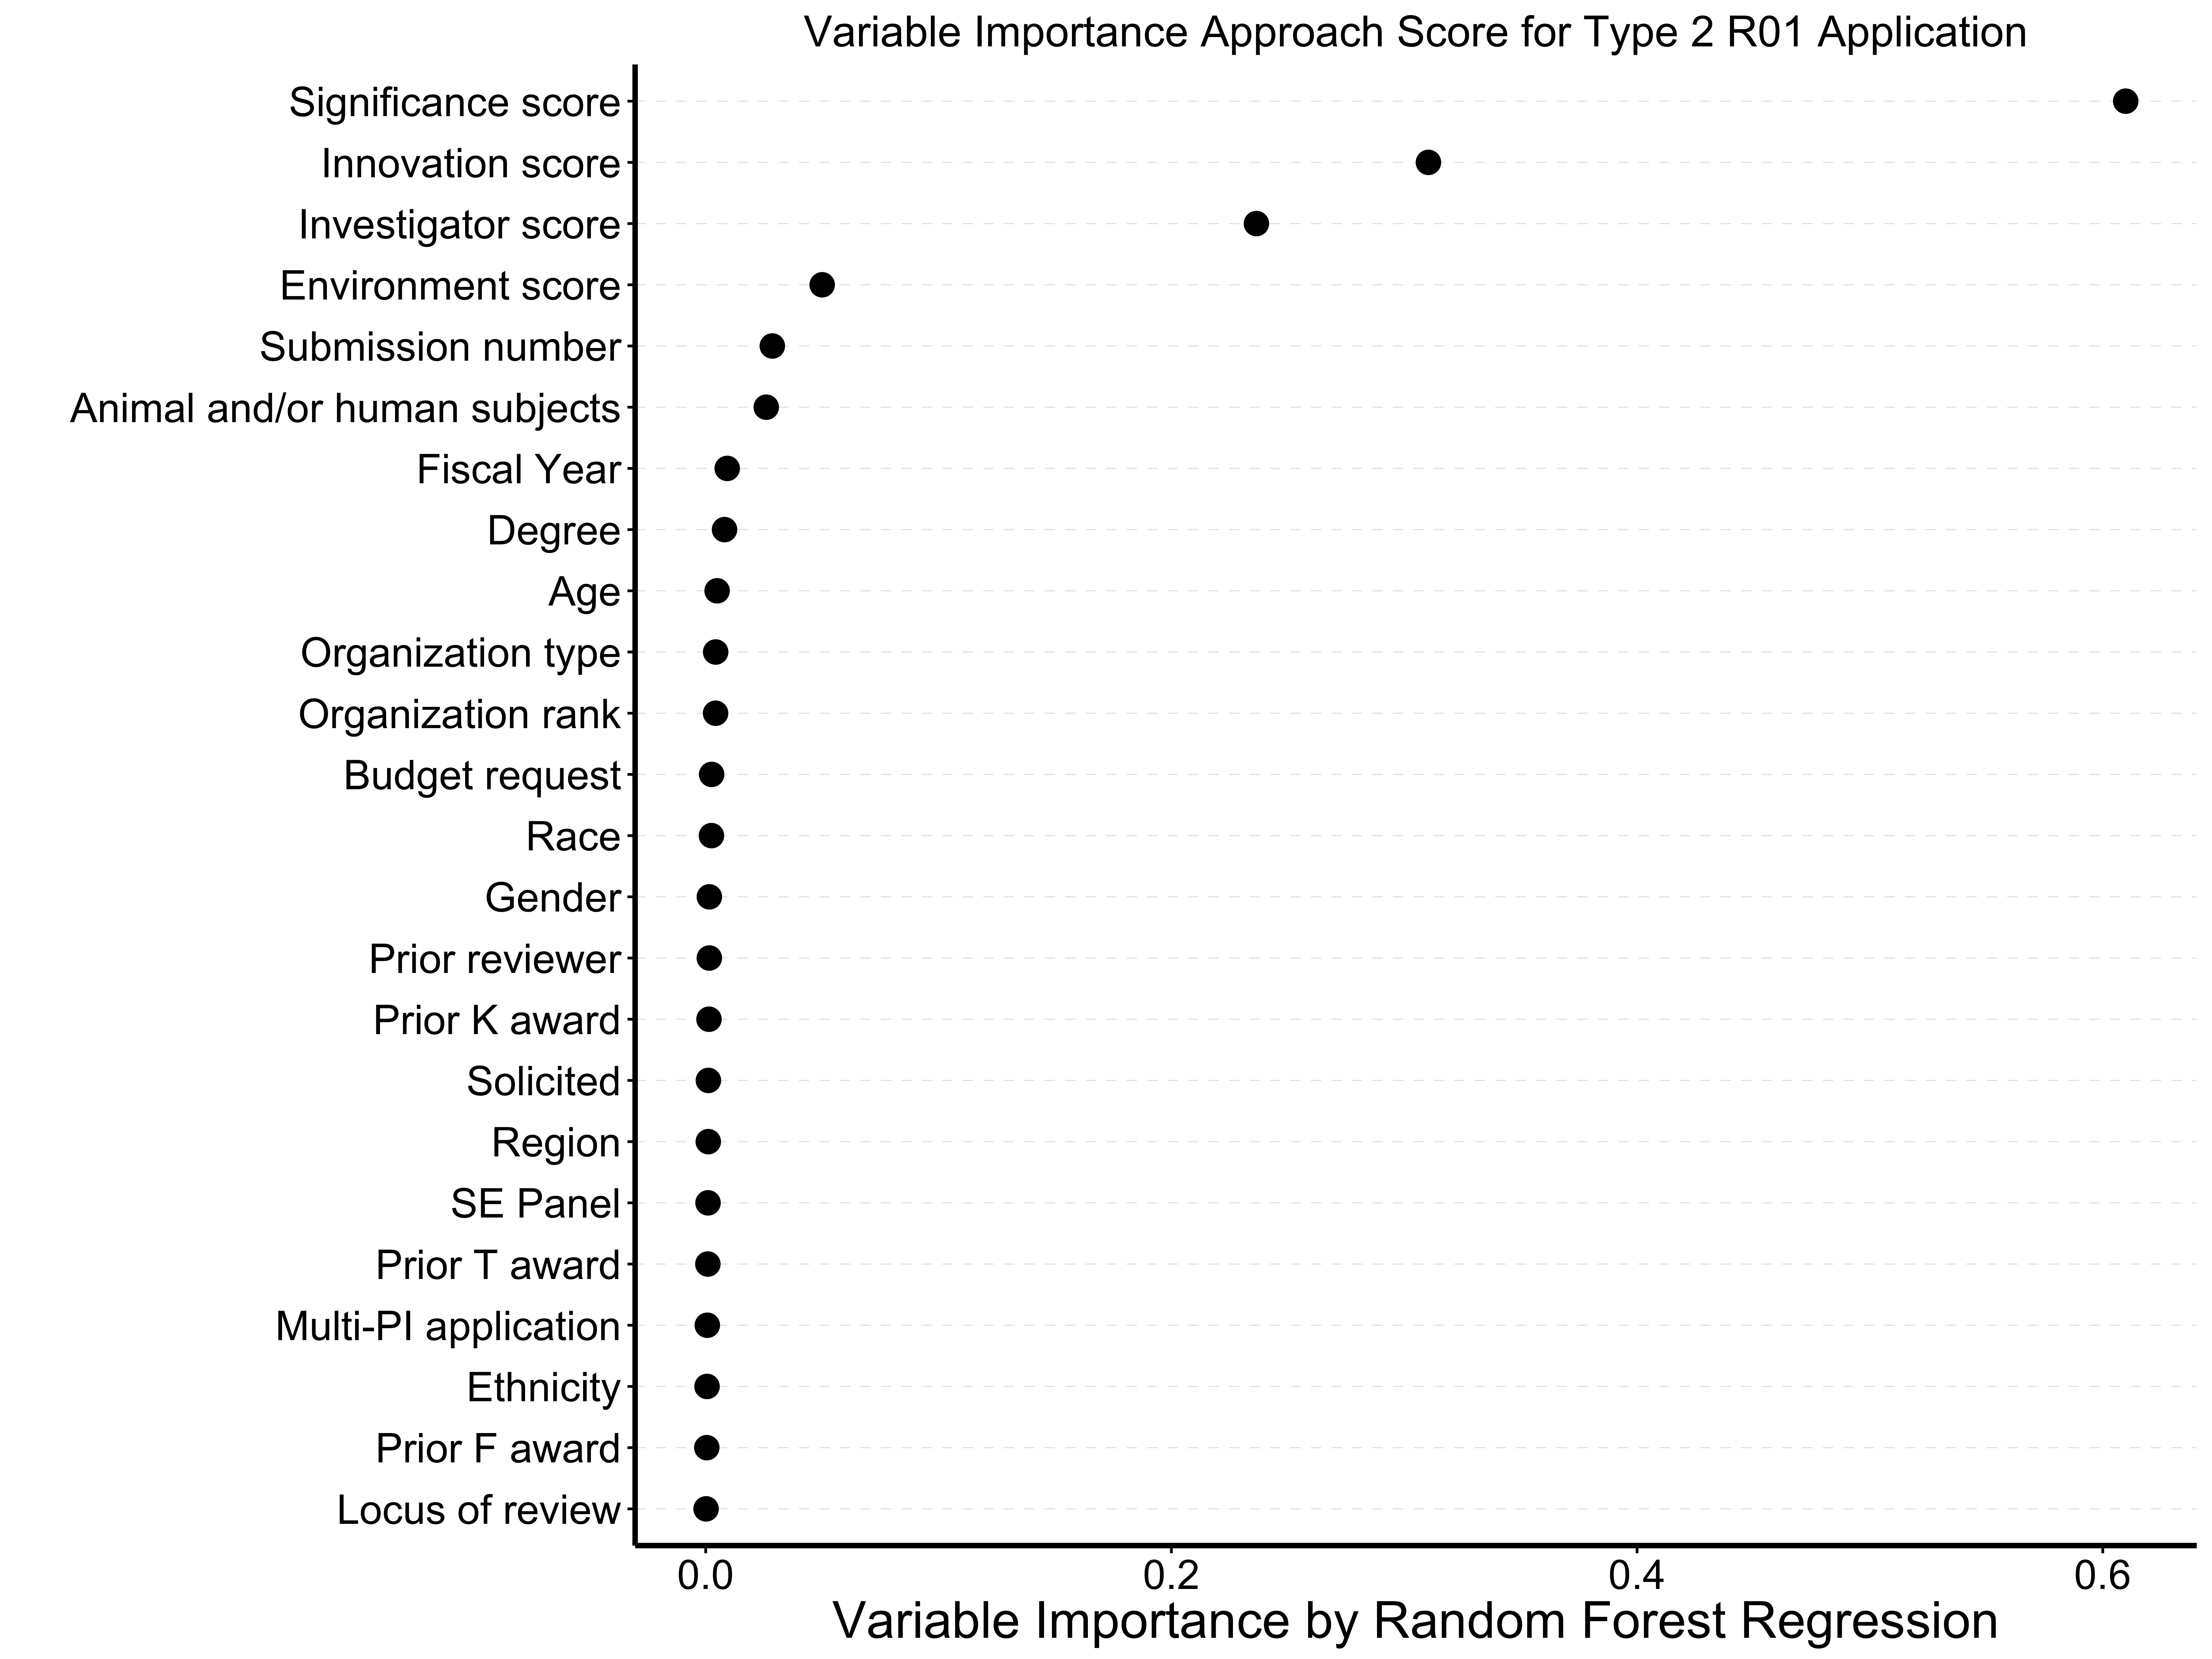
Figure 5 shows the random-forest correlates of overall impact score among discussed applications; the model explained 73% of the variance. The strongest correlate, by far, was approach score.

Figure 6 shows random-forest correlates of funding among discussed applications; the model explained 61% of the variance. As might be expected, overall impact score was the strongest correlate.
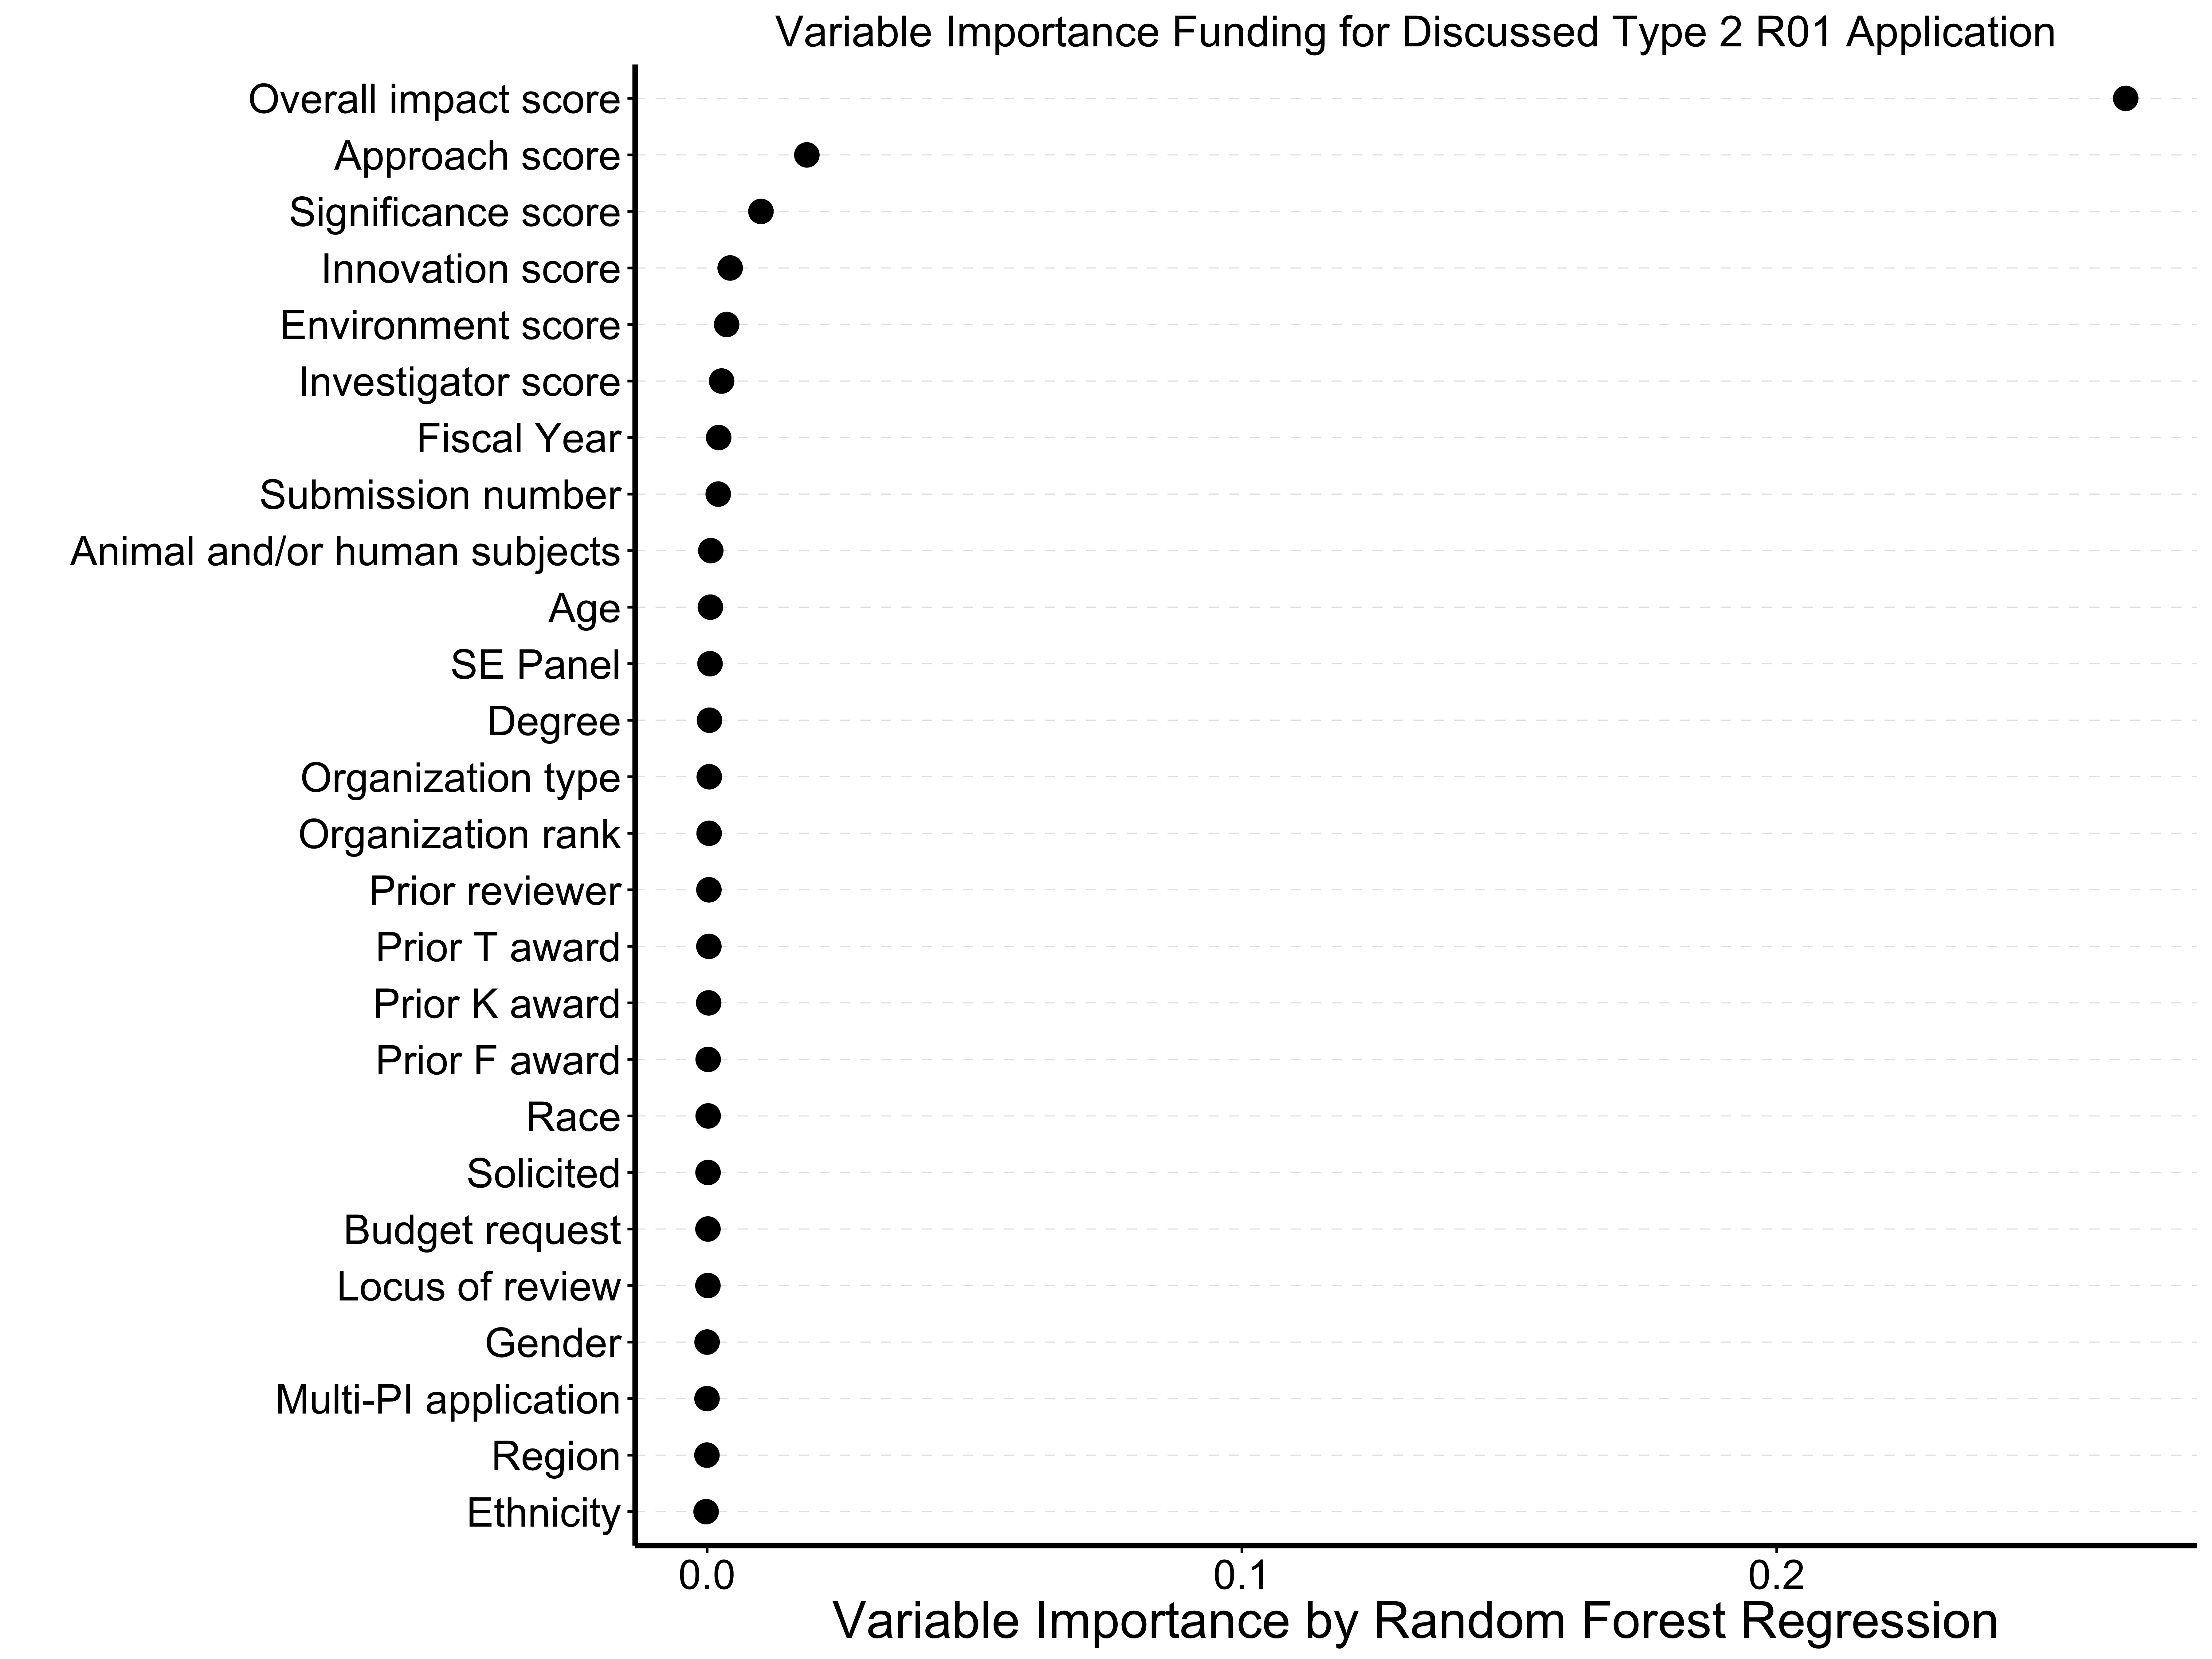
Figure 7 shows the results of the random-forest multivariable regression, which explained 41% of the variance. When we left out overall impact score, we found that approach score and to a lesser extent significance scores were the strongest correlates of funding.
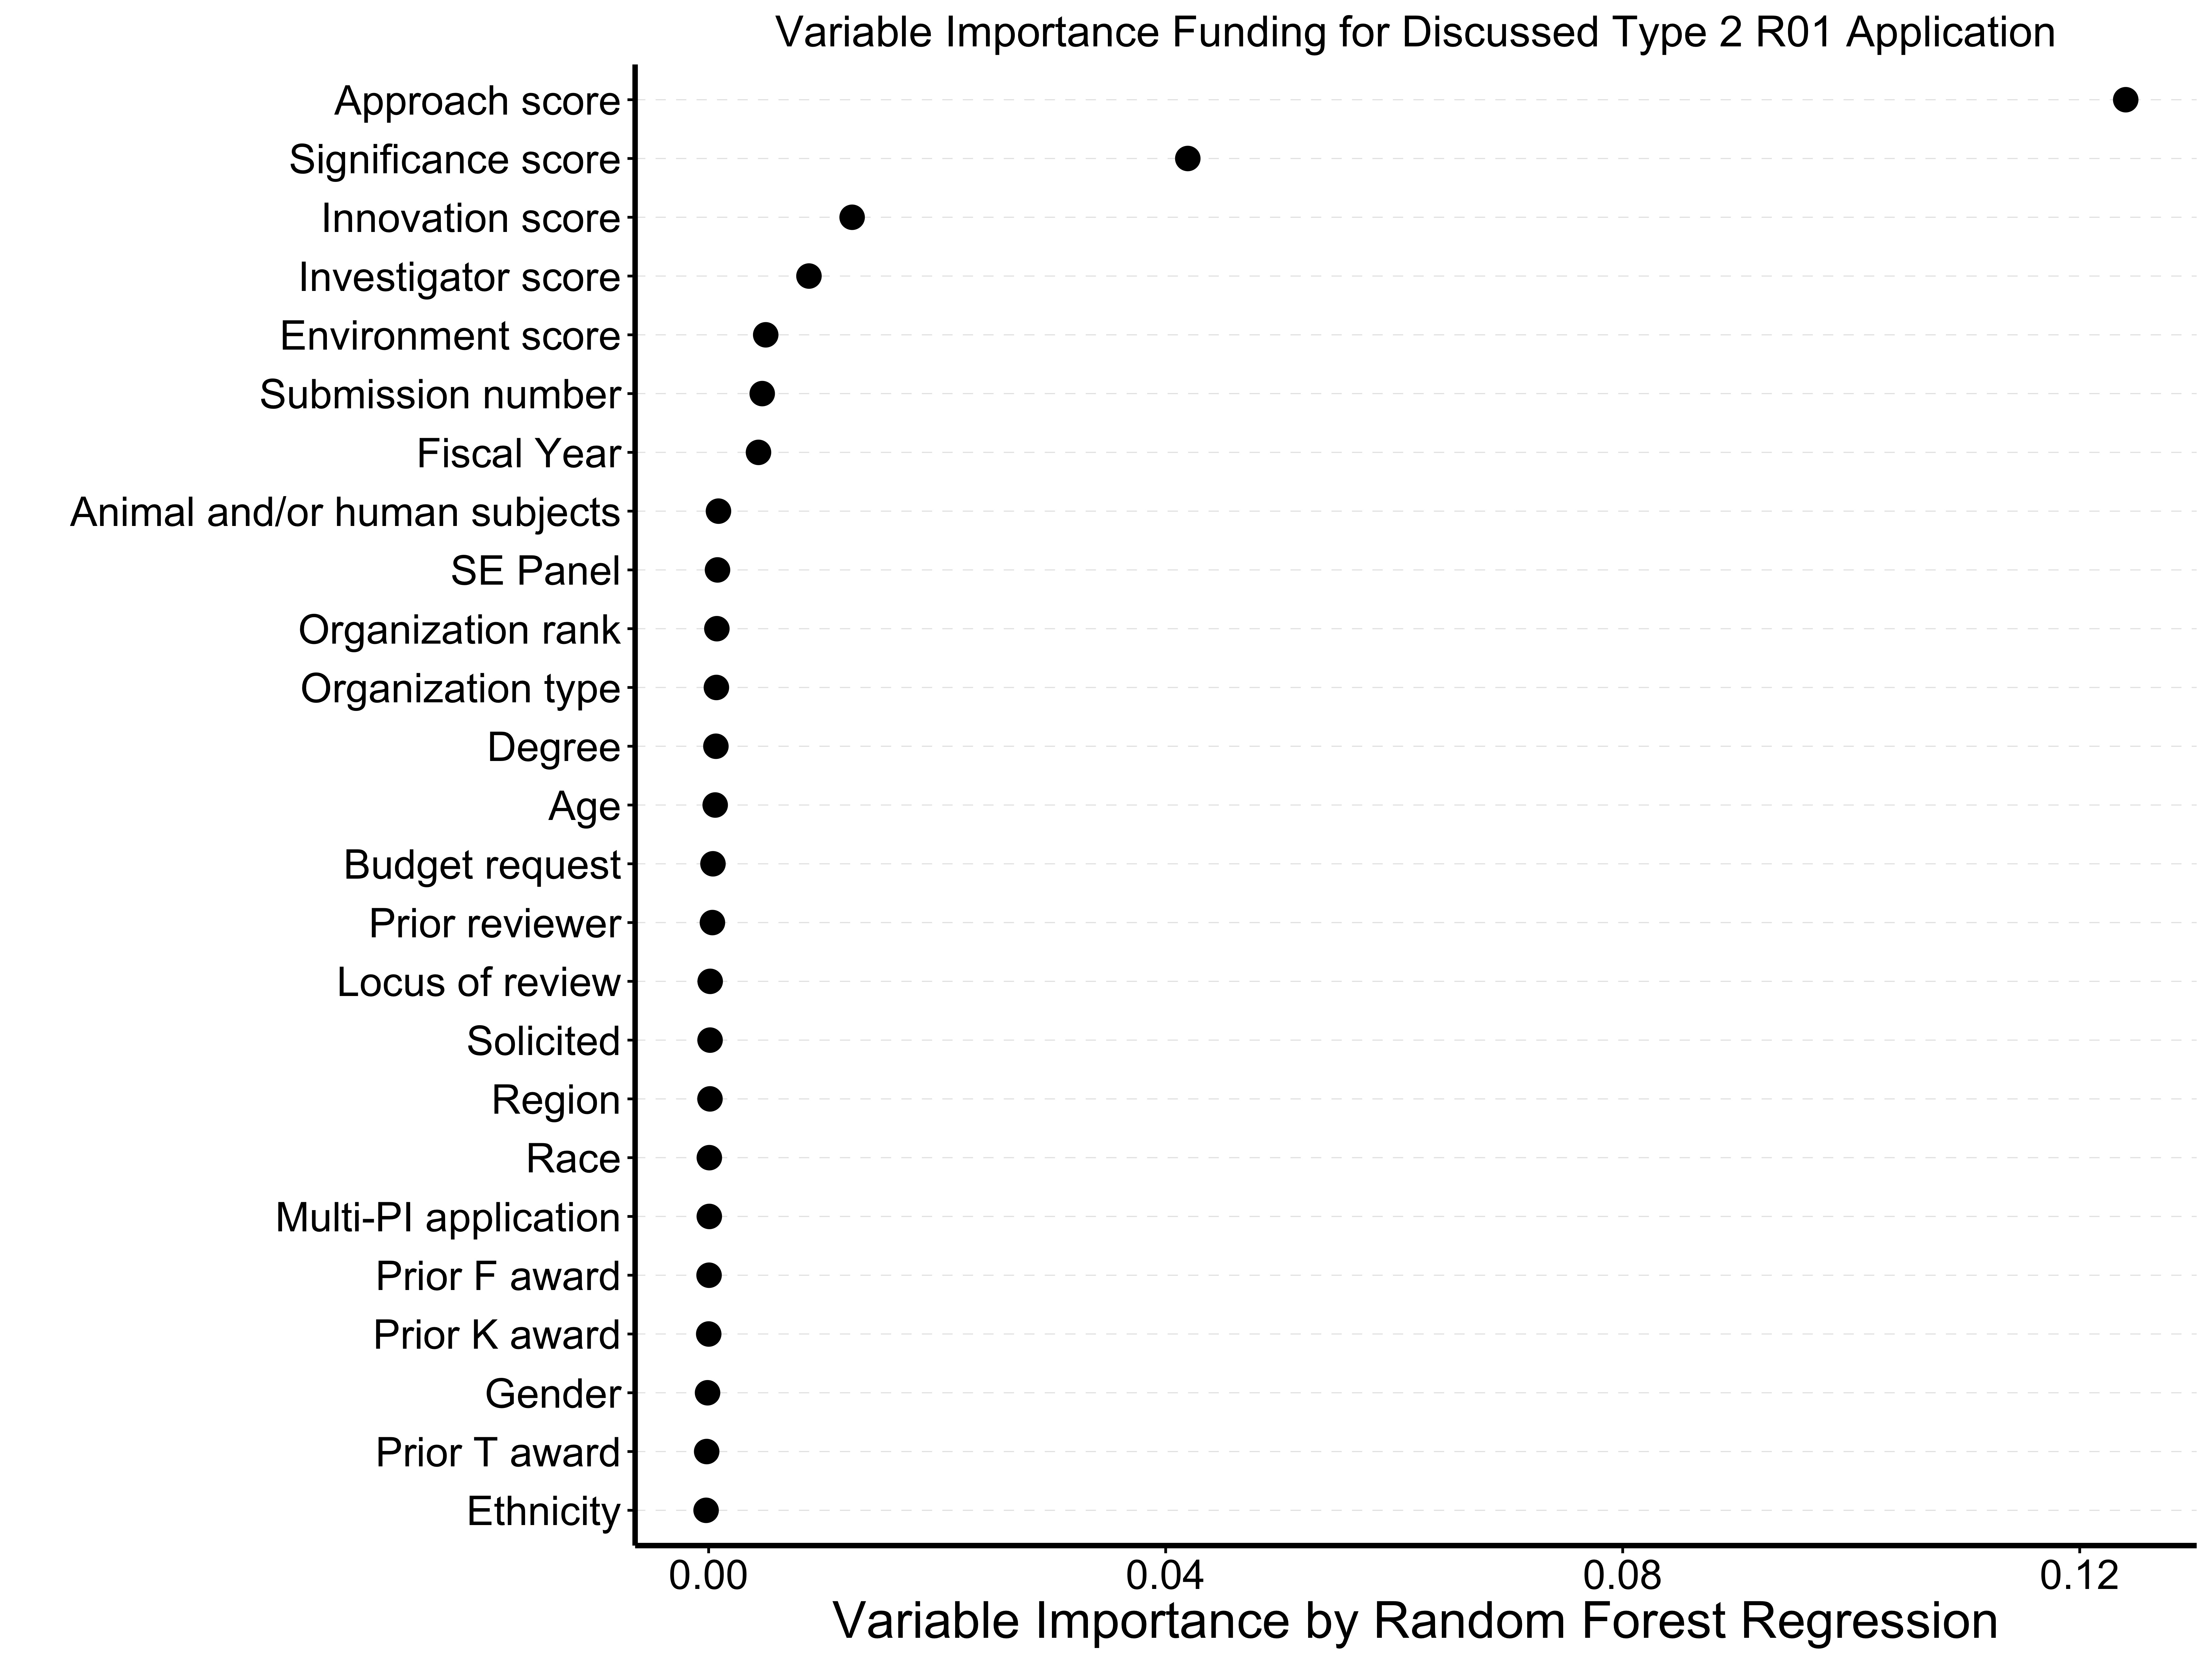
Putting these findings together, we find that among type 2 competing renewal R01 applications, the strongest correlates of success at peer review and of eventual funding are peer review impressions of approach and significance. Personal characteristics (like age, gender, race, prior training) were not materially correlated with success. As we noted before, we think it is helpful for R01 applicants to know that when trying to renew their ongoing projects, the description of experimental approach is the most important predictor of success.
I’d like to thank the authors of the criterion score paper ![]() for their help with their analysis, along with my colleagues in the Statistical Analysis and Reporting Branch of the Office of Extramural Research.
for their help with their analysis, along with my colleagues in the Statistical Analysis and Reporting Branch of the Office of Extramural Research.
How strong is the correlation between productivity from the prior award (number of papers or the new impact statistic that NIH put out) and a good score on the competing renewal? While there is no criteria score for productivity from the prior award, as a regular NIH grant reviewer, I personally weight that even higher than approach when assigning an overall score for a competing renewal application. In my mind, it does not matter how well an approach section is written if the investigator did not use prior money well…..
I completely agree with this comment and one of the most difficult things for many new investigators is to be highly productive on their first award.
The information gained fro this article is not at all surprising. Despite all the scores criteria it is obvious that experimental approach (which includes preliminary data) is correlated best with overall impact score/percentage and funding. The major issue here is for first time investigators who are writing a Type 2 application, it is unlikely that they have neither the existing funding, nor the personnel to execute, to compete with other senior investigators to compel reviewers. The primary reason goes back to money and people. If you have fewer people and less money one’s preliminary data in an ever changing fast paced world are not going to be as sophisticated or elegant as a an established investigator.
In the CHOICE ACT it is too bad therefore that CSR doesn’t find eliminating scores that are not likely to have any major impact on the science. As previous readers write, one indicator of success is productivity, which gets lost in translation these days. Environment and Investigator should be treated like vertebrate animals or authentication of resources–acceptable or not acceptable. Three major issues reviewers judge. Is the project significant? Is the project innovative? How is the Approach executed? Past productivity should count for more in Type 2 than it does now.
On the other hand the way things are trending at NIH, it would be worthwhile for CSR to tell the extramural scientific community whether since 2003 the number of Type 1 R01 applications filed has gone up significantly relative to the rate of increase of Type 2 submissions filed, not funded. This is another important illustration.
Thanks
Anyone interested in the criteria used for judging competing NIH renewals should read the article by Michael Rosbash (Brandeis Univ) in the recent E-Life, (on line). Many of the ideas are not new, but they are clearly stated and they are a breath of fresh air for the current grant applications and their peer review.
Dr. Lauer, can you provide information about the distribution of Type 2 competing renewals across I/Cs and by area of science? Anecdotally, program directors have commented that only bench sciences use the Type 2, whereas population, social and behavioral sciences rarely if ever do- in part, because intervention research is arguably discrete and program directors argue for new applications to examine findings over competing renewals.
And where is the score for the reliability and reproducibility of published data?
When evaluated, these aspects of research appear to be widely and often deficient. I guess the fact that the scoring system ignores these issues helps to explain why so many people dump out dodgy data and run to write their next grant.