
38 Comments

Scientific Workforce Diversity
In this post, we analyze funding rates for Fiscal Year (FY) 2010 to FY 2022 Type 1 Research Project Grant (RPG) and Type 1 R01-Equivalent applicants according to the race-ethnicity of designated Principal Investigators (PIs). We used data from frozen, official, NIH success rate files.
We obtained data on the race and ethnicity of PIs from their entries into the eRA Commons Personal Profile. As noted by NIH, PIs provide these data on a strictly voluntary basis, and these data are not used for making funding decisions. If individuals described themselves as Hispanic in the ethnicity field and not Black in the race field, then race-ethnicity was considered to be Hispanic; otherwise the individual’s race-ethnicity was based on their entry in the race field.
As a reminder, NIH publishes three main kinds of grant outcome metrics, namely award rates, success rates, and funding rates. Award and success rates are application-based metrics, while funding rates are person-based. Throughout the report we refer for convenience to Principal Investigators (“PIs”) as applicants or awardees. In point of fact, applicants and awardees are institutions who in turn designate PIs; PIs are typically employees of the applicants and awardees.
Figures 1 through 5 show the number of Type 1 RPG and R01-Equivalent applicants by race-ethnicity. In FY 2022 the number of white applicants declined while the number of Black and Hispanic applicants continued to increase.
Figure 1: Number of PI applicants by race-ethnicity for Type 1 RPG (Panel A) and Type 1 R01-Equivalent (Panel B) awards by fiscal year.
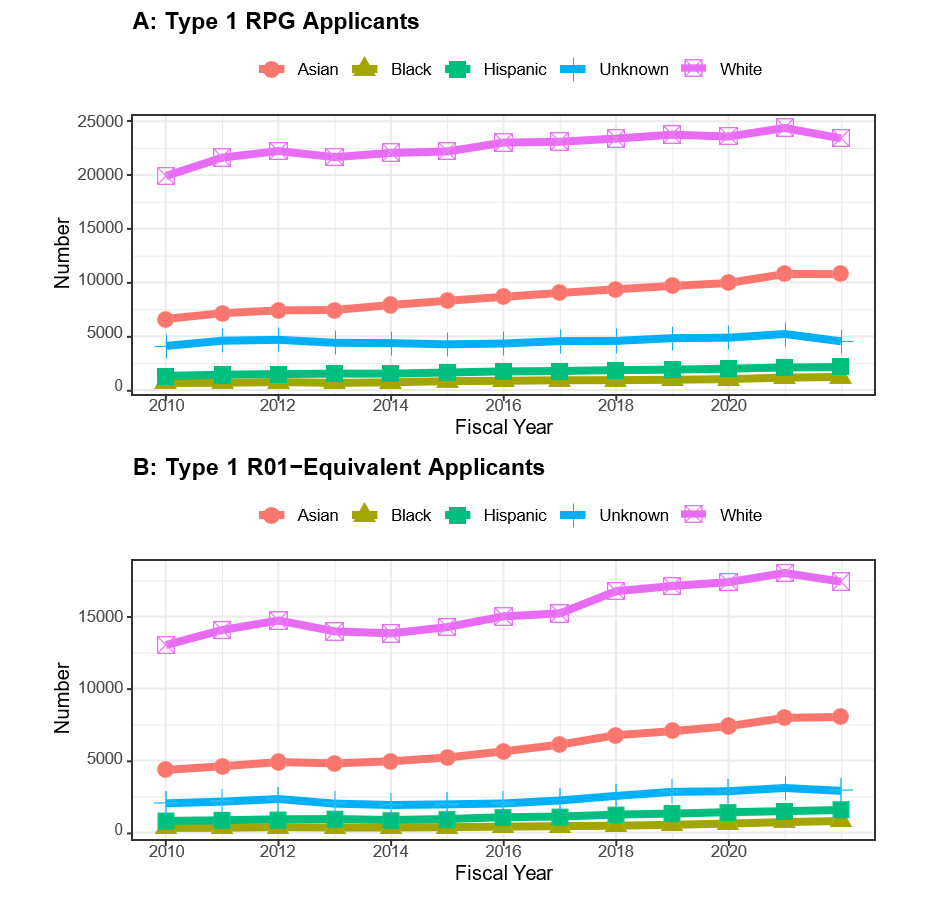
Figure 2: Number of Black PI Type 1 RPG applicants (Panel A) and awardees (Panel B) by fiscal year.
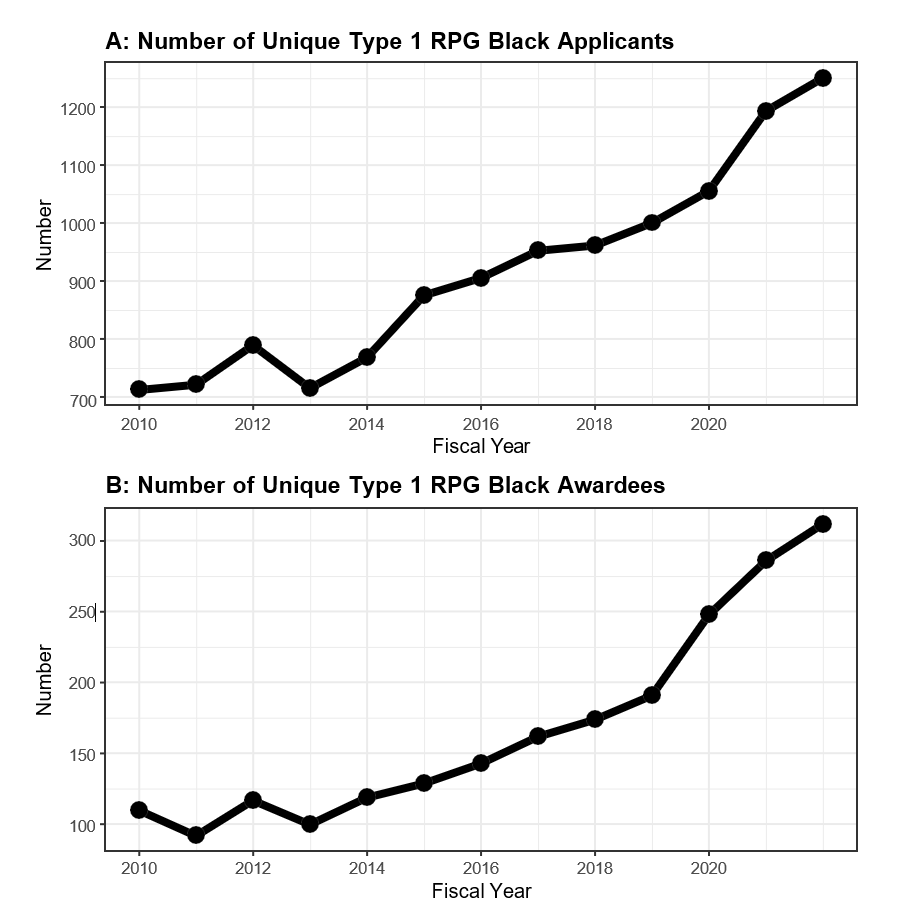
Figure 3: Number of Black PI Type 1 R01-Equivalent applicants (Panel A) and awardees (Panel B) by fiscal year.
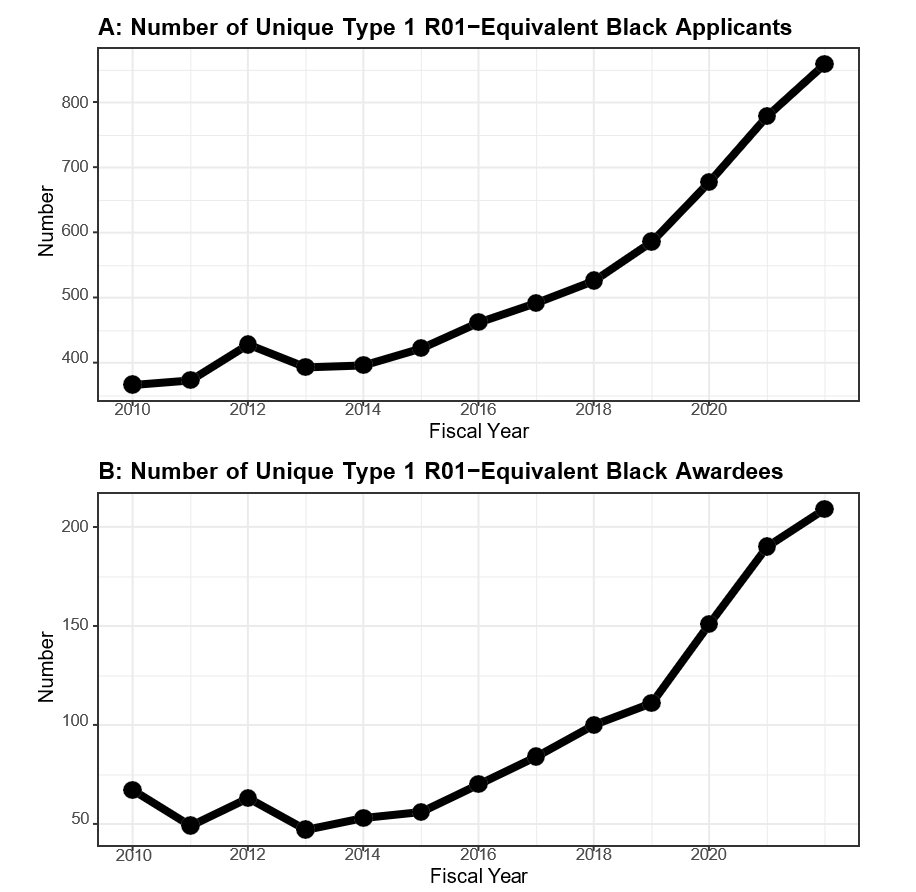
Figure 4: Number of Hispanic PI Type 1 RPG applicants (Panel A) and awardees (Panel B) by fiscal year.
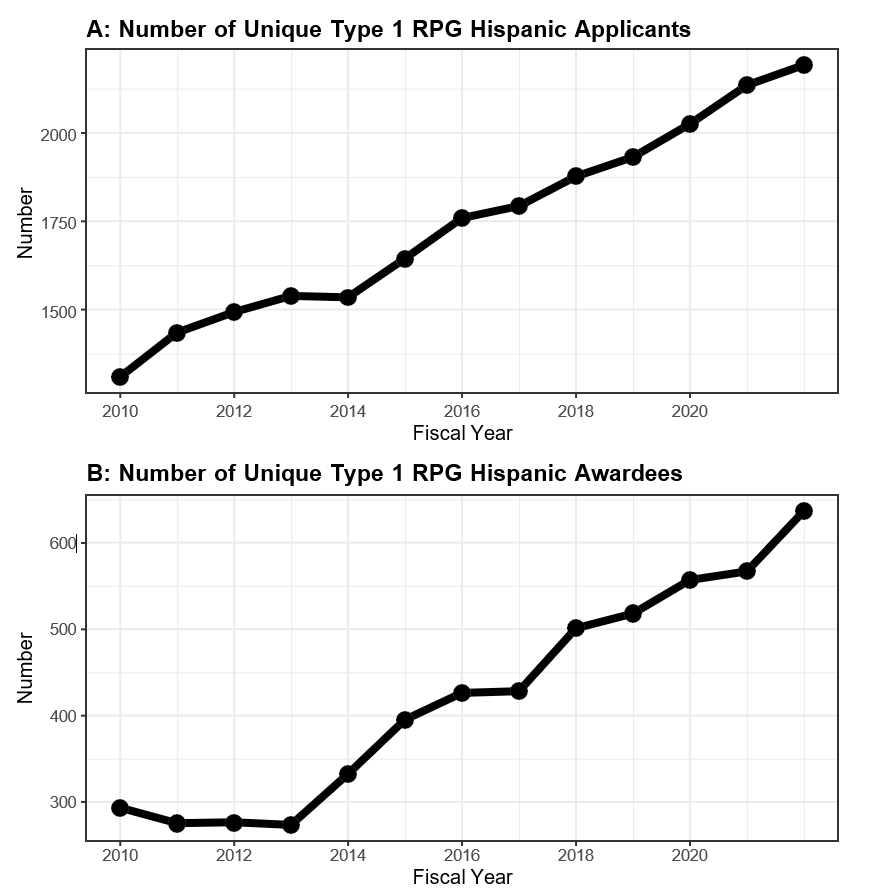
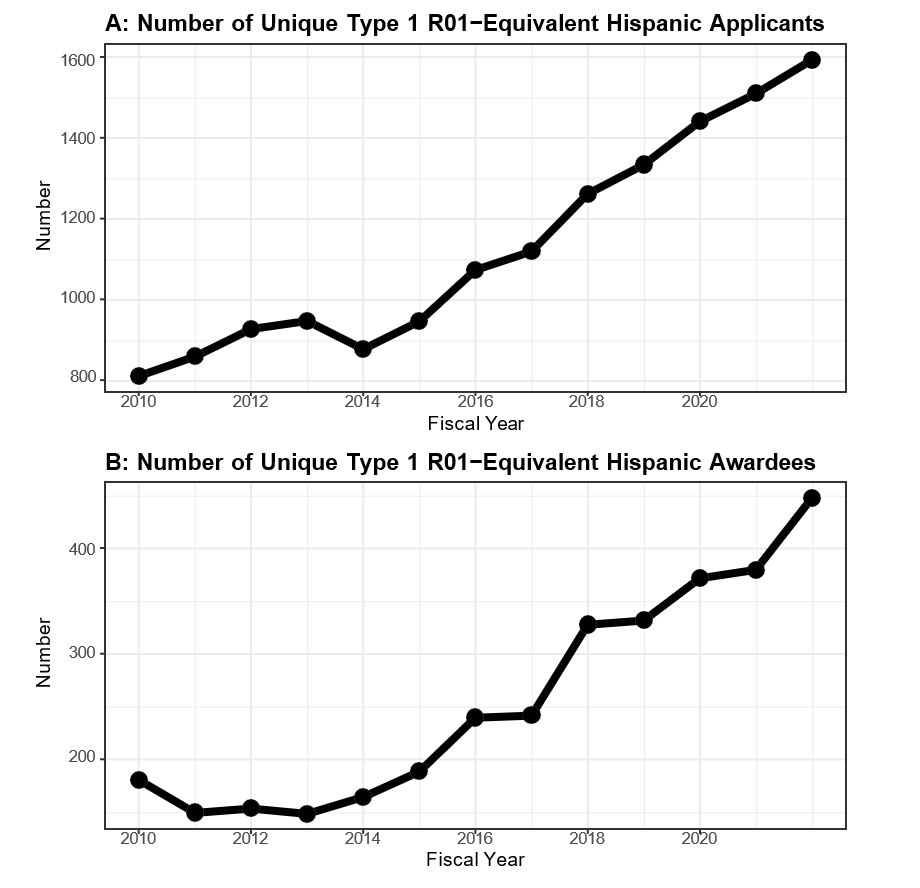
Figure 6 shows funding rates. The gaps for Asian and Hispanic investigators have largely disappeared, while the gap for Black investigators persist, though not as marked as 3-4 years ago.
Figure 6: Funding rates for Type 1 RPG (Panel A) and Type 1 R01-Equivalent (Panel B) applicants by fiscal year according to race-ethnicity.
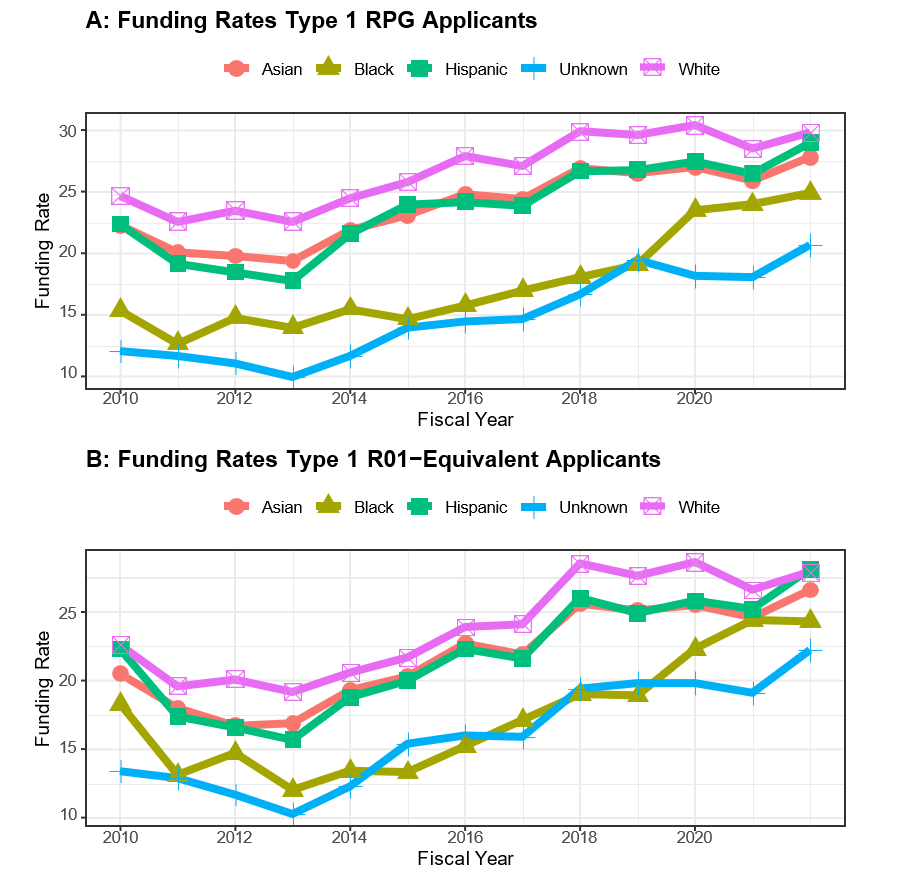
Table 1 shows characteristics according to race-ethnicity for scientists designated as Principal Investigators on at least one Type 1 RPG application in FY 2022. Scientists with unknown race-ethnicity were much more likely to have a degree other than PhD, MD-PhD, or MD; were less likely to submit an R01-equivalent application; were less likely to be early stage investigators; had submitted fewer Type 1 RPG applications between FY 2010 and FY 2021; and were less likely to have submitted an application from an institution of higher education. Compared with white scientists, Black scientists were more likely to be women; less likely to have a PhD; more likely to have a degree other than PhD, MD-PhD, or MD; less likely to submit an R01 application; less likely to submit an animal application; more likely to submit a human application; more likely to be early-stage investigators; had submitted fewer Type 1 RPG applications between FY 2010 and FY 2021; and were less likely to have submitted an application from a research organization or an independent hospital.
Table 1: Characteristics of scientists who were designated as a Principal Investigator on at least one Type 1 FY 2022 application. The numbers of prior Type 1 RPG applications and awards refers to the period of FY 2010 to FY 2021.
| Characteristic | White | Asian | Unknown | Hispanic | Black | |
| Total N (%) | 23430 (55.4) | 10833 (25.6) | 4592 (10.9) | 2193 (5.2) | 1251 (3.0) | |
| Sex | Male | 14010 (59.8) | 7206 (66.5) | 1495 (32.6) | 1254 (57.2) | 637 (50.9) |
| Female | 9151 (39.1) | 3466 (32.0) | 687 (15.0) | 908 (41.4) | 586 (46.8) | |
| Unknown | 269 (1.1) | 161 (1.5) | 2410 (52.5) | 31 (1.4) | 28 (2.2) | |
| Degree | PhD | 16853 (71.9) | 7760 (71.6) | 1862 (40.5) | 1524 (69.5) | 810 (64.7) |
| MD | 3493 (14.9) | 1260 (11.6) | 410 (8.9) | 309 (14.1) | 218 (17.4) | |
| MD-PhD | 2102 (9.0) | 1375 (12.7) | 234 (5.1) | 208 (9.5) | 111 (8.9) | |
| Other | 982 (4.2) | 438 (4.0) | 2086 (45.4) | 152 (6.9) | 112 (9.0) | |
| Submitted an R01-Equivalent Application | 17441 (74.4) | 8064 (74.4) | 2946 (64.2) | 1593 (72.6) | 859 (68.7) | |
| Submitted an R21 or R03 Application | 7492 (32.0) | 4087 (37.7) | 1633 (35.6) | 746 (34.0) | 441 (35.3) | |
| Submitted an Animal Application | 10675 (45.6) | 6270 (57.9) | 1738 (37.8) | 1041 (47.5) | 366 (29.3) | |
| Submitted a Human Application | 12280 (52.4) | 4466 (41.2) | 2450 (53.4) | 1134 (51.7) | 872 (69.7) | |
| Early-Stage Investigator | 4369 (18.6) | 2141 (19.8) | 567 (12.3) | 488 (22.3) | 357 (28.5) | |
| Number Prior Type 1 RPG Applications | Mean (SD) | 8.51 (8.82) | 9.84 (10.73) | 4.89 (8.12) | 7.44 (8.43) | 6.13 (7.93) |
| Number Prior Type 1 RPG Awards | Mean (SD) | 1.68 (2.08) | 1.56 (2.01) | 0.78 (1.58) | 1.32 (1.82) | 0.87 (1.45) |
| Number of FY22 Applications | Mean (SD) | 1.61 (1.04) | 1.85 (1.39) | 1.45 (1.04) | 1.58 (1.07) | 1.56 (1.09) |
| Submitted from Institution of Higher Education | 19594 (83.6) | 9211 (85.0) | 3594 (78.3) | 1865 (85.0) | 1097 (87.7) | |
| Submitted from Research Organization | 1543 (6.6) | 602 (5.6) | 353 (7.7) | 124 (5.7) | 49 (3.9) | |
| Submitted from Independent Hospital | 2145 (9.2) | 892 (8.2) | 371 (8.1) | 152 (6.9) | 67 (5.4) | |
| Funded as Principal Investigator | 6981 (29.8) | 3007 (27.8) | 951 (20.7) | 637 (29.0) | 312 (24.9) | |
We conducted logistic regression analyses for funding of at least one FY 2022 Type 1 RPG application among scientists designated as Principal Investigators. Black scientists were less likely to be funded with the effect size decreasing by approximately 40% after adjusting for considered confounders. In the multivariable model, the strongest predictors of funding success were the number of applications submitted in FY 2022, the number of Type 1 RPG awards between FY 2010 and FY 2021, and early stage investigator status; the strongest predictors of funding failure were a larger number of applications submitted between FY 2010 and FY 2021 and a degree other than PhD, MD-PhD, or MD.
In summary, these analyses show slight improvements in funding and success rates in FY 2022, partially due to a decline in the number of applicants and applications. Race-ethnicity gaps have narrowed over the past few years, though a white-Black gap, while narrower than before, persists and actually increased in FY 2022 compared with FY 2021. Additionally, although there are increased numbers of Black and Hispanic applicants, the total numbers remain quite small.
We are grateful to our colleagues in the NIH Office of Extramural Research Division of Statistical Analysis and Reporting (DSAR) for their help with these analyses. For a more in-depth version of this report, please see the full report.
Editorial note added on October 16, 2023: Native Hawaiian or Other Pacific Islanders as well as American Indian or Alaska Native researchers were excluded from the report as noted in the blog and full length reports (linked at the end) due to small cell sizes. We do not publicly report sample sizes that are sufficiently small (<12), which is considered as potentially identifiable. Separately, our intent was to focus on African American/Black and Hispanic applicants in some of the panels here, but we will only show one panel (that includes Asian and other researchers) going forward on any future analyses.
It is very interesting. Can you share the result after adjusting the application number per 100,000 US population by race-ethnicity? Thank you for sharing the analysis result!
I second this. Also, for minorities, the number of applicants doubled and the awardees were multiplied by 3-4 meaning that they have now a greater chance of getting an award compared to the previous decade. How is this trend for whites?
Would have been nice to also provide an update to the analysis of MD versus PhD versus MD/PhD funding rates provided in 2012 (link to source article https://nexus.od.nih.gov/all/2012/04/27/does-your-degree-matter/ ).
The interesting data on roughly doubling of black applicants and awardees shown in Figure 3 might be influenced by the higher % of black MDs (17.4%) than white (14.9%) in the PI population if the funding rate levels between the degree types has widened since 2011.
I was wondering the same but would also like some context for why/how the drastic increase? Are these active efforts by NIH? If so, what?
it is indeed very disappointing that there is nothing about funding rates by Disability – as a researcher self-identify or as a healthcare disparity and inequity target population. the narrative or paradigm of who is considered as part of ‘diversity, equity, and inclusion’ is tightly controlled and limited.
Data that looks at disability would hopefully recognize the diversity of the Disabled community and also have an intersectional approach – meaning that scholars who are both Black and Disabled will also have very different rates of funding from those who are white and Disabled, etc. Looking at non-racial identities in a country built off of the enslavement/genocide/displacement of Black and Native people is not appropriate.
Hello, Can you please add American Indian/Alaska Native and Native Hawaiian applicants? Thank you.
Yes, this is very important for those of us working in this state of Hawai’i. I was assuming that they were included in the Asian group, as they often are and this masks their outcomes.
Yes, please. I second (or third) this request!
I know that NIH is constrained by the federal race/ethnicity definitions, but I do think it is important to find some way to separate out applicants directly from Spain from the rest of the Hispanic group. Given the small numbers, I think the use of the use of the label without that distinction is misleading.
The tables may not accurately depict the true representation of the Latino group. The number of applicants reported in the Hispanic group could be inflated as it may include applicants from Spain.
You have done many analyses over the years on the comparisons for R01 funding rates. Can you perform one set of studies to compare R01-supported productivity between ethnic groups? You have all those RPPR data that can be readily pulled. And the productivity-normalized funding rate is perhaps more accurate than the crude funding rate number listed in here. Thank you
And what do you propose we do with such data?
Not only do different fields of studies produce work at different rates, RPPR is composed using subjective criteria. You cannot obtain information that is objective or fair for comparison purposes using the method you proposed.
About 6.6 million people in the United States, or 2% of the total population, identify as Native American or Alaska Native, either alone or in combination with another ethnic identity. So why are they excluded from this study? I do not think that is proper.
It says that “the gaps for Asian and Hispanic investigators have largely disappeared,” which doesn’t seem supported by Figure 6. Figure 6 shows that the gap between Hispanic and White investigators in terms of funding rate has significantly decreased/disappeared, but the gap between White and Asian investigator remains similar throughout the year. Also, the trend for unique Asian awardees has not been plotted here. The lower funding rate for AARP investigators compared to White has been dismissed.
Figures showing improvement for blacks and minorities based on absolute numbers can be misleading. More relevant data would include percentage of grant applications submitted by minority applicants that were funded (based on total grant applications submitted). It will also be helpful to know how “funding rates” are calculated. Fig 2B most likely reflect the current reality: black PIs least likely to be awarded NIH funding, compared to all other groups.
Did you control for geographic location?
As it seems you are not emulating a prior analysis for direct comparative purposes, it is highly disappointing that American Indian/Alaska Native PIs are being clumped into an unhelpful “Unknown” group. In fact, unhelpful is being kind, ‘discourteous’ might be a better term.
It would be helpful to see a comparison of gender separate from race as well as gender within race. Is this data available please?
Do you have similar information for sex by group
It would be very useful to segment the results by R1 universities vs non-R1. Alternately, one could look at AAU vs non-AAU. I suspect that many of the disparities can be accounted for by the lack of diversity at elite institutions.
Thank you so much for sharing these stats as disturbing as they are! I would like to see Table 1 stratified by submissions and resubmissions for race/ethnicity.
Would it be possible to see this same information but by rural, suburban, and urban locations of the PIs.
Thank you for the information. Please include American Indians, Alaska Natives, and Hawaiians.
1) These numbers should not be looked at in a vacuum. The representation of white scholars (~57.8% of the US), Asian scholars (5.6%), Hispanic scholars (not a race, but roughly 20%) and Black scholars (roughly 14%) is important. We can see that both white and Asian scholars are overrepresented when it comes to funding and representation in higher education in general.
No race is a monolith. If we broke up Black scholars by those who are African American, Caribbean, from one of 54 African countries or Central/South America, Puerto Rico, etc. Black scholars would still make up single digits and this is because of centuries-long oppression and discrimination that has not equally affected all races.
Hispanic/Latinx is not a race and is constantly conflated with one. This erases disparities for Brown and Black Hispanic people. The data shows us that white Hispanic and white Latine people are overrepresented both in Central/South American higher education and in the United States.
And lastly, for all the white folks who are going to “what about me” this data, please be mindful that many of us who are Black scholars are also women, Hispanic, Queer, Disabled, etc and have suffered disproportionately while also being left out of many efforts that have disproportionately benefitted white women, white Disabled people and white Queer people. Your marginalized identity does not erase your whiteness.
I hope we can center those most underrepresented and affected. I also hope that Native scholars are included, though Native is also not a race.
Melise,
Your post is quite racist and also analytically flawed. While it is so that oppression and discrimination have not equally affected all races and ethnicities, it is also so that “many of [you] who are Black scholars [and] also women, Hispanic, Queer, Disabled, etc” have not suffered disproportionately compared with white people of various categories. “Whiteness” is a racist term, as is “Blackness.” These data are group data, interesting group data. But, it is inappropriate to boil this down to an individual level of analysis, as your post does via your statement, “Your marginalized identity does not erase your whiteness.”
It is encouraging to see that the trajectory of activity of underrepresented minorities is increasing.
It would be good to see sex-based analyses for total submissions and for each ethnic group as well
I second that
In keeping with the theme of complaining about the categories, I would add that the most blatant example of a non-existent racial category is ‘Asian.’ Asia is the name of a very large geographical region. About 60% of world population lives in this geographical region. One in four humans alive lives just in the Indian subcontinent. I don’t know whether it is more stupid or more ignorant to claim that there is something called an ‘Asian’ race or ethnicity. There is much diversity within ‘black’,’hispanic’, and ‘white’ categories as well, but all of them pale in comparison to the ridiculousness of assigning a fictional race to 60% of the world population.
As it relates to the definition of the race and ethnicity categories, NIH has adopted the 1997 Office of Management and Budget (OMB) revised minimum standards for maintaining, collecting, and presenting data on race and ethnicity for all grant applications, contract and intramural proposals and for all active research grants, cooperative agreements, contract and intramural projects. The minimum standards are described in the 1997 OMB Directive 15. The 1997 OMB revised minimum standards include two ethnic categories (Hispanic or Latino, and Not Hispanic or Latino) and five racial categories (American Indian or Alaska Native, Asian, Black or African American, Native Hawaiian or Other Pacific Islander, and White). The 1997 OMB standards are federal standards for data collection on race and ethnicity that must be used by all federal agencies, including NIH.
OMB is currently accepting public feedback on these race and ethnicity categories until April 10, 2023, please see their Federal Register notice here: https://www.federalregister.gov/documents/2023/01/27/2023-01635/initial-proposals-for-updating-ombs-race-and-ethnicity-statistical-standards
This is very useful information. Please include data on white applications and white awardees.
Also of great importance is sex differences. Is this information elsewhere?
Would be interesting to see such data where rurality, first gen and/or economically disadvantaged PI status is factored, independent of ethnic status.
Informative report; much more can be done with the data. I wonder if the increase in Hispanic awards is related to the increase of Hispanic Serving Institutions and their resources (at some universities).
Scales differences in Figures 2 to 5 could make data interpretation quite different from what the actual data represents. Fig.2A Y-axis is 700 to 1200; and 2B Y-axis 100-300; Fig 3A Y-axis is 350-800; and 3B Y-axis 50-200, Fig.4A Y-axis is 1250-2000 and 4B Y-axis 250-600. Fig.5A Y-axis is 800-1600, whereas Fig.5B Y-axis is 100-400. Because of these differences in scales, one cannot accurately compare and contrast these data.
I am perplexed as to the lack of reporting on American Indian/Alaska Native people in the report. Also missing are individuals who experience disabilities.
Is it correct to assume from this that there were approximately 250 Black individual R01 equivalent awardees in 2022 and approximately 500 Hispanic? Then, how many individual awardees in 2022 were White or Asian (must be in thousands)? While the rate is important, I think the raw numbers make a pretty big statement about disparity that cannot be overlooked.
Native Hawaiian or Other Pacific Islanders as well as American Indian or Alaska Native researchers were excluded from the report as noted in the blog and full length reports (linked at the end) due to small cell sizes. We do not publicly report sample sizes that are sufficiently small (<12), which is considered as potentially identifiable. Separately, our intent was to focus on African American/Black and Hispanic applicants in some of the panels here, but we will only show one panel (that includes Asian and other researchers) going forward on any future analyses.
There are many NIH grants Whites and Asians are not allowed to apply – Racism by definition, using American tax-payers’ money.