
44 Comments

NIH has long collected self-designated demographic information on scientists designated as Principal Investigators (PIs) or Key Personnel and used this information to gain insights into the NIH-supported biomedical research workforce. Just over 10 years ago, Ginther and colleagues used these data to publish a seminal paper that showed that Black/African American PIs were less likely than whites to receive funding on R01 applications. Since that publication, NIH embarked on efforts to enhance the diversity of the biomedical research workforce; these efforts include establishing the Chief Officer for Scientific Workforce Diversity, the Diversity Program Consortium as well as numerous other trainee-focused interventions to enhance the scientific workforce.
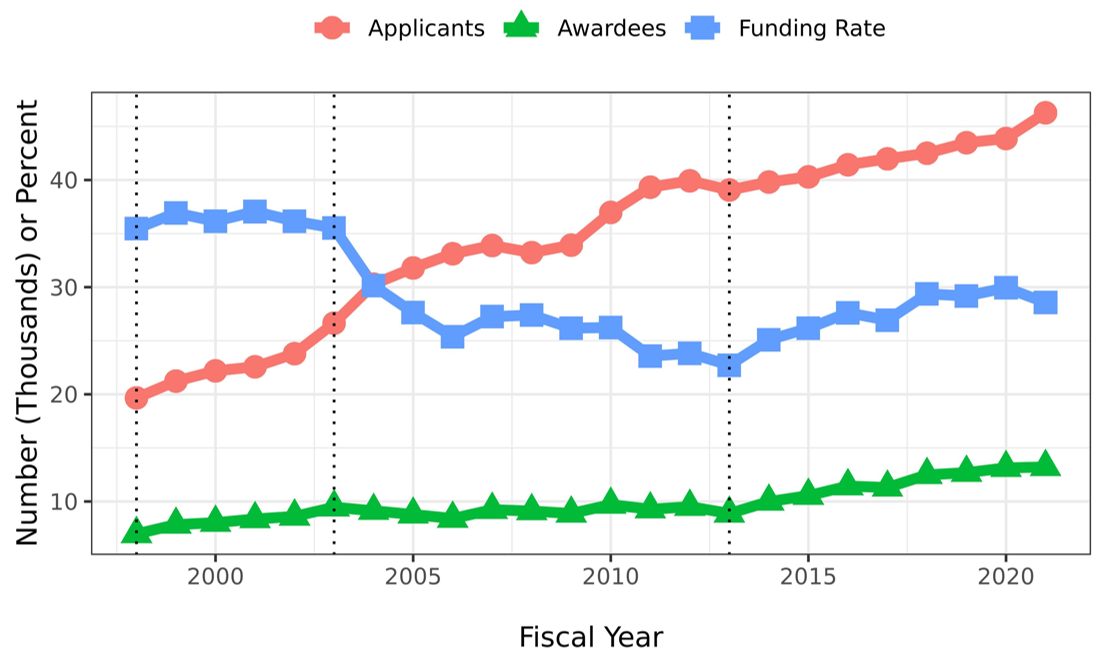
NIH tracks the success of applicant PIs (that is scientists designated by their institutions as PIs on applications for funding) with a metric called the “funding rate,” which is the ratio of the number of unique applicant PIs who are successful on at least one application to the number of unique applicant PIs who submitted at least one application. Thus, if in a given fiscal year there were 40,000 unique PIs and 10,000 who were successful in securing funding at least once the funding rate would be 10,000 / 40,000 or 25%. Figure 1 shows funding rates for PIs who sought funding on NIH Research Project Grant applications.
Figure 1: Funding rates for Research Project Grant (RPG) Principal Investigators (PIs) 1998-2021.
Now we focus on data derived from the voluntary collection of personal demographic information. Table 1 shows selected characteristics of FY2021 applicant PIs according to race-ethnicity. It is important to note that nearly 12% chose not to provide their race-ethnicity. There were differences: for example, self-designated Black/African American PI, who constituted 2.6% of applicants, were less likely than whites to submit an application proposing animal research, but more likely to submit an application proposing human participant research.
Table 1: RPG PI Characteristics FY2021. Characteristics of scientists designated as Principal Investigators (PIs) on at least one Research Project Grant (RPG) application submitted to NIH in FY2021 according to self-designated race-ethnicity.
| Characteristic | White | Asian | Unknown | Hispanic | Black | |
| Total N (%) | 25728 (55.6) | 11129 (24.1) | 5408 (11.7) | 2219 (4.8) | 1219 (2.6) | |
| Female | 9824 (38.2) | 3555 (31.9) | 732 (13.5) | 900 (40.6) | 574 (47.1) | |
| Age (years) | Median (IQR) | 43 (38 to 51) | 41.0 (38 to 47) | 42.0 (37 to 49) | 41 (37 to 48) | 41 (37 to 47) |
| Degree | MD | 3862 (15.0) | 1320 (11.9) | 427 (7.9) | 317 (14.3) | 207 (17.0) |
| MD-PhD | 2270 (8.8) | 1409 (12.7) | 255 (4.7) | 211 (9.5) | 104 (8.5) | |
| Other | 1231 (4.8) | 586 (5.3) | 2772 (51.3) | 159 (7.2) | 131 (10.7) | |
| PhD | 18365 (71.4) | 7814 (70.2) | 1954 (36.1) | 1532 (69.0) | 777 (63.7) | |
| Submitted an R01E | 22868 (88.9) | 9629 (86.5) | 3734 (69.0) | 1877 (84.6) | 951 (78.0) | |
| Submitted multi-PI | 19107 (74.3) | 7473 (67.1) | 3665 (67.8) | 1551 (69.9) | 762 (62.5) | |
| Submitted animal app | 14974 (58.2) | 7569 (68.0) | 2348 (43.4) | 1287 (58.0) | 453 (37.2) | |
| Submitted human app | 17884 (69.5) | 6933 (62.3) | 3476 (64.3) | 1458 (65.7) | 968 (79.4) | |
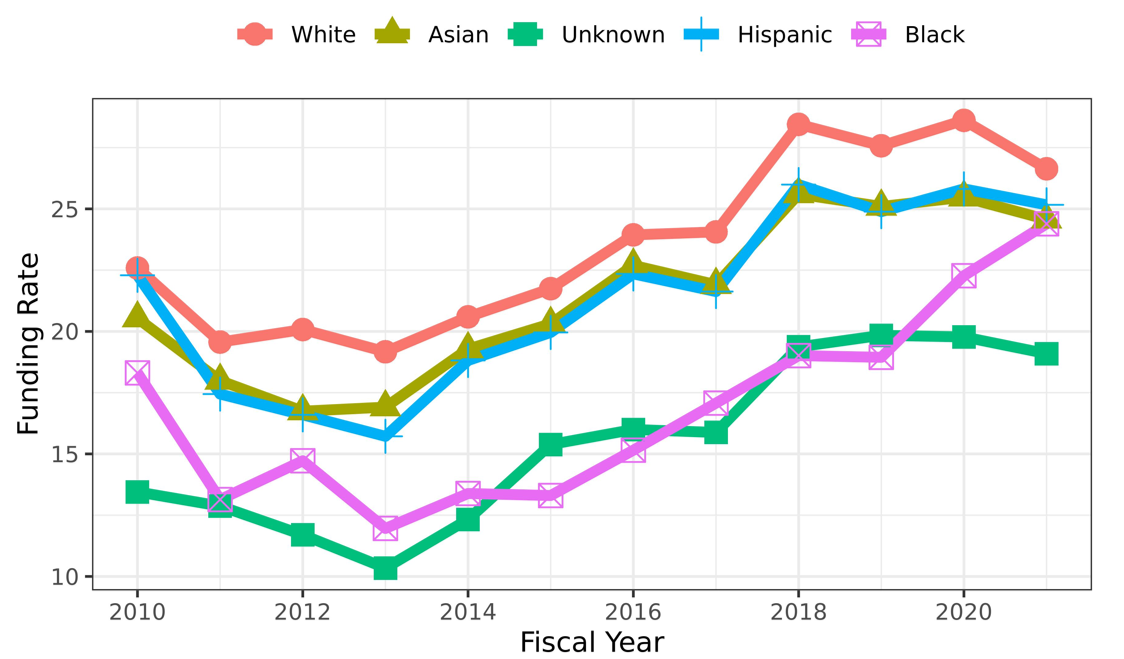
Figure 2 shows the number of unique RPG applicant PIs from FY2010 to FY2021 according to self-designated race-ethnicity. The absolute numbers of Black/African American and Hispanic applicants remained low, consistent with NSF data of underrepresented groups. Nonetheless, as shown in Figures 3 and 4, the numbers of Black/African American and Hispanic applicants have recently increased substantially – in relative terms. Figure 5 shows the funding rates for Type 1 RPG applicants; race-ethnicity differences appear to be narrowing over the last 2 years. Figure 6 shows corresponding data for Type 1 R01-equivalent applicants.
Figure 2: Number of unique RPG applicants (scientists designated as PIs by their institutions on RPG applications submitted to NIH) FY2010-FY2021 according to self-designated race-ethnicity.
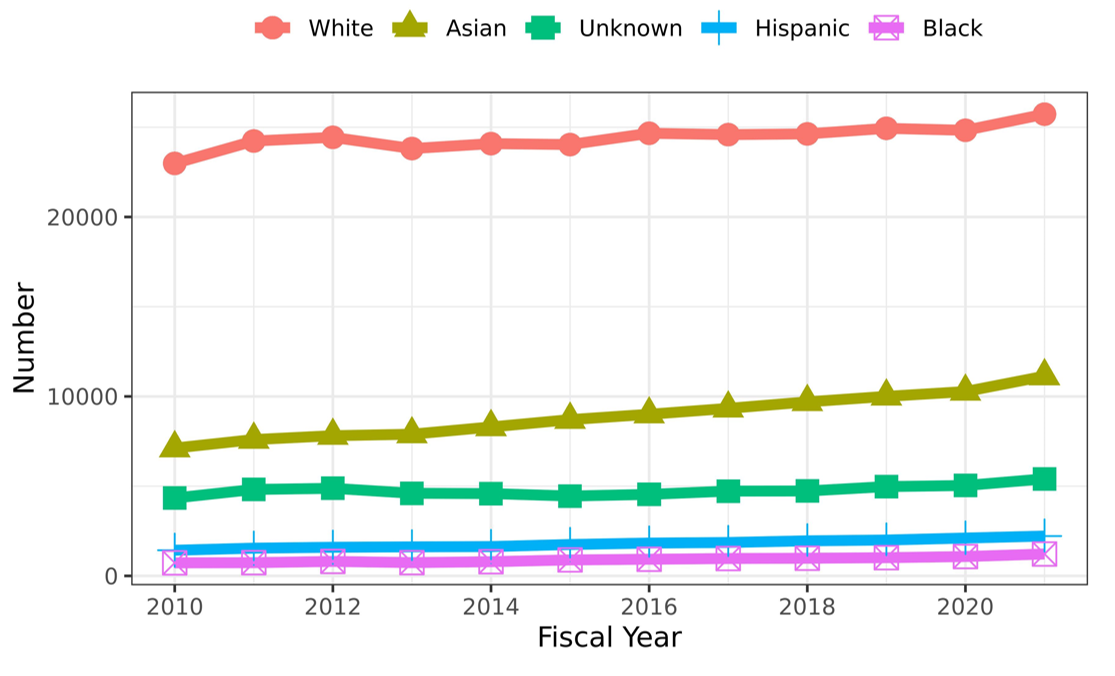
Figure 3: Number of unique self-designated Black RPG applicants (scientists designated as PIs by their institutions on RPG applications submitted to NIH) FY2010-FY2021.
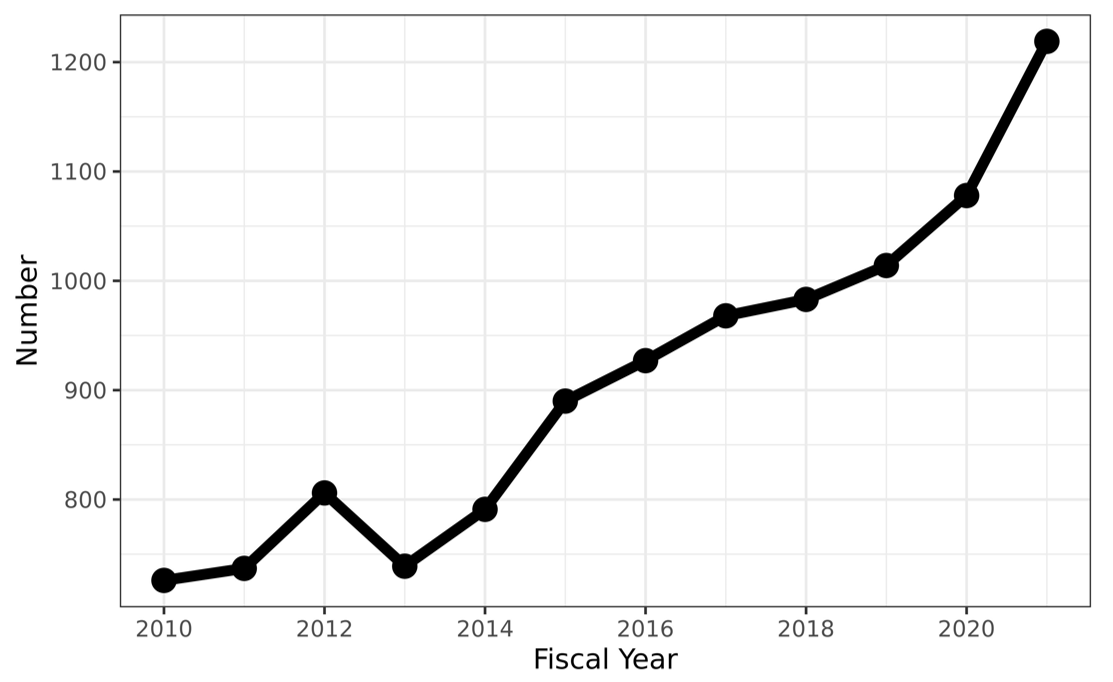
Figure 4: Number of unique self-designated Hispanic RPG applicants (scientists designated as PIs by their institutions on RPG applications submitted to NIH) FY2010-FY2021.

Figure 5: Funding rates for Type 1 Research Project Grant (RPG) Principal Investigators (PIs) 2010-2021 according to self-designated race-ethnicity.
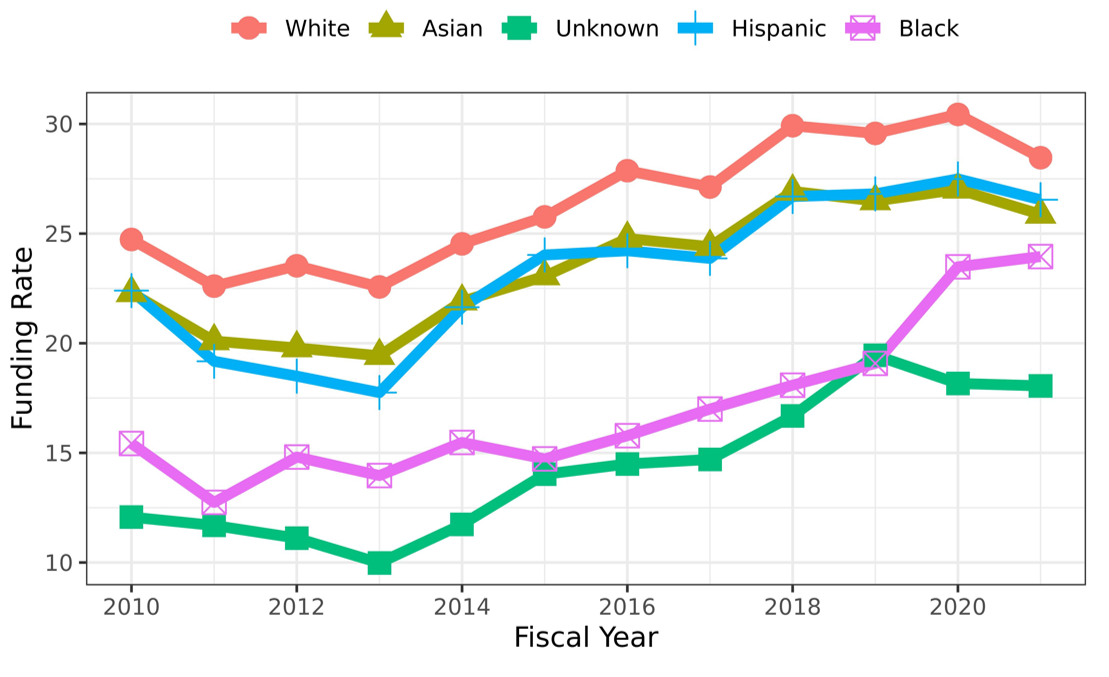
Figure 6: Funding rates for Type 1 R01 Principal Investigators (PIs) 2010-2021 according to self-designated race-ethnicity.
We have more data to show which we are posting here. We hope you will take a look at these as well as other NIH postings on workforce diversity.
Although the trend toward reduction of the NIH funding gap is gratifying, significant work remains before the NIH realizes a truly diverse scientific workforce representative of our nation. As such, the NIH has renewed its commitment to enhancing diversity, equity, and inclusion, particularly through UNITE. The NIH will continue developing new interventions and enhancing existing programs to promote inclusive excellence, building upon demonstrated success
We are grateful to our colleagues in the NIH Division of Biomedical Research Workforce, the NIH Division of Statistical Analysis and Reporting, and the NIH Chief Officer for Scientific Workforce Diversity office for helping us prepare this blog.
What about American Indians, Alaska Natives, Native Hawaiians and Pacific Islanders. We are part of the Register 15 race mandate. ah dah???
100% We exist! And no lumping Pacific Islanders into the Asian American category…AAPI is erasure. If they gotta show the indigenous bars at 0 or <1, then so be it…better than just omitting all together because "not enough data points"
Our current analysis reflects the Ginther analysis.
Yes, this!
What is the origin of the Hispanics and Asians? Are they USA born? If not USA born, where were they educated (K-12).
This is a good question. I think Hispanic funding rates would be much lower if this category was limited to US-born Hispanic individuals.
It would be great if this data could be dis-aggregated for US- vs. foreign- born individuals.
We do not collect the country of origin of principal investigators.
For Asians, I think it’s important to recognize there are many ethnicities with different levels of educational attainment and sociocultural factors that influence who are in academia. I think it would be great in the future to de-aggregate some of this racial data – even for other races.
As always, NIH fails to take any notice of scientists with disabilities.
Absolutely! People with disabilities continue to be ignored and dismissed – from discussions of employment status and discrimination and from discussions of healthcare disparities and healthcare inequities. When the question is forced, NIH has platitudes and excuses but mostly has politicized discrimination and oppression – and perpetuates an attitude that ‘people with disabilities need to wait their turn’, a turn that has never and will never come.
This! Work by Bonnielin Swenor has shown how disabled scientists are less likely to receive NIH funding. So what does NIH plan to do to rectify this gap? Disabled scientists are less likely to be included in NIHs diversity programs (look at the 2019 nexus post on diversity supplements). I wrote several suggestions in my response to the RFI you put out earlier this year, but that probably went in one ear out out the other. People with disabilities make up to 25% of the US population and have lived experiences that can enhance research, so our inclusion should be a priority.
You have women in the table of applicants it would be nice to see the fund rates for women in each of the categories shown in the graphs as well.
Our current analysis reflects the Ginther analysis.
Does NIH view it as a crisis yet that only 13.4% of NIH applications are being submitted by MDs?
That is a symptom of the medical enterprise, not the NIH.
PhD’s have more direct training in conducting research, whereas MD’s do not have to acquire those skills to get an MD, so I’m not sure why that would be a crisis.
It would be interesting to see funding rates for male v.s. female applicants for these categories, or can these data be assessed elsewhere?
As a gerontologist, I would be most interested in funding rates for “old”, age 70+ investigators. There is an impression that ageism suppresses funding rates.
Thanks for raising this issue. It would be especially interesting to have statistics on PIs who were well funded prior to reaching their 65th birthday and to then determine what happens afterwards. My impression: age lowers the success rate dramatically. Combining age with being female or perhaps, female, older and being a minority could have significant impact on the workforce of persons, perhaps, most gifted to me mentors.
This should also be shown separated by gender as ageism is different for different genders.
Our current analysis reflects the Ginther analysis.
If instead of optimizing the graph for African and Latino American applicants (we can all see what you did to the X axis). What would it look like if you normalized those applicants to the very obvious increasing numbers of Caucasian and Asian applicants. It appears relative to their peers there are less African and Latino Americans applicants.
The NIH Notice of Interest in Diversity (20-031) also notes Individuals from Disadvantaged Backgrounds. I can speculate as to why this group is never counted but I would prefer to hear the official NIH position. Is the rationale the same as for individuals with Disabilities?
There’s clearly data suppression around People who are Deaf or Disabled. there’s no or little counting of Deaf persons or PWD and what little data there is is not shared. COSWD only publishes color/RNO-related data and demographics. their acknowledgment of people with disabilities is very superficial.
Yes, Rebecca, I agree! less than a third of applications for some ‘categories’ are women. Please remember that women are also a minority in life sciences.
I agree with Eva Kahana’s request for more data on funding to older PIs (65+). It is my impression that the emphasis on getting more young investigators funded by changing paylines at the Institutes(28th vs 10th) and instructing NIH reviewers to give young investigators a break when reviewing has a trickle down effect on reviewers so that there is now an implicit bias against PIs over 65.
Shirley HIll
But shouldn’t there be? Why are we still funding PIs in their 80s? We have lost most of the scientists from my generation (50ish) to other careers because opportunities for advancement are stifled by a cadre of senior scientists who simply refuse to retire or to step down as PIs.
How are the Research Project Grant Funding Rates for Principal Investigator from socioeconomically disadvantaged backgrounds? How about Women from socioeconomically disadvantaged backgrounds?
NIH recognizes the poor outcomes of those from low socioeconomic backgrounds and in 2019 you stated that NIH recognized that it needed to encourage and enable careers of biomedical scientists with disadvantaged backgrounds. How is this being addressed? As of 2022, there is no mechanism for one to identify that they are from a disadvantaged background and there are no funding opportunities for those from disadvantaged backgrounds beyond the postdoc period. There are many mid-career scientists whose careers have been impacted by being disadvantaged yet there are no opportunities for these individuals. When NIH ignores disadvantages individuals, the institutions they fund also ignore disadvantages individuals.
In FY2018 less than 1% of investigators on diversity supplement applications came in under the disadvantaged background, I don’t suspect this has increased because the class is completely ignored at every level.
source: https://nexus.od.nih.gov/all/2019/11/26/expanding-nihs-definition-of-socio-economic-disadvantaged-to-be-more-inclusive-and-diversify-the-workforce/
Underrepresented Populations in the U.S. Biomedical, Clinical, Behavioral and Social Sciences Research Enterprise: (A) Race, ethnicity; defined as Blacks or African Americans, Hispanics or Latinos, American Indians or Alaska Natives, Native Hawaiians and other Pacific Islanders, (B) disabled and (C) disadvantaged and (D) Women in any of these categories (A-C) are further disadvantaged and underrepresented in senior positions.
source: https://grants.nih.gov/grants/guide/notice-files/NOT-OD-20-031.html
Our current analysis reflects the Ginther analysis.
This analysis was useful to me and clearly of interest of many who commented above asking for inclusion of other groups and more detailed information. Hope you follow up with at least some of the requested analyses.
Old people aren’t being funded!!!!!????
Give me a break. Fund more Black scientists.
https://nexus.od.nih.gov/all/wp-content/uploads/2012/02/age-of-R01-investigators.png
Totally agree!
Yes, it is quite possible that implicit bias may reduce funding rates for senior scientists. My hope, and I believe that of NIH, is that a level playing field be available for all groups and that bias toward any group is not present in the review process. Perhaps, avoiding terms like “old people” to describe senior scientists would remove some of the bias toward that group of individuals.
Their funding rates are going up for people over 65, not down. A better question is why are you using a blog post about racism in grant review to talk about ageism?
Why is the generic answer: ‘Our current analysis reflects the “Ginther analysis.’ Can’t someone dissect at what people ask for (or in future ask more questions that can be analysed in a more gradual manner ?)
I am extremely disappointed to find out that Native Hawaiians, American Indians, Alaska Natives PIs (not to mention Pacific Islanders) are NO WHERE in your data set. Instead we have moved from the label of “Other” to “Unknown”.?! Even in the “additional parts of the report” link does not provide any explanation.
We need to understand the why?! And what will be done in response??
Agree that tracking of indigenous populations is an important gap to fill…. Not only the absolute numbers of grants, but trends with time, or noting if there are no trends observable, are critical information in advancing the understanding of needs across the categories of applicants and funding…. Is the problem at level of applications? % success of submissions? —- developing strategies to improve representation will greatly benefit from having the data to make the necessary improvements in the systems. The gap in knowledge of indigenous-specific data to inform appropriate care to reduce disparities would be well served by increasing indigenous research led by indigenous scientists. To make the right decisions to increase that number, understanding if we are still lagging behind in the number of applications, or the % of applications funded would lead to very different strategic interventions. Indigenous populations deserve to have those numbers tracked and accessible
This analysis is specifically designed to replicate the Ginther analysis with more recent data, as the Ginther data are currently over a decade old. There are very clear, strong trends in the disparate funding rates for Black PIs and these disparities have persisted over time. Scientists know what a replication study is and why it is necessary to examine whether trends have changed with newer, updated data. The comments in this thread reflect the ongoing lack of concern in the scientific community about the poor rates of funding for Black PIs, who often study the communities most impacted by disease. It is incredibly disappointing to read yet another comment that basically states “yes we know this, what about [insert other group] that prior data has not shown such striking disparities for, why don’t we run those analyses?” How about we examine and discuss the results of this particular replication study, rather than behave as if this isn’t a major problem?
Although the data reported here are quantitative and, therefore, report directly the magnitude of effects over time, it is poor presentation form not to plot the data on graphs with 0.0 origins for the y axes. As currently plotted with arbitrary none-0.0 origin y axes, the magnitude of effects over time is visually exaggerated; and as such, may mislead many readers.
A much greater deficiency of this report to the NIH research community is the lack of a quantitative assessment of the statistical confidence of the data and the effects concluded from them. No error bar estimates of variance are reported; and no analyses of the statistical significance of the trends represented. The poor quality of this report, lacking this essential information for assessing the confidence of the presented conclusions, is cause for great concern that the responsible parties have little regard for the stated effort.
The discussion provided by the report does not consider what factors MIGHT be responsible for the reported recent increases in funding rates for investigators defined by underrepresented groupings. One issue of importance is whether an increase in the number applicants during the noted periods occurs with intrinsic synergistic effects of greater inclusion in the grant application process (e.g., increase in applicants with better preparation, increased training opportunities, better general support engagement, access to additional research resources, increased awareness to discriminatory practices, increased attention to reducing discriminatory practices) and/or were there concurrent independent developments (same as in the preceding list) that were contributing factors. The data might also be interrogated to learn if increases in the number of over-represented investigator applicants is also associated with statistically significant increases in funding rate.
A final thought is that, if the data do have reasonable statistical confidence and there is sufficient statistical power, it would be interest to look at the distribution of successful underrepresented investigators applicants with respect to the type of their hosting institution (e.g., HBCU, state universities, small private universities, large private universities, medical schools, or federal research agencies) during the period of increase in funding rate. Such an analysis could be informative about continuing barriers and effective solutions.
It would be interesting to see funding rates for male v.s. female applicants for these categories, or can these data be assessed elsewhere?
It would be interesting to see funding rates for male v.s. female applicants for these categories, or can these data be assessed elsewhere?
Why is the generic answer: ‘Our current analysis reflects the “Ginther analysis.’ Can’t someone dissect at what people ask for (or in future ask more questions that can be analysed in a more gradual manner ?
The rate of success for young faculty is slim and based on the many grants I sent for R21 and R01 funding (4 in 2022 alone) and the consultations with other faculty, the reviews are constantly biased and done by senior PIs… no doubt that old and established PIs tend to give higher scores (4 to 7) just because you are not in their circle. The other disturbing fact is that in resubmissions, even if all points made by the reviewers are satisfied, the result is still “not funded”… I find this wrong and damaging… it’s unfair and again, WRONG!!!! No wonder that young faculty are leaving academia at astonishing rates! I have also been observing that over the past 4-5 years, PhD students don’t even consider academia as a career path. If established PIs go back to the bench to do western blots and qRT-PCR, ask yourself some questions….
The NIH Notice of Interest in Diversity (20-031) also notes Individuals from Disadvantaged Backgrounds. I can speculate as to why this group is never counted but I would prefer to hear the official NIH position. Is the rationale the same as for individuals with Disabilities?