
15 Comments
Since launching in 2017, NIH’s Next Generation Researchers Initiative (NGRI) is continuing to address longstanding challenges faced by researchers trying to embark upon and sustain independent research careers as well as to promote the stability and diversity of the biomedical research workforce. We have focused on early-stage investigators (ESIs), a group we recognize as being hard hit by a hypercompetitive funding environment along with pandemic shutdowns. Today, we are sharing data on our progress towards increased support for ESIs and other targeted groups.
We define ESIs as those who are within 10 years of their terminal degree or completion of clinical training and who have not yet been awarded a substantial NIH grant, including R01-equivalent grants or more. Note, there are certain smaller grants that an investigator can receive while still retaining their ESI status. New Investigators Non-ESI are new to the NIH system but more than 10 years beyond their terminal degree or completion of clinical training. Another critical group of interest are “At-Risk” investigators, who are those who have received a prior substantial NIH award but, as best we can tell, will have no funding the following fiscal year if they are not successful in securing a competing award this year. “Established” investigators have received a prior substantial NIH award and will have NIH funding the following fiscal year irrespective of the outcome of this year’s competitions. Please note that throughout this post, the people we refer to are designated by their institutions as Principal Investigators; institutions, not scientists, are the applicants and recipients of awards (see here).
We have seen steady growth in the number of ESIs supported by NIH, increasing from 978 in FY 2016 (before NGRI started) to 1,412 in FY 2020. As seen in Table 1 below, this positive trend was also observed for at-risk investigators (see this blog for more).
Table 1: Investigators Funded by Career Stage (using Type 1 R01-equivalent Data)
| ESIs | New, Not Early | At-Risk Investigators | Established | |||||||||
|---|---|---|---|---|---|---|---|---|---|---|---|---|
| Fiscal year | # of Applicants | # of Awardees | Percent change | # of Applicants | # of Awardees | Percent change | # of Applicants | # of Awardees | Percent change | # of Applicants | # of Awardees | Percent Change |
| 2016 | 4,149 | 978 | N/A | 5,862 | 942 | N/A | 7,687 | 1,664 | N/A | 7,294 | 2,086 | N/A |
| 2017 | 4,286 | 1,045 | 6.90% | 6,148 | 916 | -2.80% | 7,629 | 1,630 | -2.00% | 7,889 | 2,255 | 8.10% |
| 2018 | 4,720 | 1,287 | 23.20% | 6,745 | 1,215 | 32.60% | 7,948 | 2,153 | 32.10% | 9,048 | 2,992 | 32.70% |
| 2019 | 4,746 | 1,316 | 2.30% | 7,193 | 1,295 | 6.60% | 7,916 | 2,163 | 0.50% | 9,614 | 3,007 | 0.50% |
| 2020 | 5,106 | 1,412 | 7.30% | 7,323 | 1,301 | 0.50% | 7,821 | 2,108 | -2.50% | 10,140 | 3,340 | 11.10% |
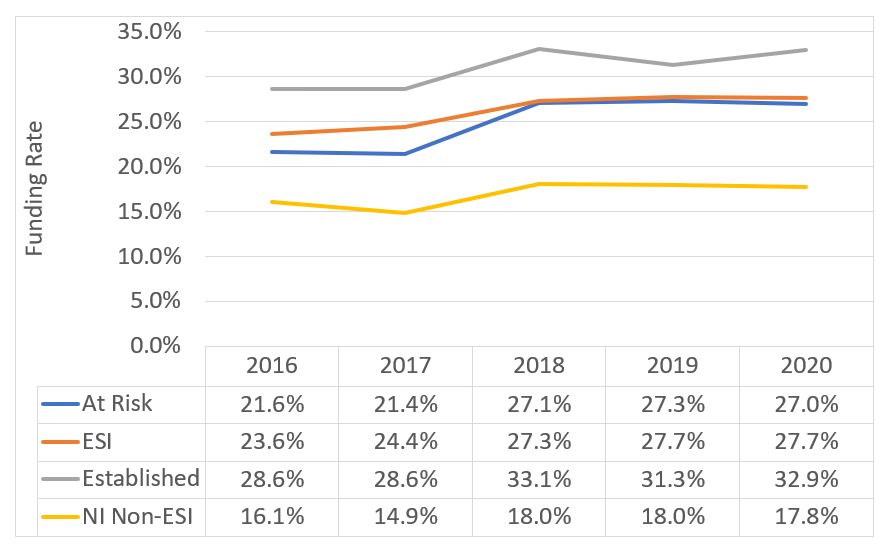
Figure 1 shows the funding rate, which is the percentage of awardees funded in each fiscal year as a percentage of the total number of investigators who requested funding. The data show that the funding rate has increased for all groups since 2016. In particular, the funding rate has steadily increased for ESIs in FY 2020 to 27.7 percent, up from 23.6 percent in FY 2016. Funding rates for at-risk investigators also increased from 21.6 percent in FY 2016 to 27.0 percent in FY 2020.
Figure 1: Funding Rate by Fiscal Year and Investigator Career Stage
We looked at the outcomes of FY 2020 Type 1 R01-equivalent applicants according to career stage and broken down by voluntarily self-disclosed investigator demographics, including gender (Table 2), race (Table 3), and ethnicity (Table 4). NGRI’s emphasis on diversity is an important component of NIH’s overall interest in enhancing workforce diversity (see also these posts from January 2021 and November 2019). The column “Discussed” refers to the number of applicants who saw at least one application in which they were designated as principal investigator and made it to the discussion stage of peer review. The “Discussion Rate” is, like the Funding Rate a person-based metric, and is calculated as the percent of applicants (actually people designated as PI’s on an application) who had at least one application make it to the discussion stage of peer review.
As Table 2 indicates, discussion and funding rates in FY 2020 are higher for women in the At Risk and New Not Early groups, but not for the Early Stage and Established groups. Women comprise a greater proportion of Early-Stage Investigator applicants (46%) than any of the other groups including New Investigators, At Risk Investigators and Established Investigators (e.g., women comprise only 30% of Established investigators).
Table 2: FY 2020 Demographic Type 1 R01-equivalent Data by Gender
| Career Stage | Demographic Characteristic | Applicants | Discussed | Awardees | Discussion Rate | Funding Rate |
|---|---|---|---|---|---|---|
| ESI | Female | 2241 | 1343 | 605 | 59.90% | 27.00% |
| Male | 2673 | 1650 | 753 | 61.70% | 28.20% | |
| Early, Not New | Female | 2497 | 1341 | 490 | 53.70% | 19.60% |
| Male | 3684 | 1923 | 654 | 52.20% | 17.80% | |
| At Risk | Female | 2354 | 1429 | 661 | 60.70% | 28.10% |
| Male | 5388 | 3092 | 1425 | 57.40% | 26.40% | |
| Established | Female | 3048 | 2053 | 981 | 67.40% | 32.20% |
| Male | 6961 | 4879 | 2321 | 70.10% | 33.30% |
The discussion rate for the Black/African American at-risk investigator group was higher in FY 2020 than for Asians and Whites (Table 3). Black/African Americans in the New, Not Early group had a higher funding rate compared to the two other race categories. That said, the overall number of Black/African American investigators across all groups remained markedly lower than their Asian and white counterparts. Black/African Americans comprised 3.9% of Early-Stage Investigators compared to only 1.5% of Established Investigators.
Table 3: FY 2020 Demographic Type 1 R01-equivalent Data by Race
| Career Stage | Demographic Characteristic | Applicants | Discussed | Awardees | Discussion Rate | Funding Rate |
|---|---|---|---|---|---|---|
| Early | Asian | 1289 | 776 | 345 | 60.20% | 26.80% |
| Black or African American | 179 | 88 | 37 | 49.20% | 20.70% | |
| White | 3108 | 1922 | 882 | 61.80% | 28.40% | |
| New, Not Early | Asian | 1712 | 878 | 285 | 51.30% | 16.60% |
| Black or African American | 237 | 109 | 50 | 46.00% | 21.10% | |
| White | 3618 | 1992 | 724 | 55.10% | 20.00% | |
| At Risk | Asian | 1872 | 1058 | 475 | 56.50% | 25.40% |
| Black or African American | 123 | 73 | 32 | 59.30% | 26.00% | |
| White | 5283 | 3122 | 1474 | 59.10% | 27.90% | |
| Established | Asian | 2621 | 1786 | 811 | 68.10% | 30.90% |
| Black or African American | 138 | 91 | 37 | 65.90% | 26.80% | |
| White | 6658 | 4654 | 2267 | 69.90% | 34.00% |
Table 4 shows that the FY 2020 discussion and funding rates for researchers who are not Hispanic/Latino are better for all career stage groups compared to those in the Hispanic group in FY 2020.
Table 4: FY 2020 Demographic Type 1 R01-equivalent Data by Ethnicity
| Career Stage | Demographic Characteristic | Applicants | Discussed | Awardees | Discussion Rate | Funding Rate |
|---|---|---|---|---|---|---|
| Early | Hispanic or Latino | 289 | 172 | 77 | 59.50% | 26.60% |
| Not Hispanic or Latino | 4453 | 2719 | 1234 | 61.10% | 27.70% | |
| New, Not Early | Hispanic or Latino | 413 | 194 | 75 | 47.00% | 18.20% |
| Not Hispanic or Latino | 5105 | 2764 | 983 | 54.10% | 19.30% | |
| At Risk | Hispanic or Latino | 326 | 180 | 89 | 55.20% | 27.30% |
| Not Hispanic or Latino | 6699 | 3946 | 1835 | 58.90% | 27.40% | |
| Established | Hispanic or Latino | 439 | 292 | 137 | 66.50% | 31.20% |
| Not Hispanic or Latino | 8843 | 6134 | 2931 | 69.40% | 33.10% |
The initial funding and aggregate demographic data presented here are helping us better assess the impact of NGRI efforts on enhancing progress to an independent career and promoting diversity. Moving forward, we remain strongly committed to the goals of NGRI to fund more early-career investigators, retain meritorious at-risk scientists, and enhance the diversity of the biomedical research workforce. We will also continue reviewing recommendations, such as those outlined by the Advisory Committee to the NIH Director and National Academies, when designing, testing, implementing, and evaluating future policies and programs to enhance the success of the next generation of talented biomedical researchers.
I would like to thank my colleagues within the NIH Office of Extramural Research’s Division of Statistical Analysis and Reporting as well as the Division of the Biomedical Research Workforce for their work presented here.
If you look instead at the percent of awards going to these different groups, these numbers tell a different story. The percent of awards going to ESI and NI has remained constant, while the percent of awards going to At-Risk has decreased. The percent of awards going to Established investigators has increased.
In reality there is one pot of money, and an increasing fraction of it is going to Established investigators. The charts in the story LOOK good because the percent of At-Risk applicants has decreased, maybe because they were lost due to lack of funding.
ESI New At-Risk Established
% of Apl % of Awd % of Apl % of Awd % of Apl % of Awd % of Apl % of Awd
2016 17% 17% 23% 17% 31% 29% 29% 37%
2017 17% 18% 24% 16% 29% 28% 30% 39%
2018 17% 17% 24% 16% 28% 28% 32% 39%
2019 16% 17% 24% 17% 27% 28% 33% 39%
2020 17% 17% 24% 16% 26% 26% 33% 41%
This is a great point. A picture of your table might be helpful. Current formatting is difficult to read.
Will the NGRI result in sustained funding for it’s recipients? What will be the success rate of former ESI/NI recipients once they lose that advantage and have to compete with the larger pool of applicants? That will be the ultimate metric of success for the initiative. Time will tell, but anecdotally, I am seeing a lot of one and dones.
Excellent question that i would like to know, too.
any data on applicants and funded investigators belonging to sexual and gender minorities or lgbtqia+ communities?
How is sexual orientation relevant to NIH funding? I don’t think these factors play any role in grant review and funding decisions. It sounds strange to me that if anyone would ask for an enhanced funding rate because of sexual orientation. My comment sounds politically incorrect, but really I don’t understand the logic. Maybe it is because I never lived in the deep south.
Btw, the overall number of Black/African American investigators across all groups remained markedly lower. This cannot be fixed just by NIH. This country had a systematic slavery system and it has been unfair to Black/African Americans. The only way to fix this is to let the country invest more in the African American community. Build better schools and subsidize kids from disadvantageous backgrounds for college and postgraduate education. Unfortunately, none of our politicians wants to fix the real problem.
We do not collect the demographic data you requested.
Are there going to be any programs announced for New Investigator Non ESI group? Seems like that is the group with lowest funding rates
How are you defining R01 equivalents? PPG project? Does it mix grants that are funded by the payline set by individual institutes vs. those that are “rescued” at the PO level (funded with a score above the payline)? The evaluation of traditional R01s, MPI/PPG and “Select Pay” or rescue are all evaluated with differing degrees of objectivity. Are any of these groups disproportionate hurt/helped if you look at only what a panel of reasonably objective reviewers assign as fundable based on the published payline?
R01-equivalent grants are defined here (and we added this link to the post as well): https://grants.nih.gov/grants/glossary.htm#R01EquivalentGrant. The analysis presented in this post includes all grants funded, regardless of an Institute/Center’s payline. We have not broken these data out by those that fell below the payline vs select pay. For some available NIH-wide grants data related to paylines, please check out this post: https://nexus.od.nih.gov/all/2019/12/23/data-are-available-on-nih-funding-plans/
Great analysis. Thank you. Is there any analysis on R01-equivalent grants productivity (papers, paper citations, papers in IF>5 journals, patents, software, renewal rates etc) among different ethnic groups?
These numbers are helpful to see, thank you. It seems that it would be consistent with the mission of this initiative to include recently completed K awardees in the definition of ESI. Career development awards represent a significant NIH investment to facilitate an independent research career; however, if that award was received later than 5 years post degree then by definition, the K recipient is not eligible as an ESI and has only NI status. It seems as though K awardees should also be specifically supported by these efforts as NI appear to be the most disadvantaged in terms of securing funding. The K to R is a vulnerable transition and should not be further impacted by time to K award.
K awardees are favored for faculty positions, and favored by US citizen status. Do they need even more help than that?
It would be helpful to see significance tests, overall for the 5 year period, and for the period 2017-2018, which is the year we see increases across the categories. Why do rises in funding rates for the most part stop after 2018? Regarding data by racial groups, 1) very difficult to interpret for Black/African American because of the low numbers. More helpful would be to see changes in numbers of Black/AA applicants, awardees, funding rates, from 2016-2020, as well as proportional changes in career stage. Extremely interesting to see funding rates of At-Risk and Established Black/AA investigators equal to or greater than At-Risk and Established White investigators. Does this suggest that Black/AA are submitting more Type 2 applications, and/or more resubmissions, and/or that receiving a first R01 award is a huge motivator (positive risk factor) for refunding of Black/AA investigators? Regarding Discussion rates, this is misleading, because it is very much tied to the size (numbers of applications) of study group. A study group with only 6 applications that reviews 4, has a discussion rate of 67%.
Take a look at New not ESI Asians: 16% success which is the lowest rate. This should be split into males and females to see if there is an extra burden for New not ESI Asian females. Foreigners are most likely to be New not ESI (because we are no longer ESI by the time we’ve completed the required postdoc years to reach a faculty position). Asia contains half of the world population, does Asian mean South Asian or East Asian?