
4 Comments
I often hear concerns raised that NIH does not fund enough basic research, or enough applied research for that matter. Basically, the concerns center around what is the correct balance. It is an important point to consider, as a better understanding of these wider research areas can shed light on NIH’s approach to higher-level priority setting and funding decisions.
To get at this question, we leveraged the Research, Condition, and Disease Classification (RCDC) system and looked at trends in NIH funding of these areas between fiscal years (FYs) 2009 and 2022. For the purpose of this analysis, we used projects reported in the Clinical and Translational RCDC categories to define “applied” research. Projects that were not reported in the Clinical and Translational categories were used to define “basic” research. Projects in the “applied” and “basic” groupings align with the NIH definitions for basic, clinical, translational research. RCDC categories are validated by subject matter experts and have accuracy of more than 90%. Additionally, the results from this basic and applied analysis have also been validated by several ICs within their portfolio. This blog explains more about the RCDC process.
Our analysis included research project grants, research center grants, other research grants, as well as subprojects funded through traditional appropriations. Research funded through supplemental appropriations, like the American Recovery and Reinvestment Act (ARRA) of 2009 and COVID-19 funds, were included too. All dollar values were adjusted for inflation according to the Biomedical Research Price and Development Index (BRDPI) with FY2022 as the reference year (see this blog for more on BRDPI).
Table 1 shows characteristics of projects/subprojects according to research type for FY2022. Note that the percentages shown are row percentages. As might be expected:
- Basic projects are more likely to be funded through Research Project Grants while translational and clinical projects are more likely to be funded through Research Centers.
- Projects that are “Animal Only” or “Neither Human Nor Animal” are more likely to be Basic.
- Basic projects are less likely to be multi-PI than other translational or clinical projects.
- Costs are highly skewed (i.e. the mean cost is greater than the median cost); translational and clinical projects are more expensive (and more skewed in cost distribution).
Table 1: FY2022 Project Characteristics According to Research Type. Note that percentages shown are row percentages.
| Characteristic | Basic | Translational | Translational and Clinical | Clinical | |
| Total N (%) | 33170 (49.4) | 6772 (10.1) | 12622 (18.8) | 14559 (21.7) | |
| Mechanism Code | RP | 26007 (53.5) | 4592 (9.4) | 7854 (16.2) | 10165 (20.9) |
| RC | 3805 (41.5) | 1640 (17.9) | 2188 (23.8) | 1543 (16.8) | |
| OR | 3358 (36.0) | 540 (5.8) | 2580 (27.7) | 2851 (30.6) | |
| Human, Animal Research | Human Only | 5020 (17.6) | 1719 (6.0) | 10644 (37.4) | 11103 (39.0) |
| Animal Only | 16338 (81.3) | 3284 (16.3) | 115 (0.6) | 359 (1.8) | |
| Neither Human Nor Animal | 10064 (85.7) | 1196 (10.2) | 179 (1.5) | 298 (2.5) | |
| Human and Animal | 1748 (25.7) | 573 (8.4) | 1684 (24.8) | 2799 (41.1) | |
| More than One PI | 5668 (38.8) | 1339 (9.2) | 3591 (24.6) | 3999 (27.4) | |
| Total Costs ($Thousands) | Median (IQR) | 372.5 (205.8 to 494.0) | 358.7 (182.3 to 538.5) | 349.4 (171.5 to 640.8) | 370.3 (176.5 to 615.0) |
| Total Costs ($Thousands) | Mean (SD) | 400.0 (396.6) | 426.7 (540.4) | 570.9 (1167.3) | 467.3 (630.4) |
Figure 1 shows trends in the numbers of projects (or subprojects) including Research Project Grants, Research Centers, and Other Research. Panel A is the Number of Projects, while Panel B is the Percent of Projects. Both basic and applied research trended downward between FYs 2009 to 2014, but increase thereafter. Around FY 2018, the percentages for both basic and applied research were similar.
Figure 1: Trends in Basic and applied research: FYs 2009 to 2022
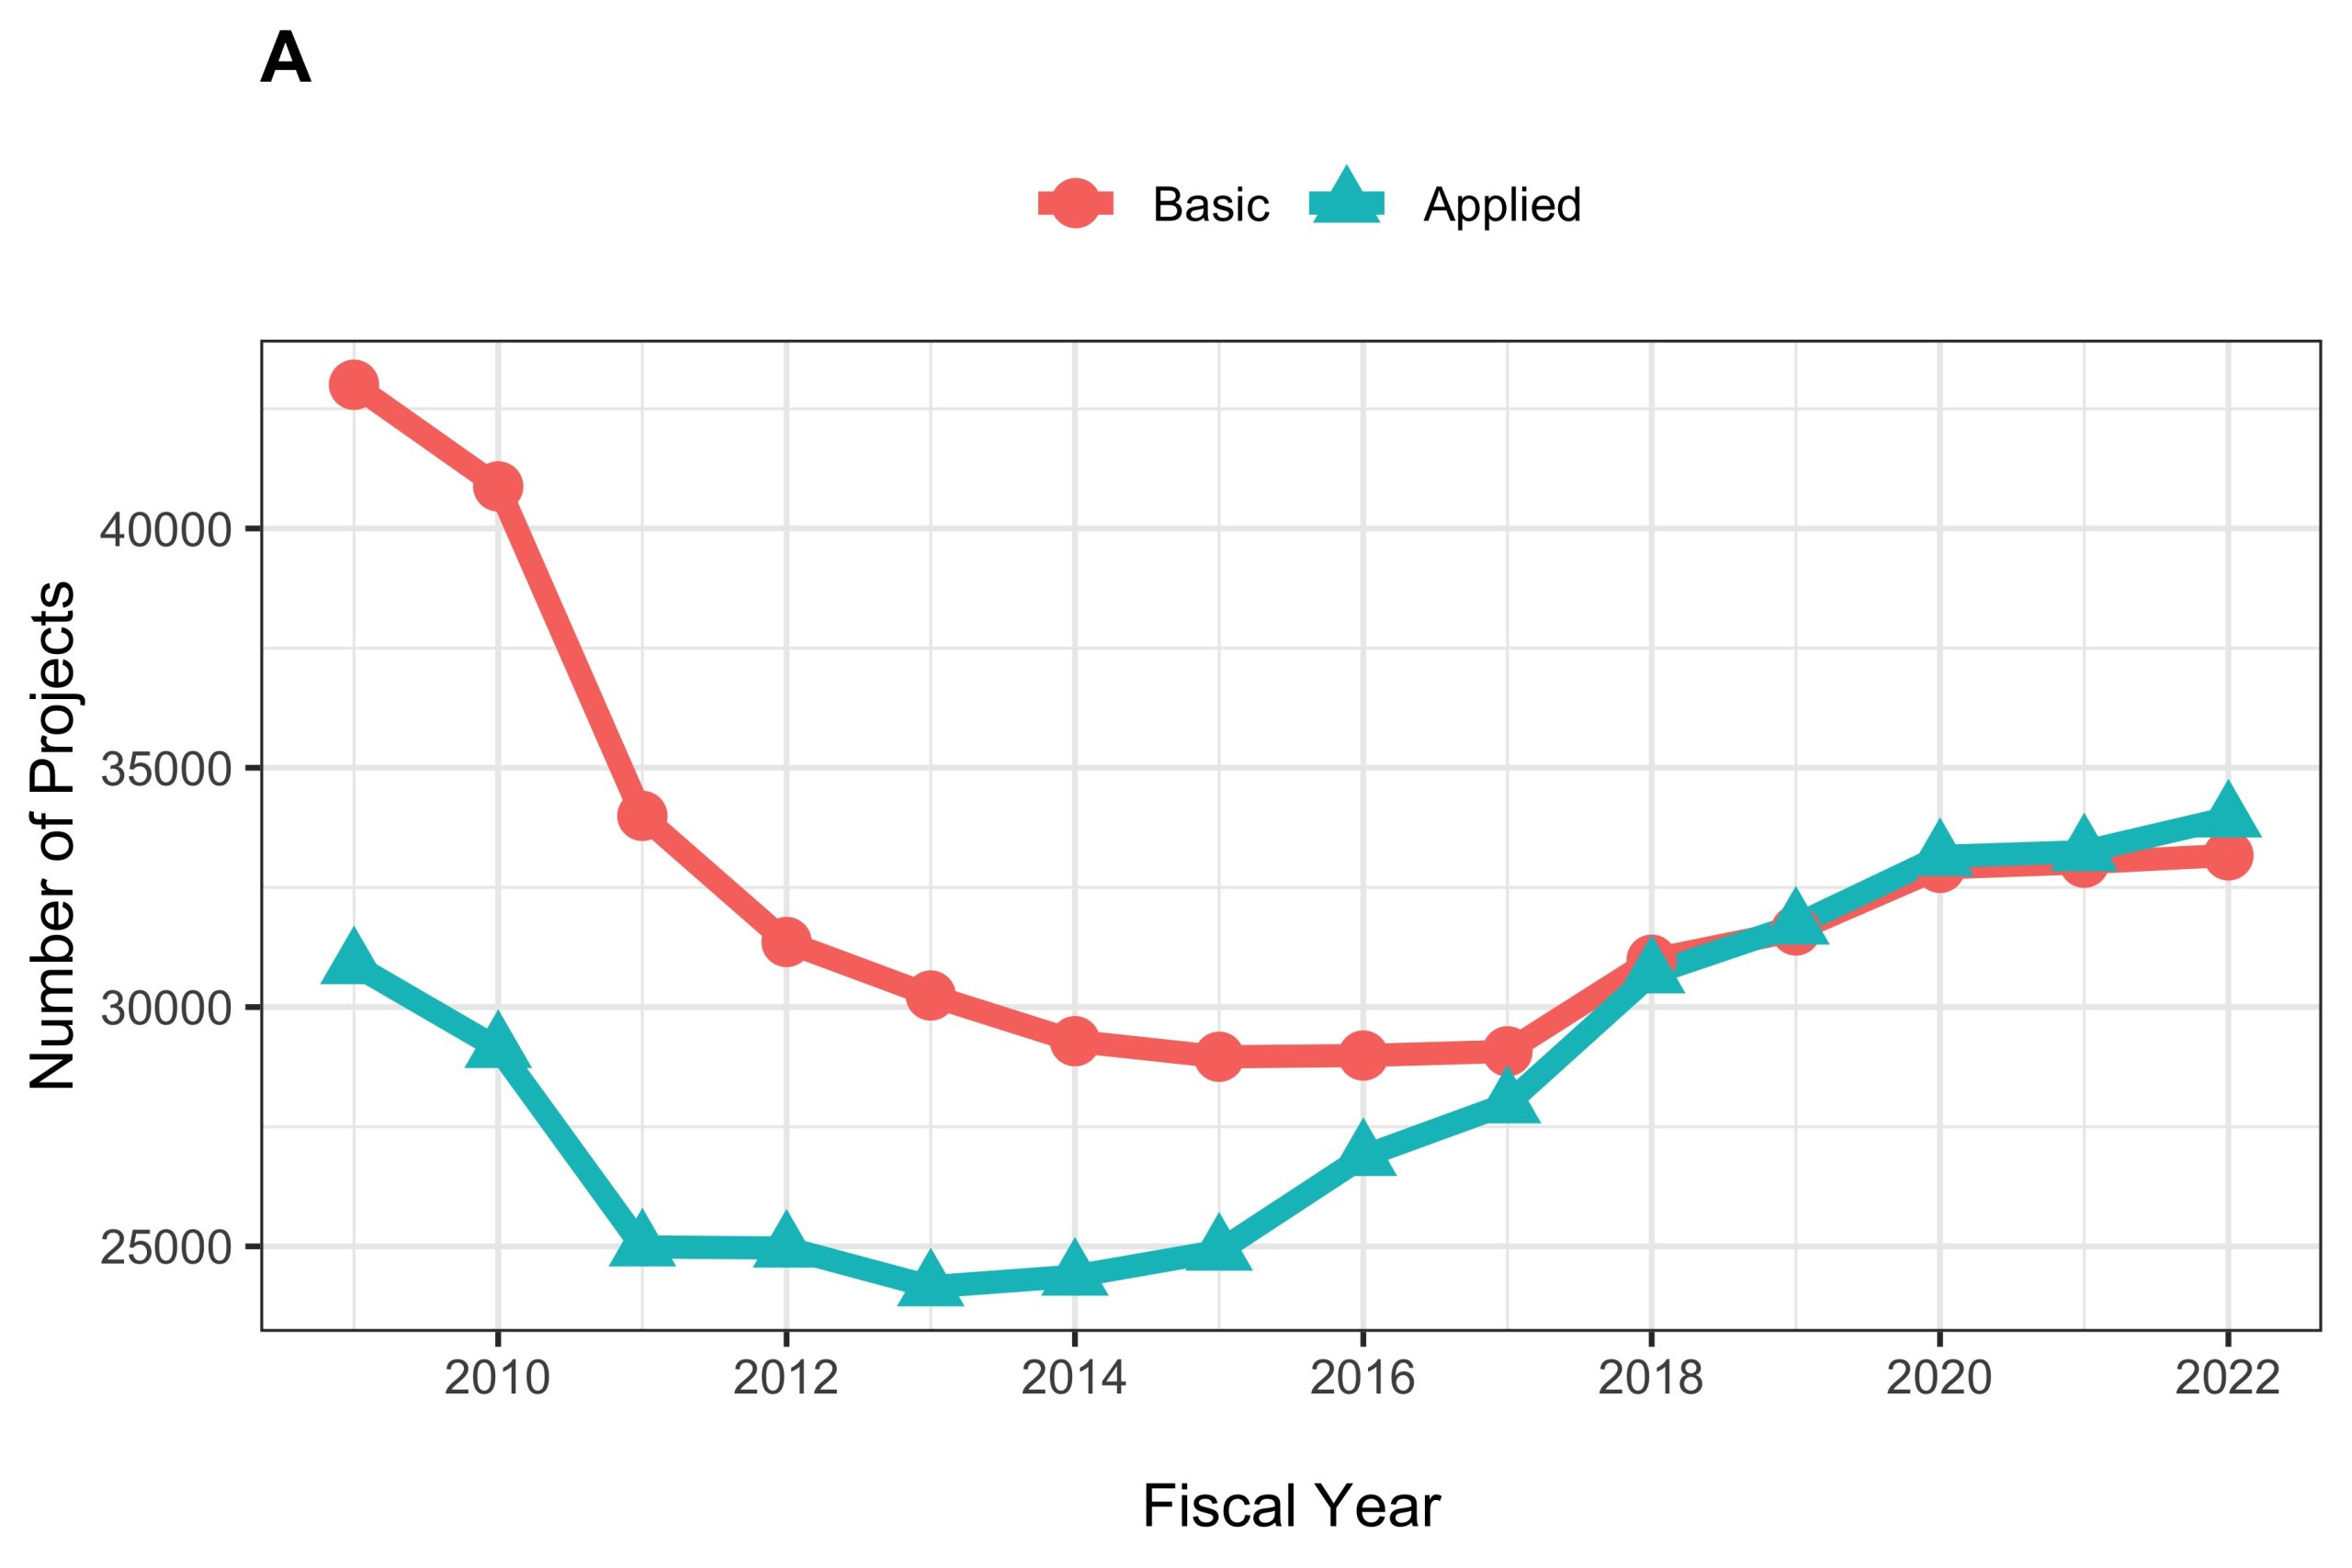
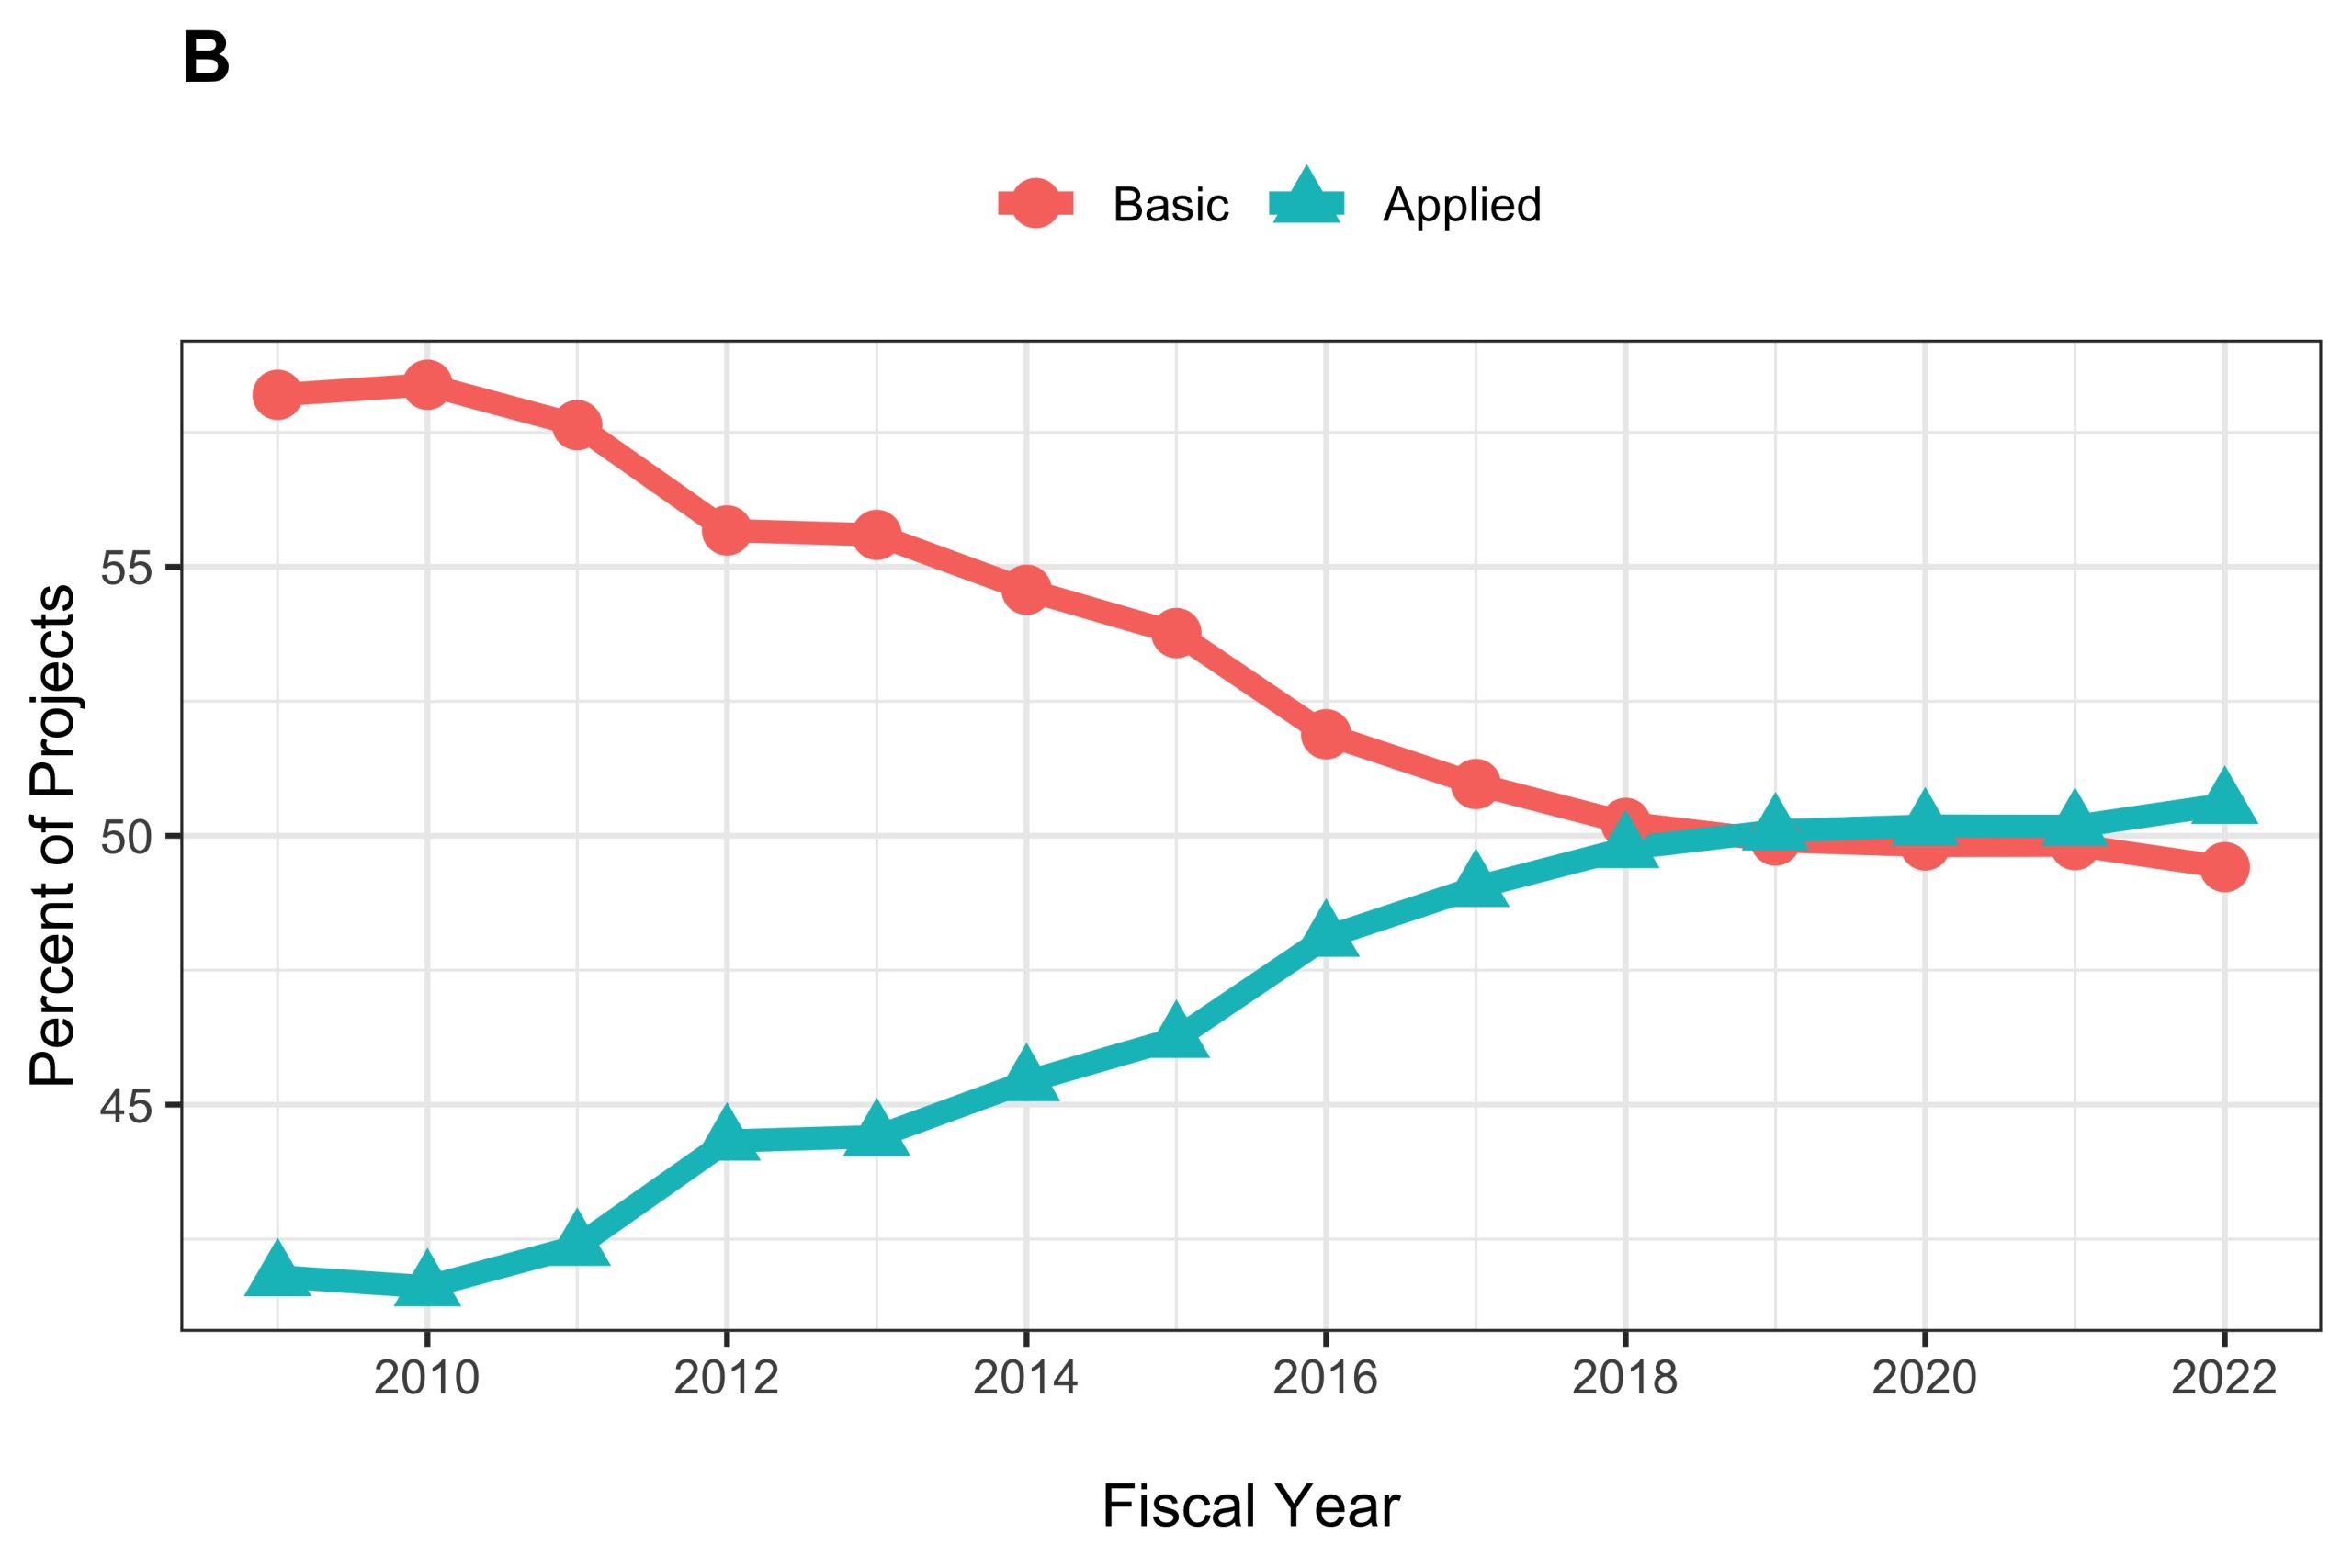
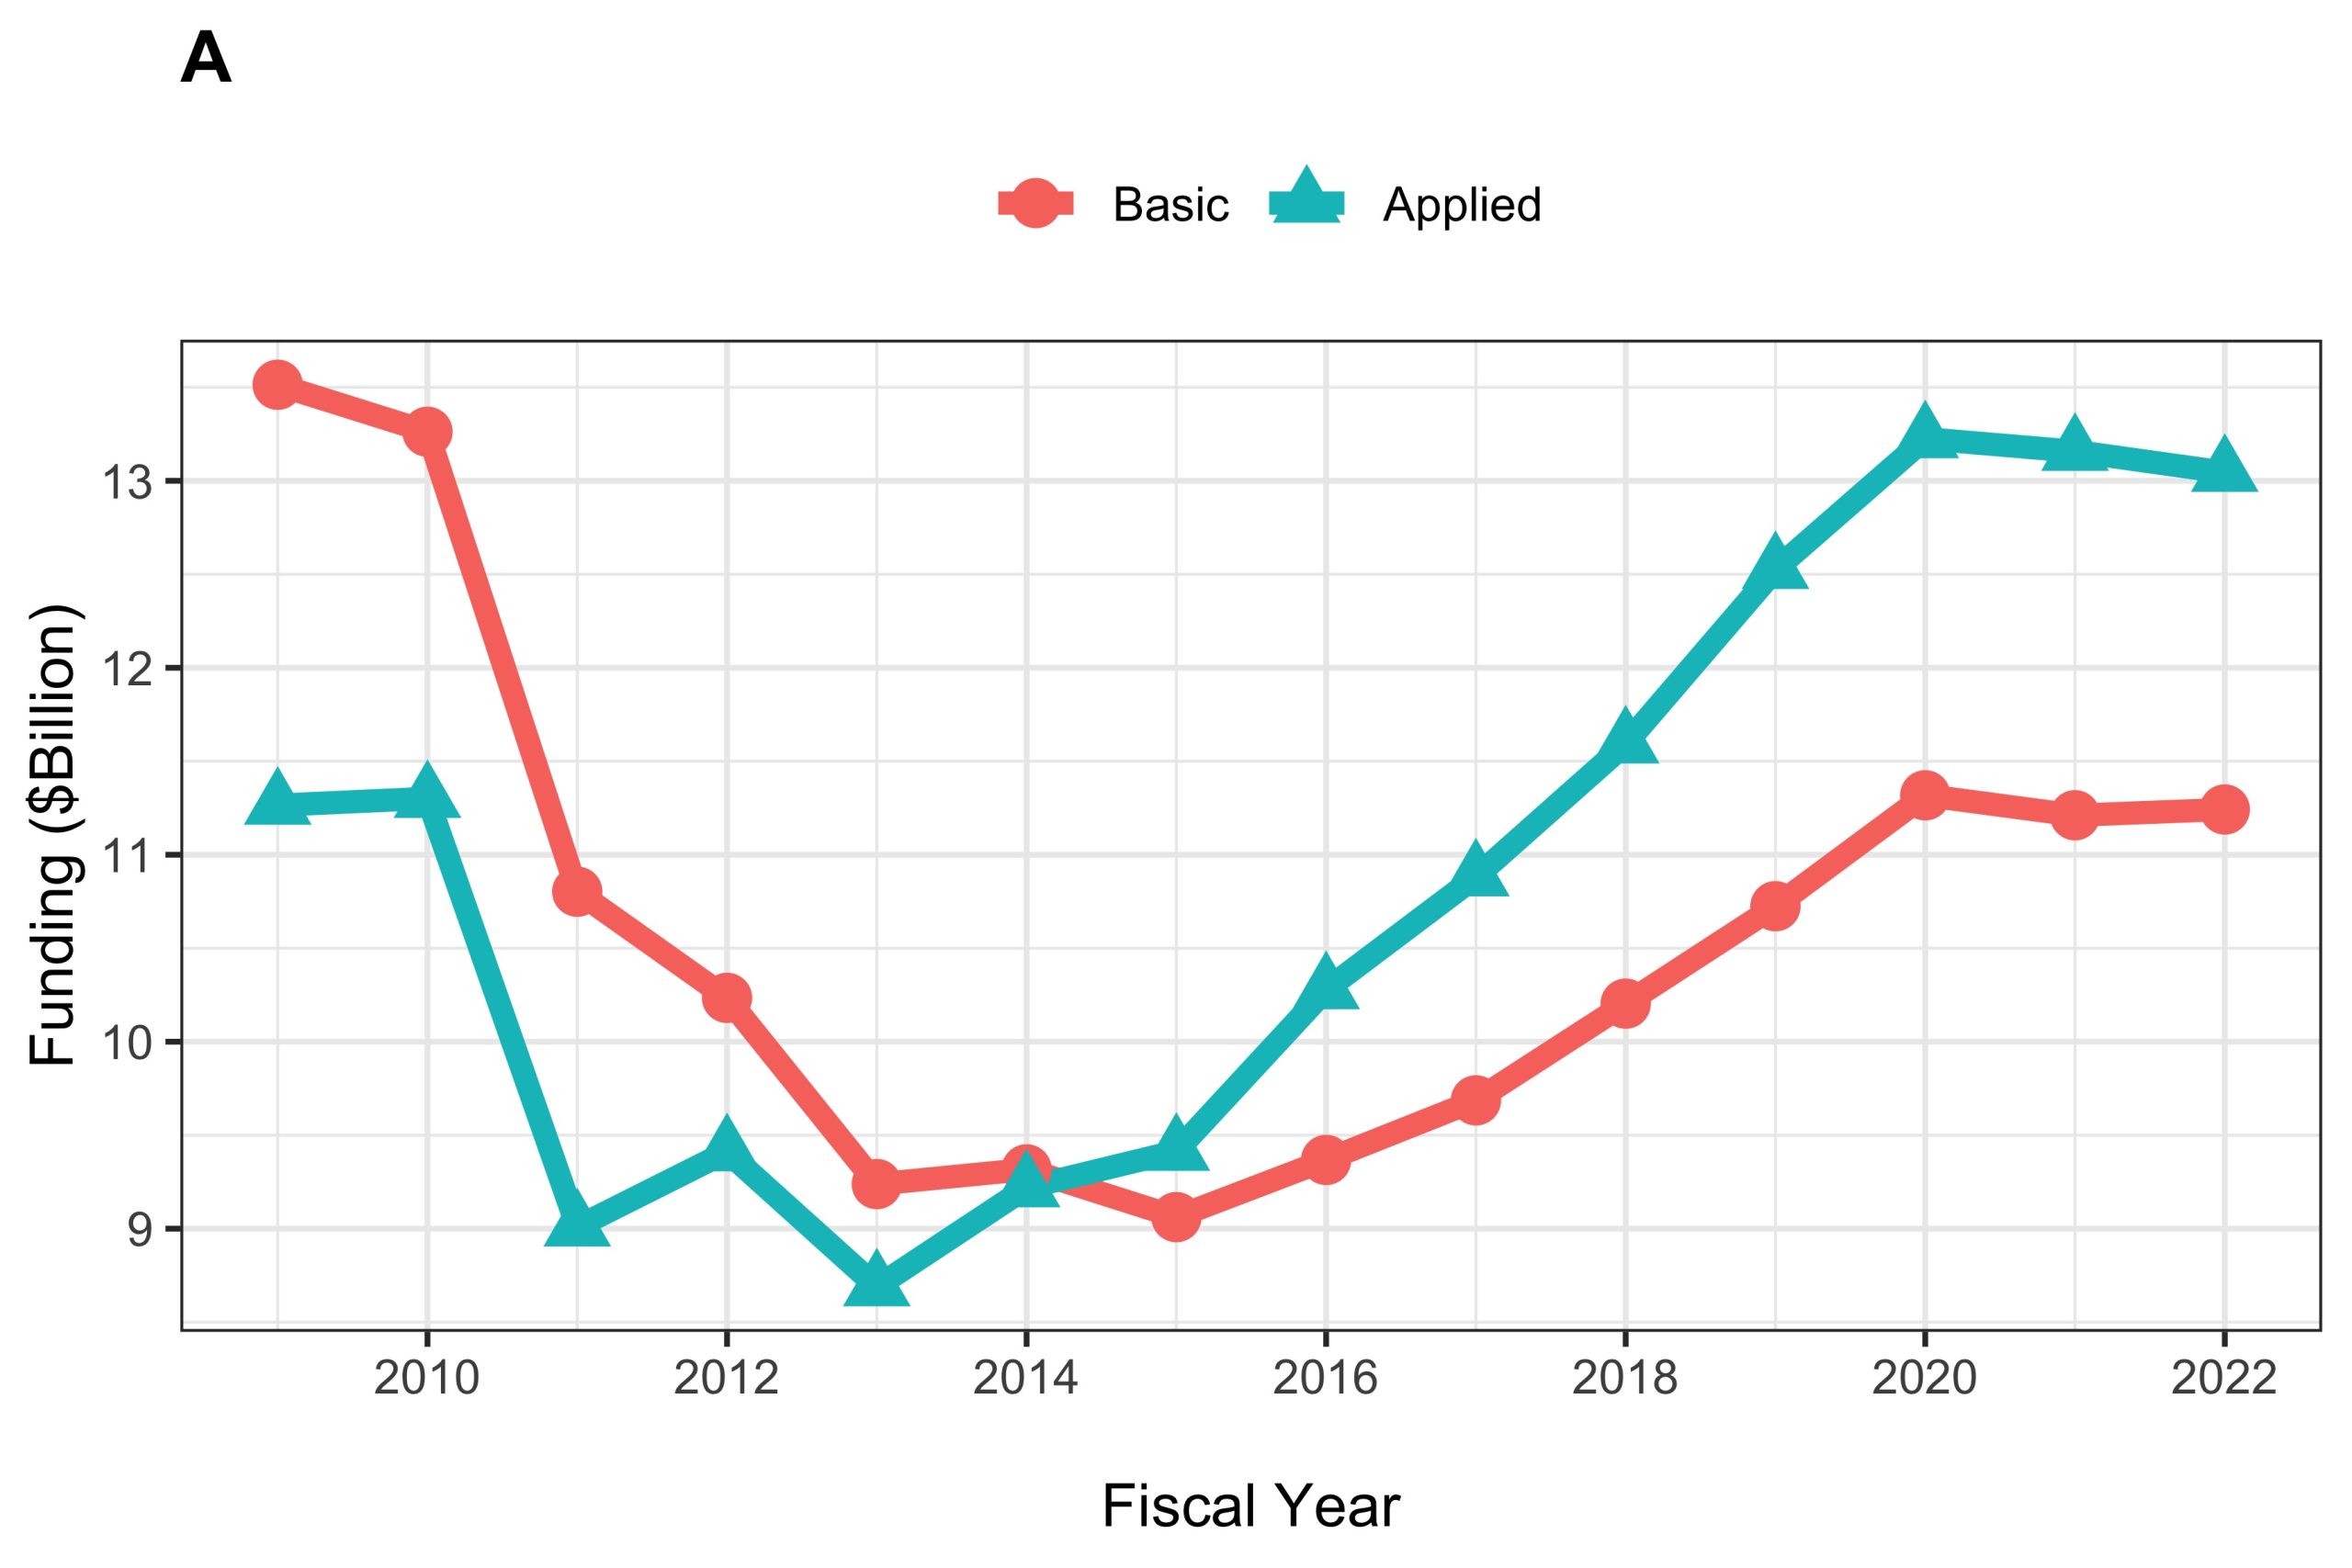
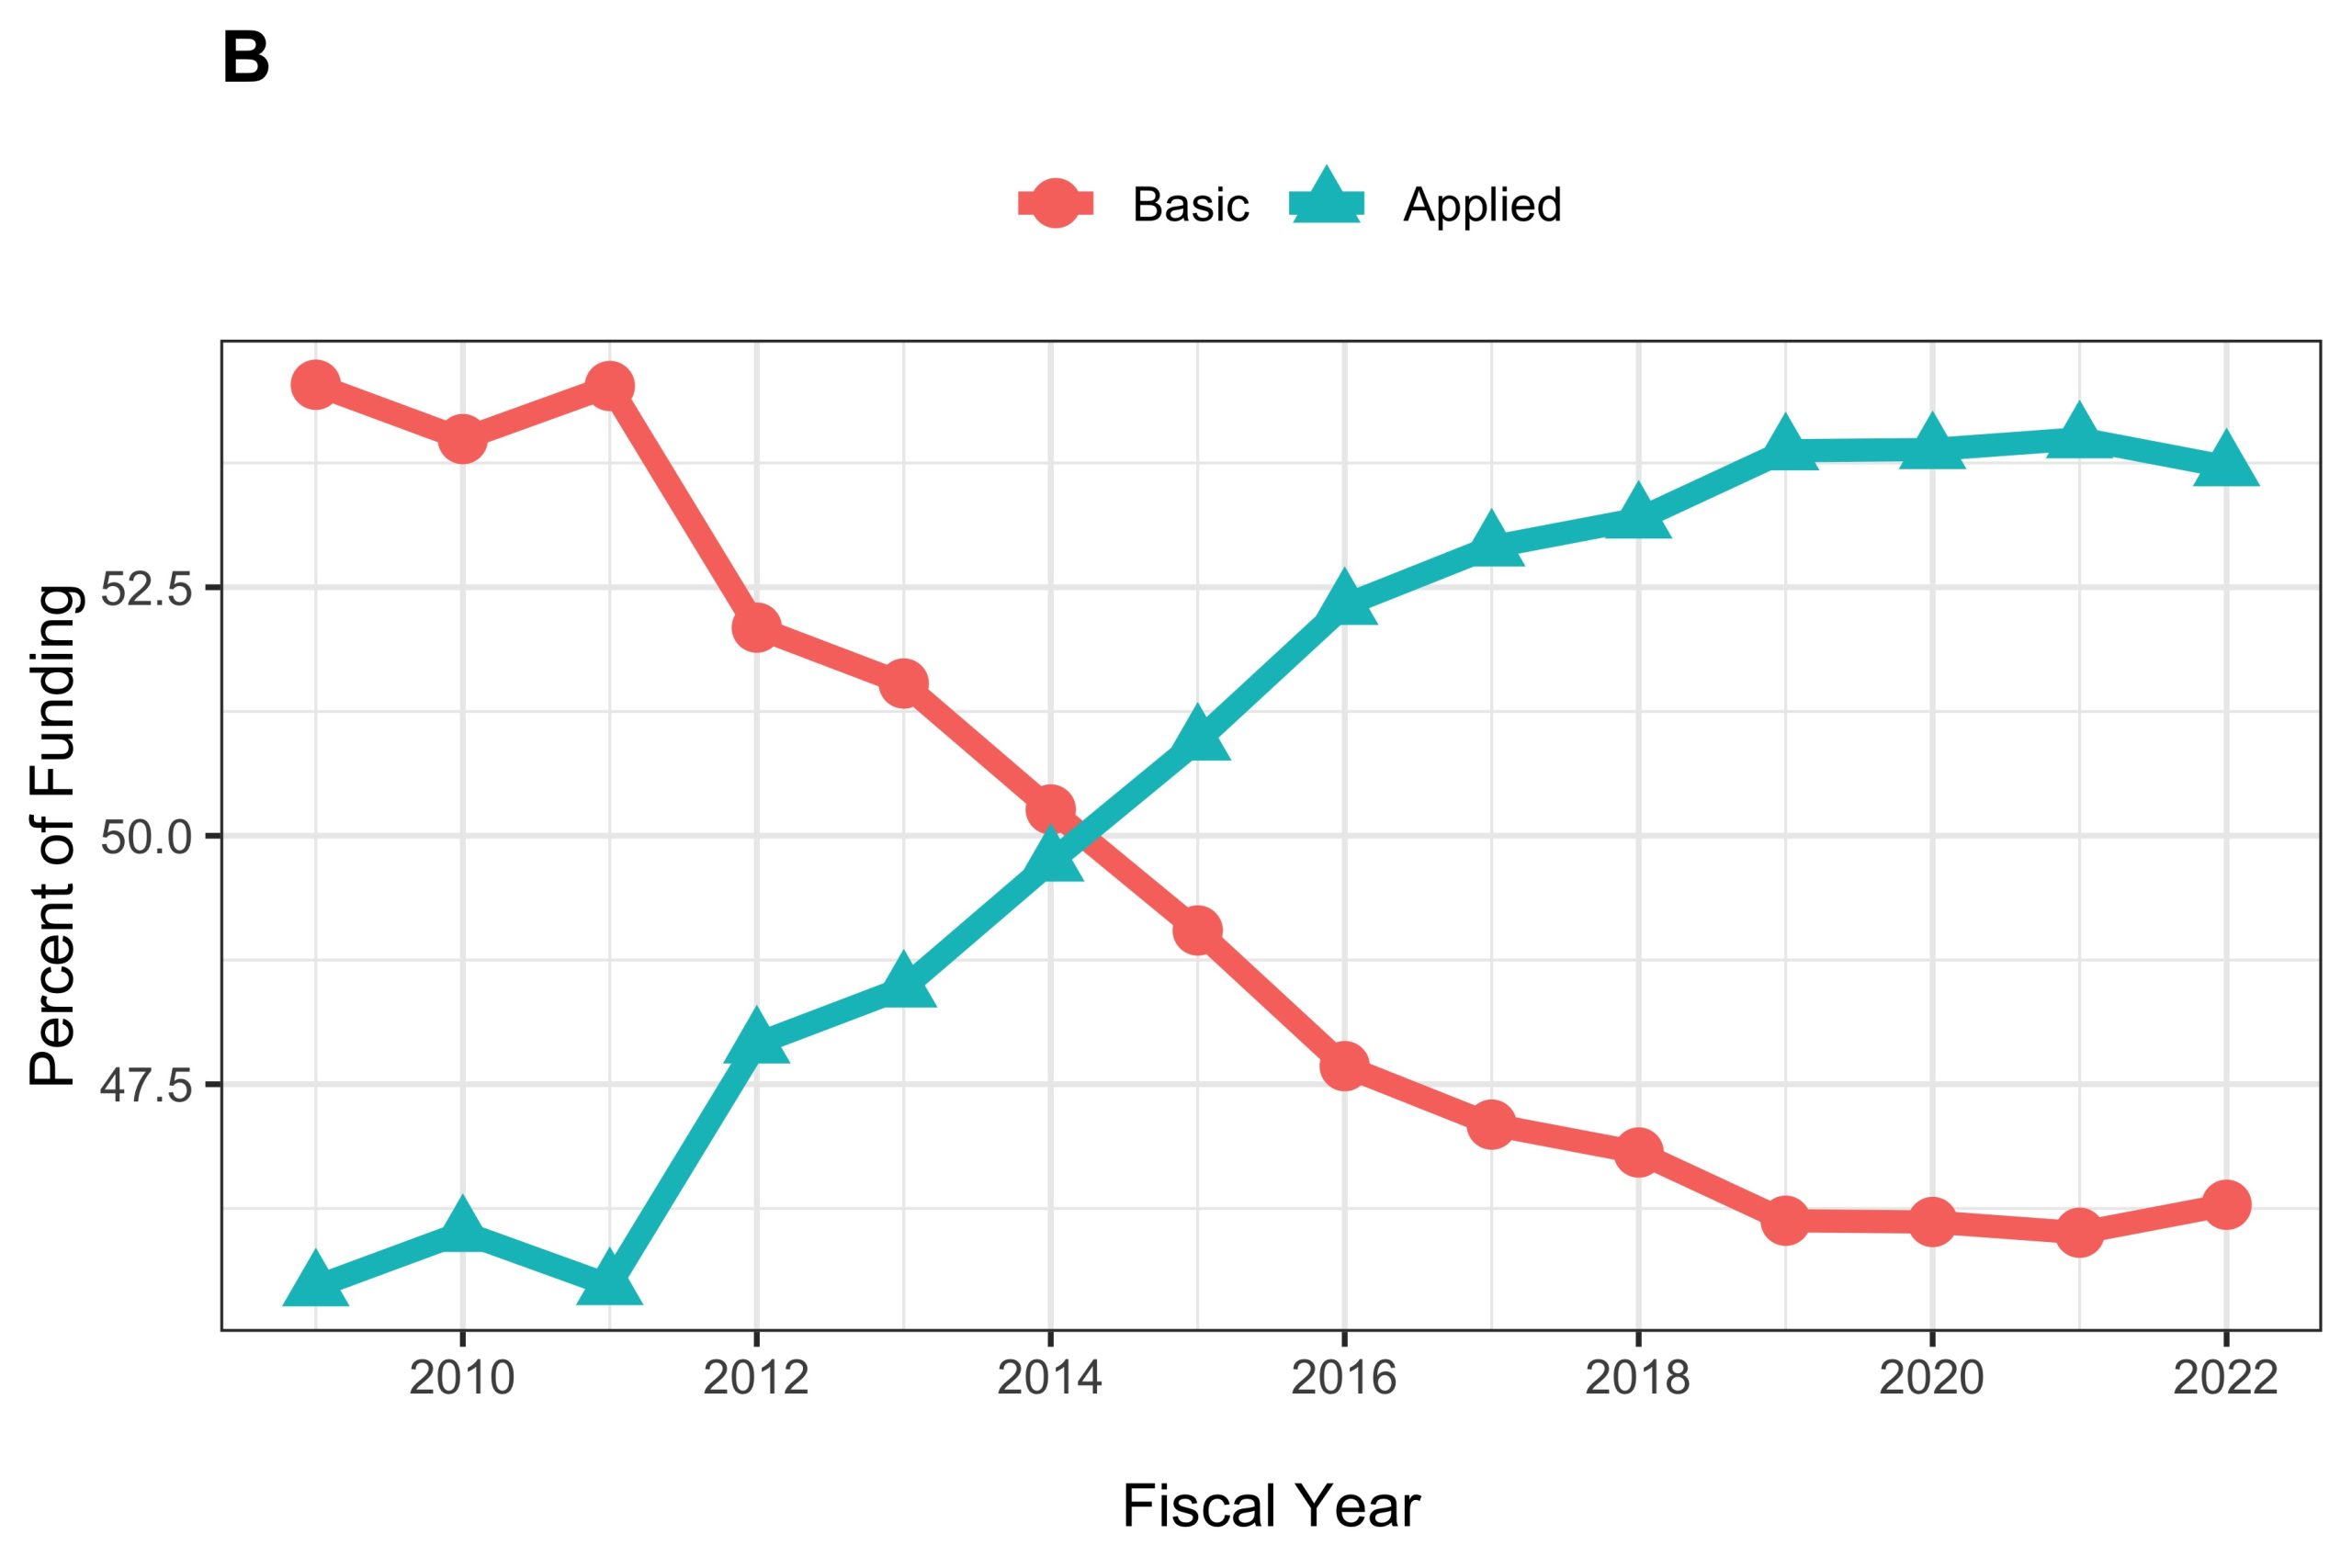
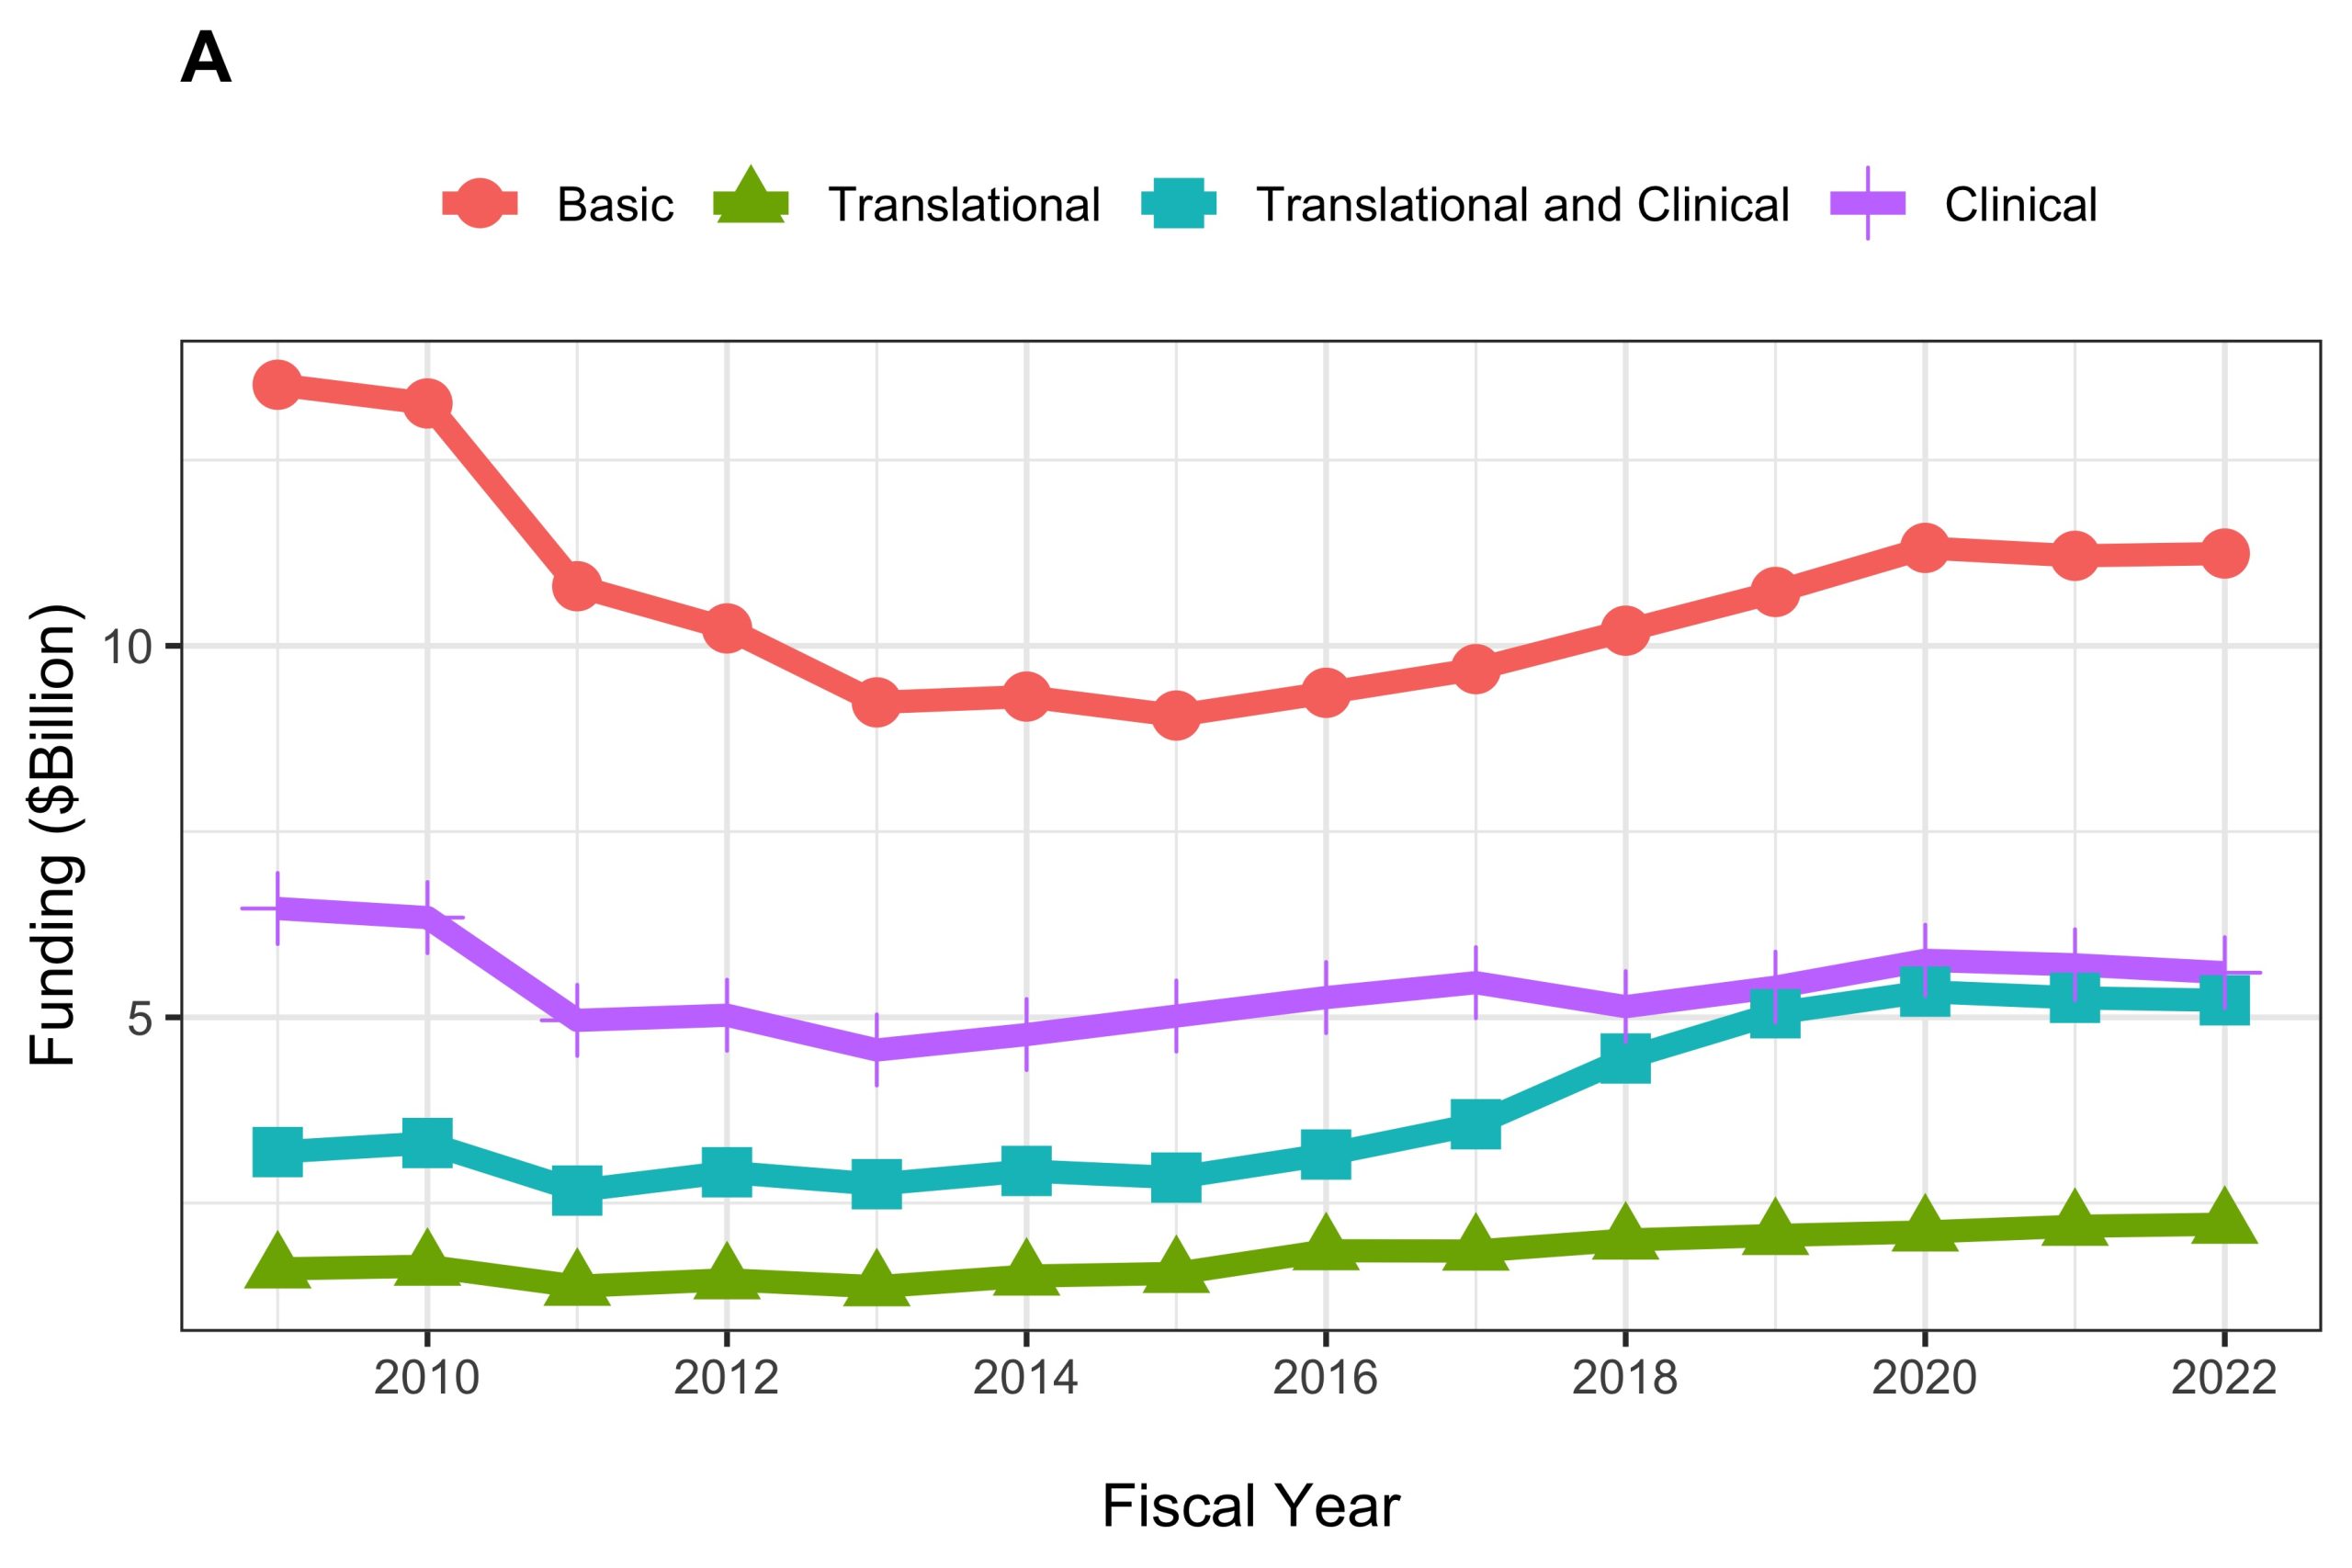
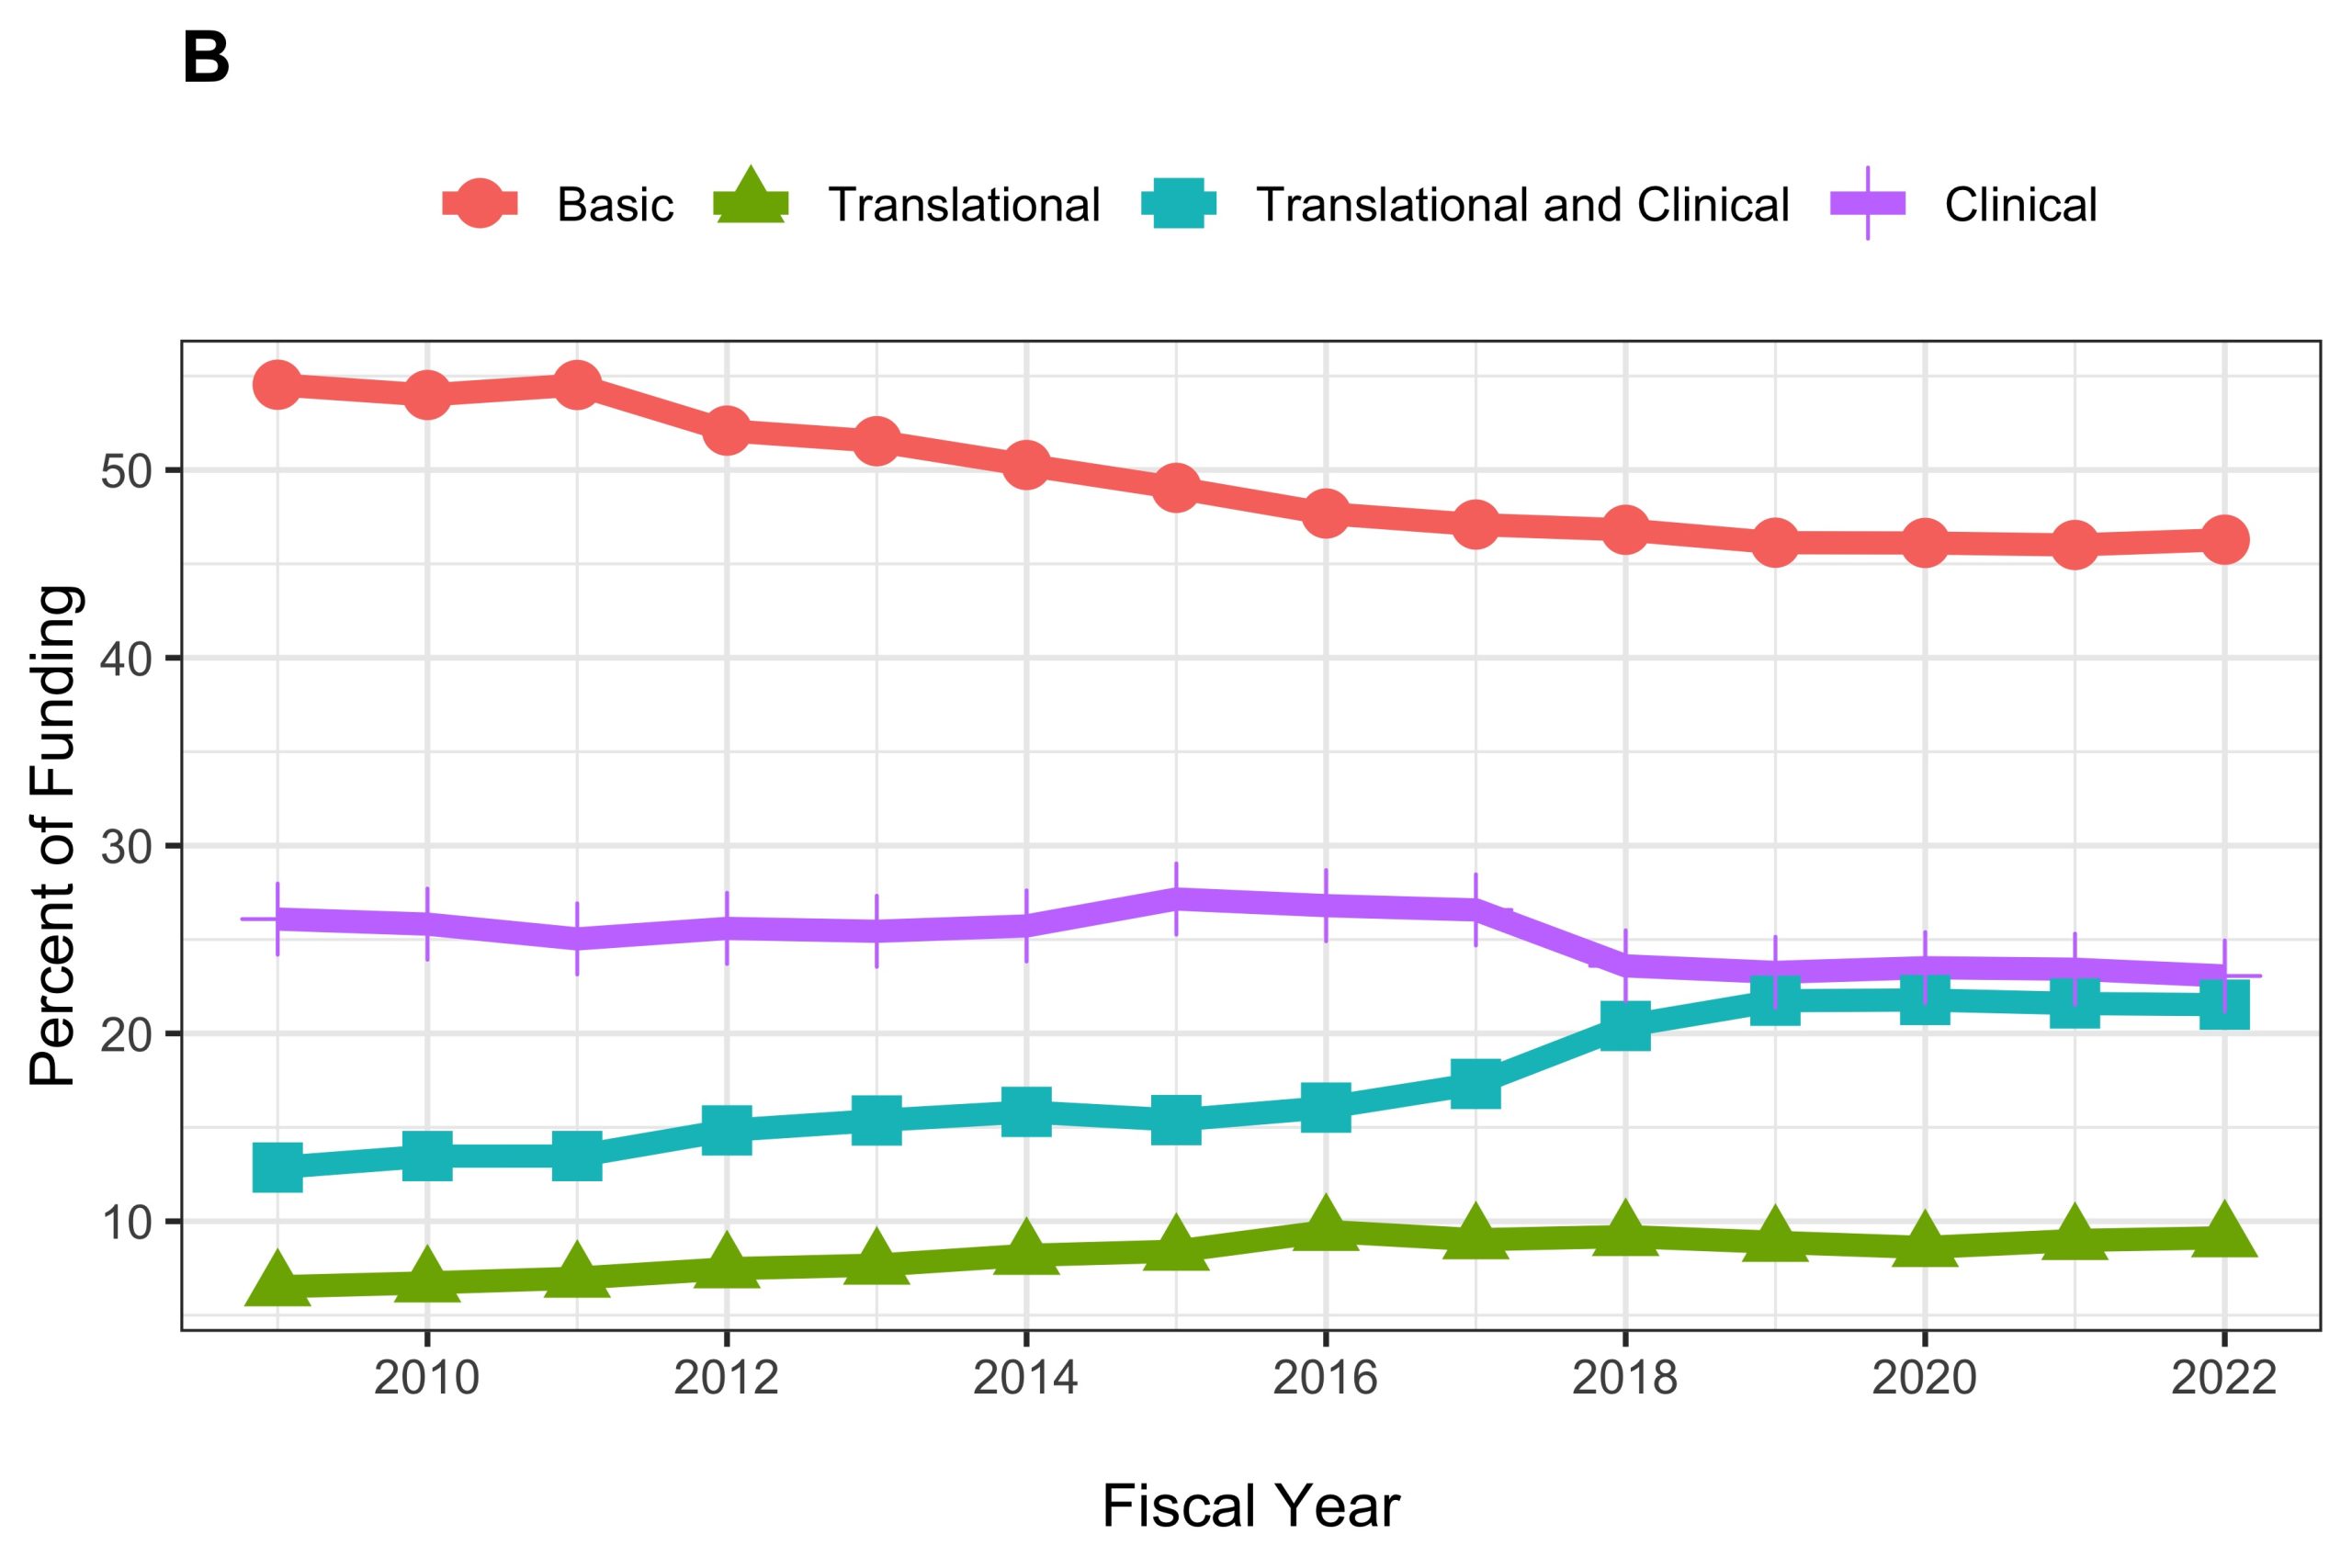
Figure 2 shows the trends in BRDPI-adjusted funding, according to whether projects were classified as basic or applied (translational and/or clinical). Generally speaking, both basic and applied research trend downward until FY 2013 (year of budget sequestration), then increased to a peak in FY 2020. In 2009, basic projects had a slightly higher percentage of funding, but since 2012, applied projects have had a higher percentage.
Figure 2: Inflation Adjusted Funding for Basic and Applied Research: FYs 2009 to 2022
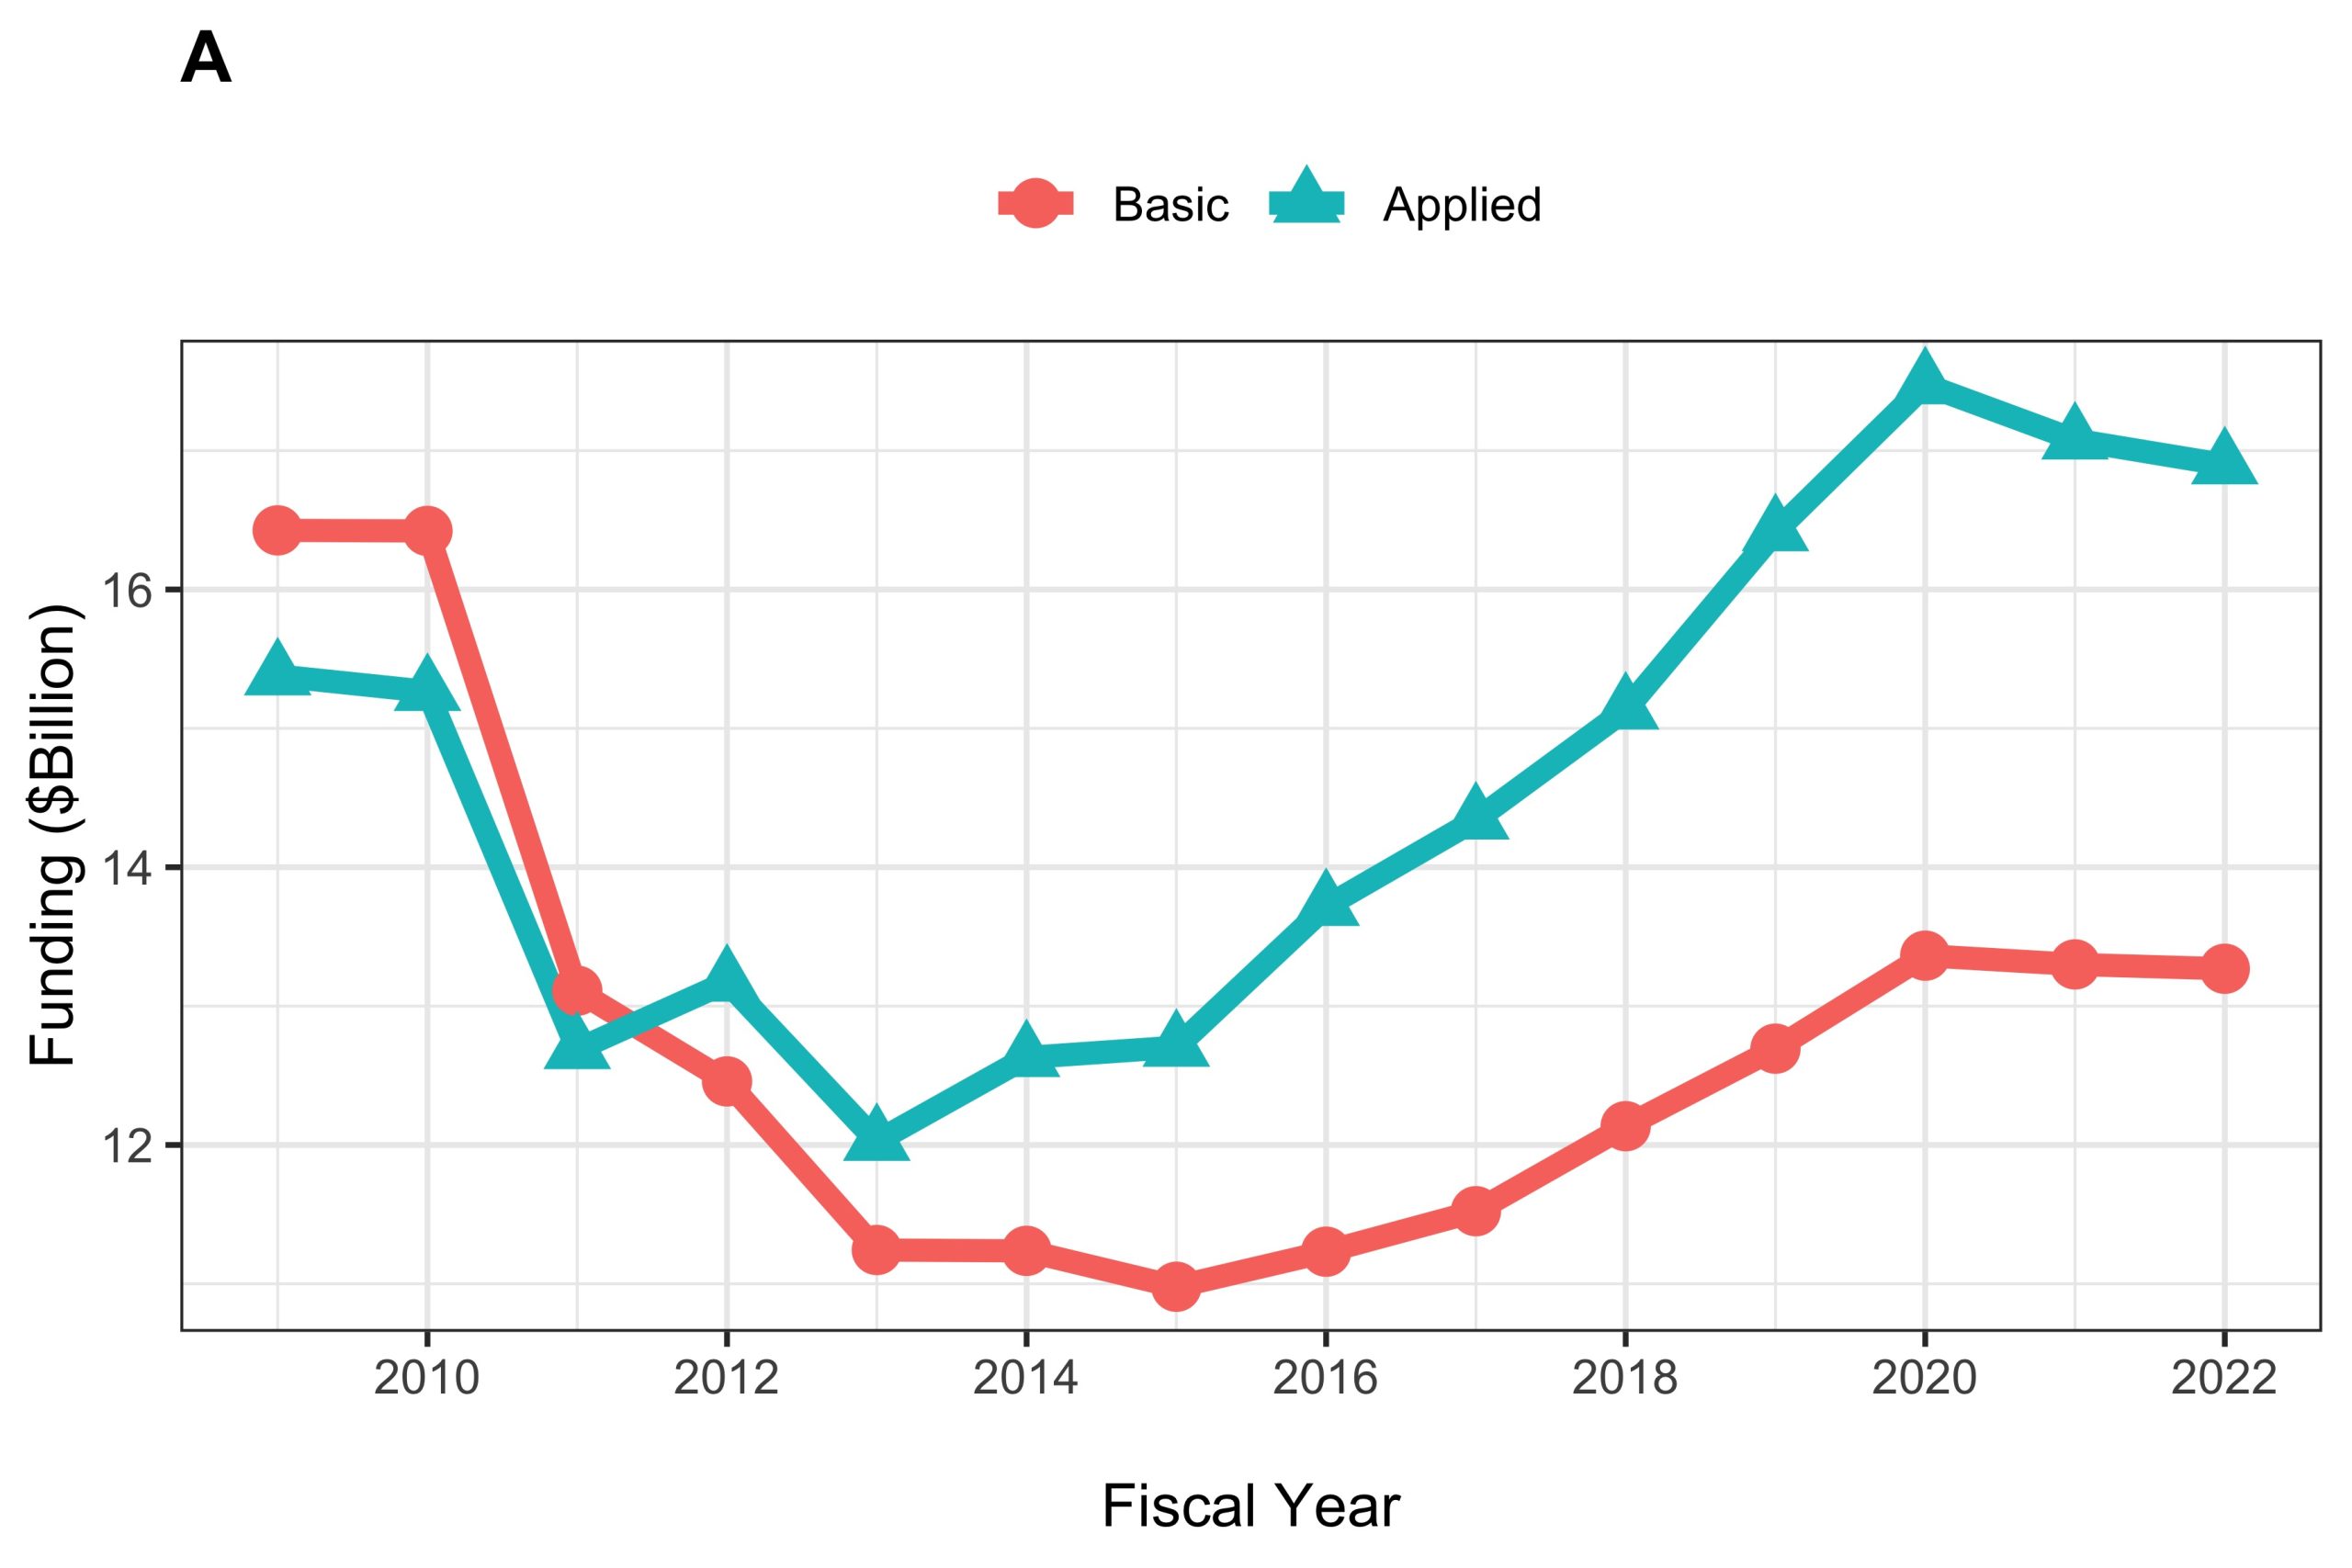
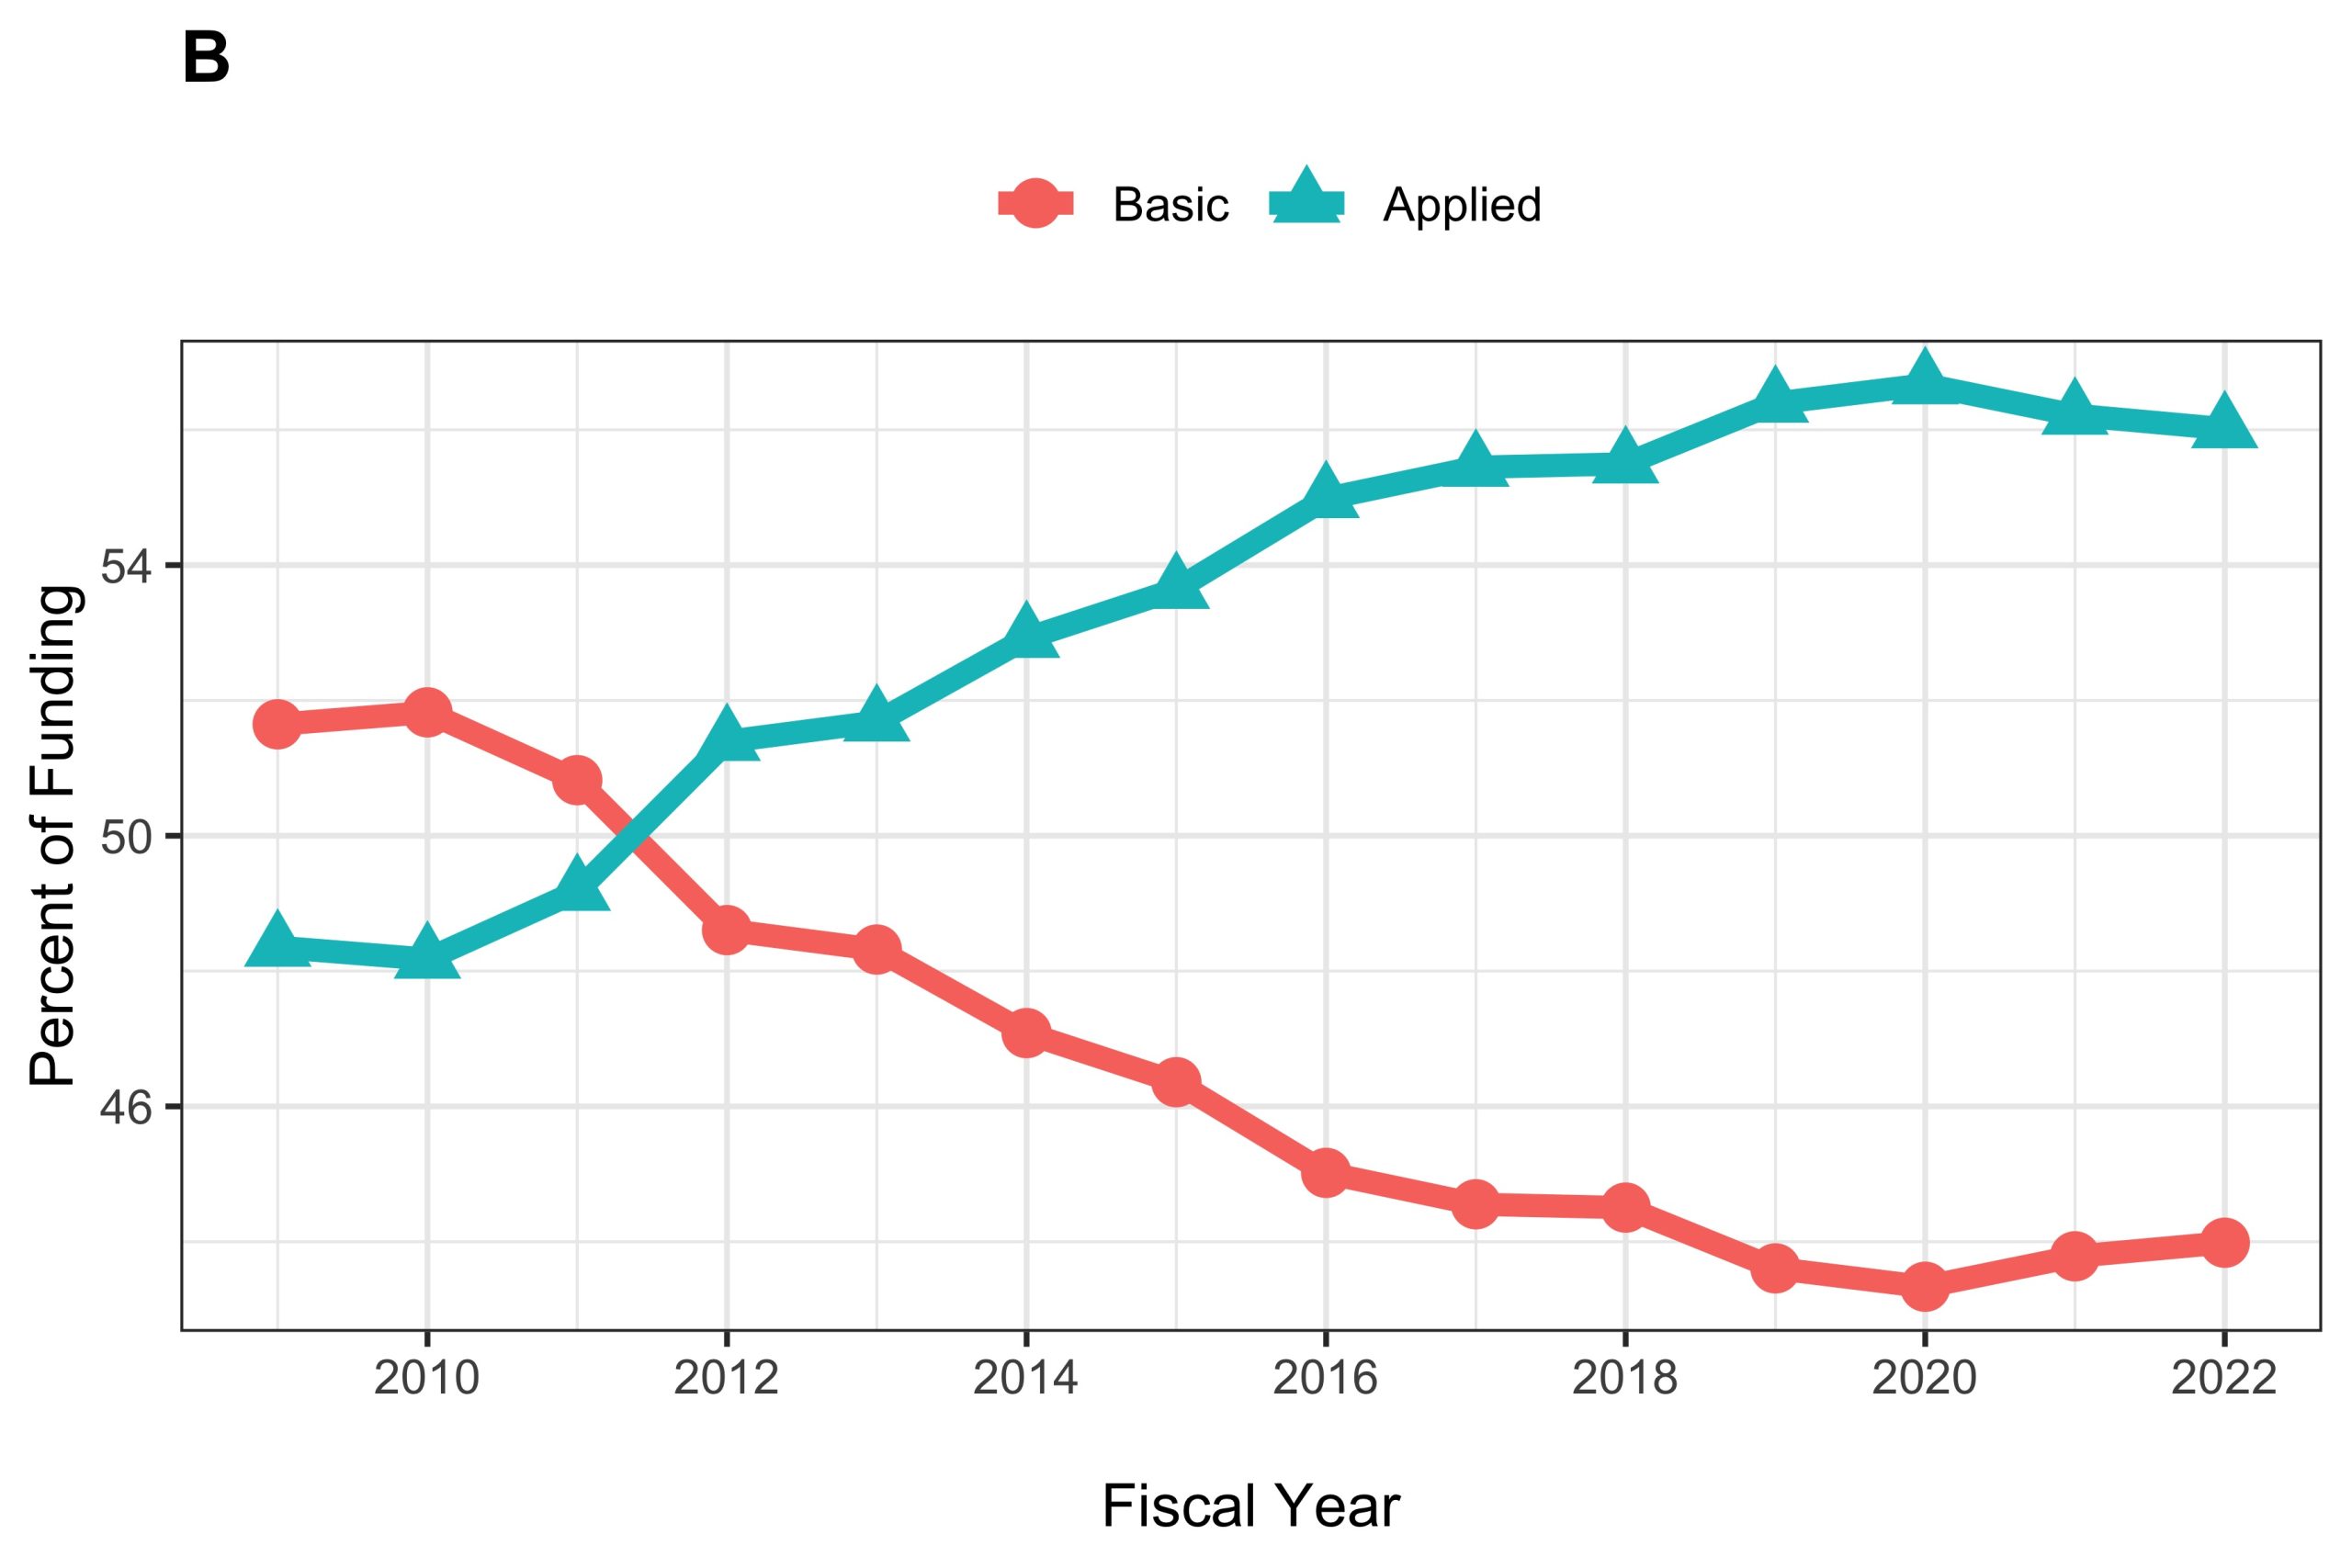
Figure 3 focuses on Research Project Grants (mechanism = “RP”) and shows trends in numbers of projects (or subprojects) over time. The number of basic research projects was generally higher than applied research projects. The overall number of basic projects trend downward until FY 2016, when it began to rise. The number of applied research projects slowly increased after FY 2011, but not to the level of basic research projects. In general, the rate of funding for basic research was higher than applied research.
Figure 3: Numbers of Basic and Applied Research Projects (or subprojects): FYs 2009 to 2022
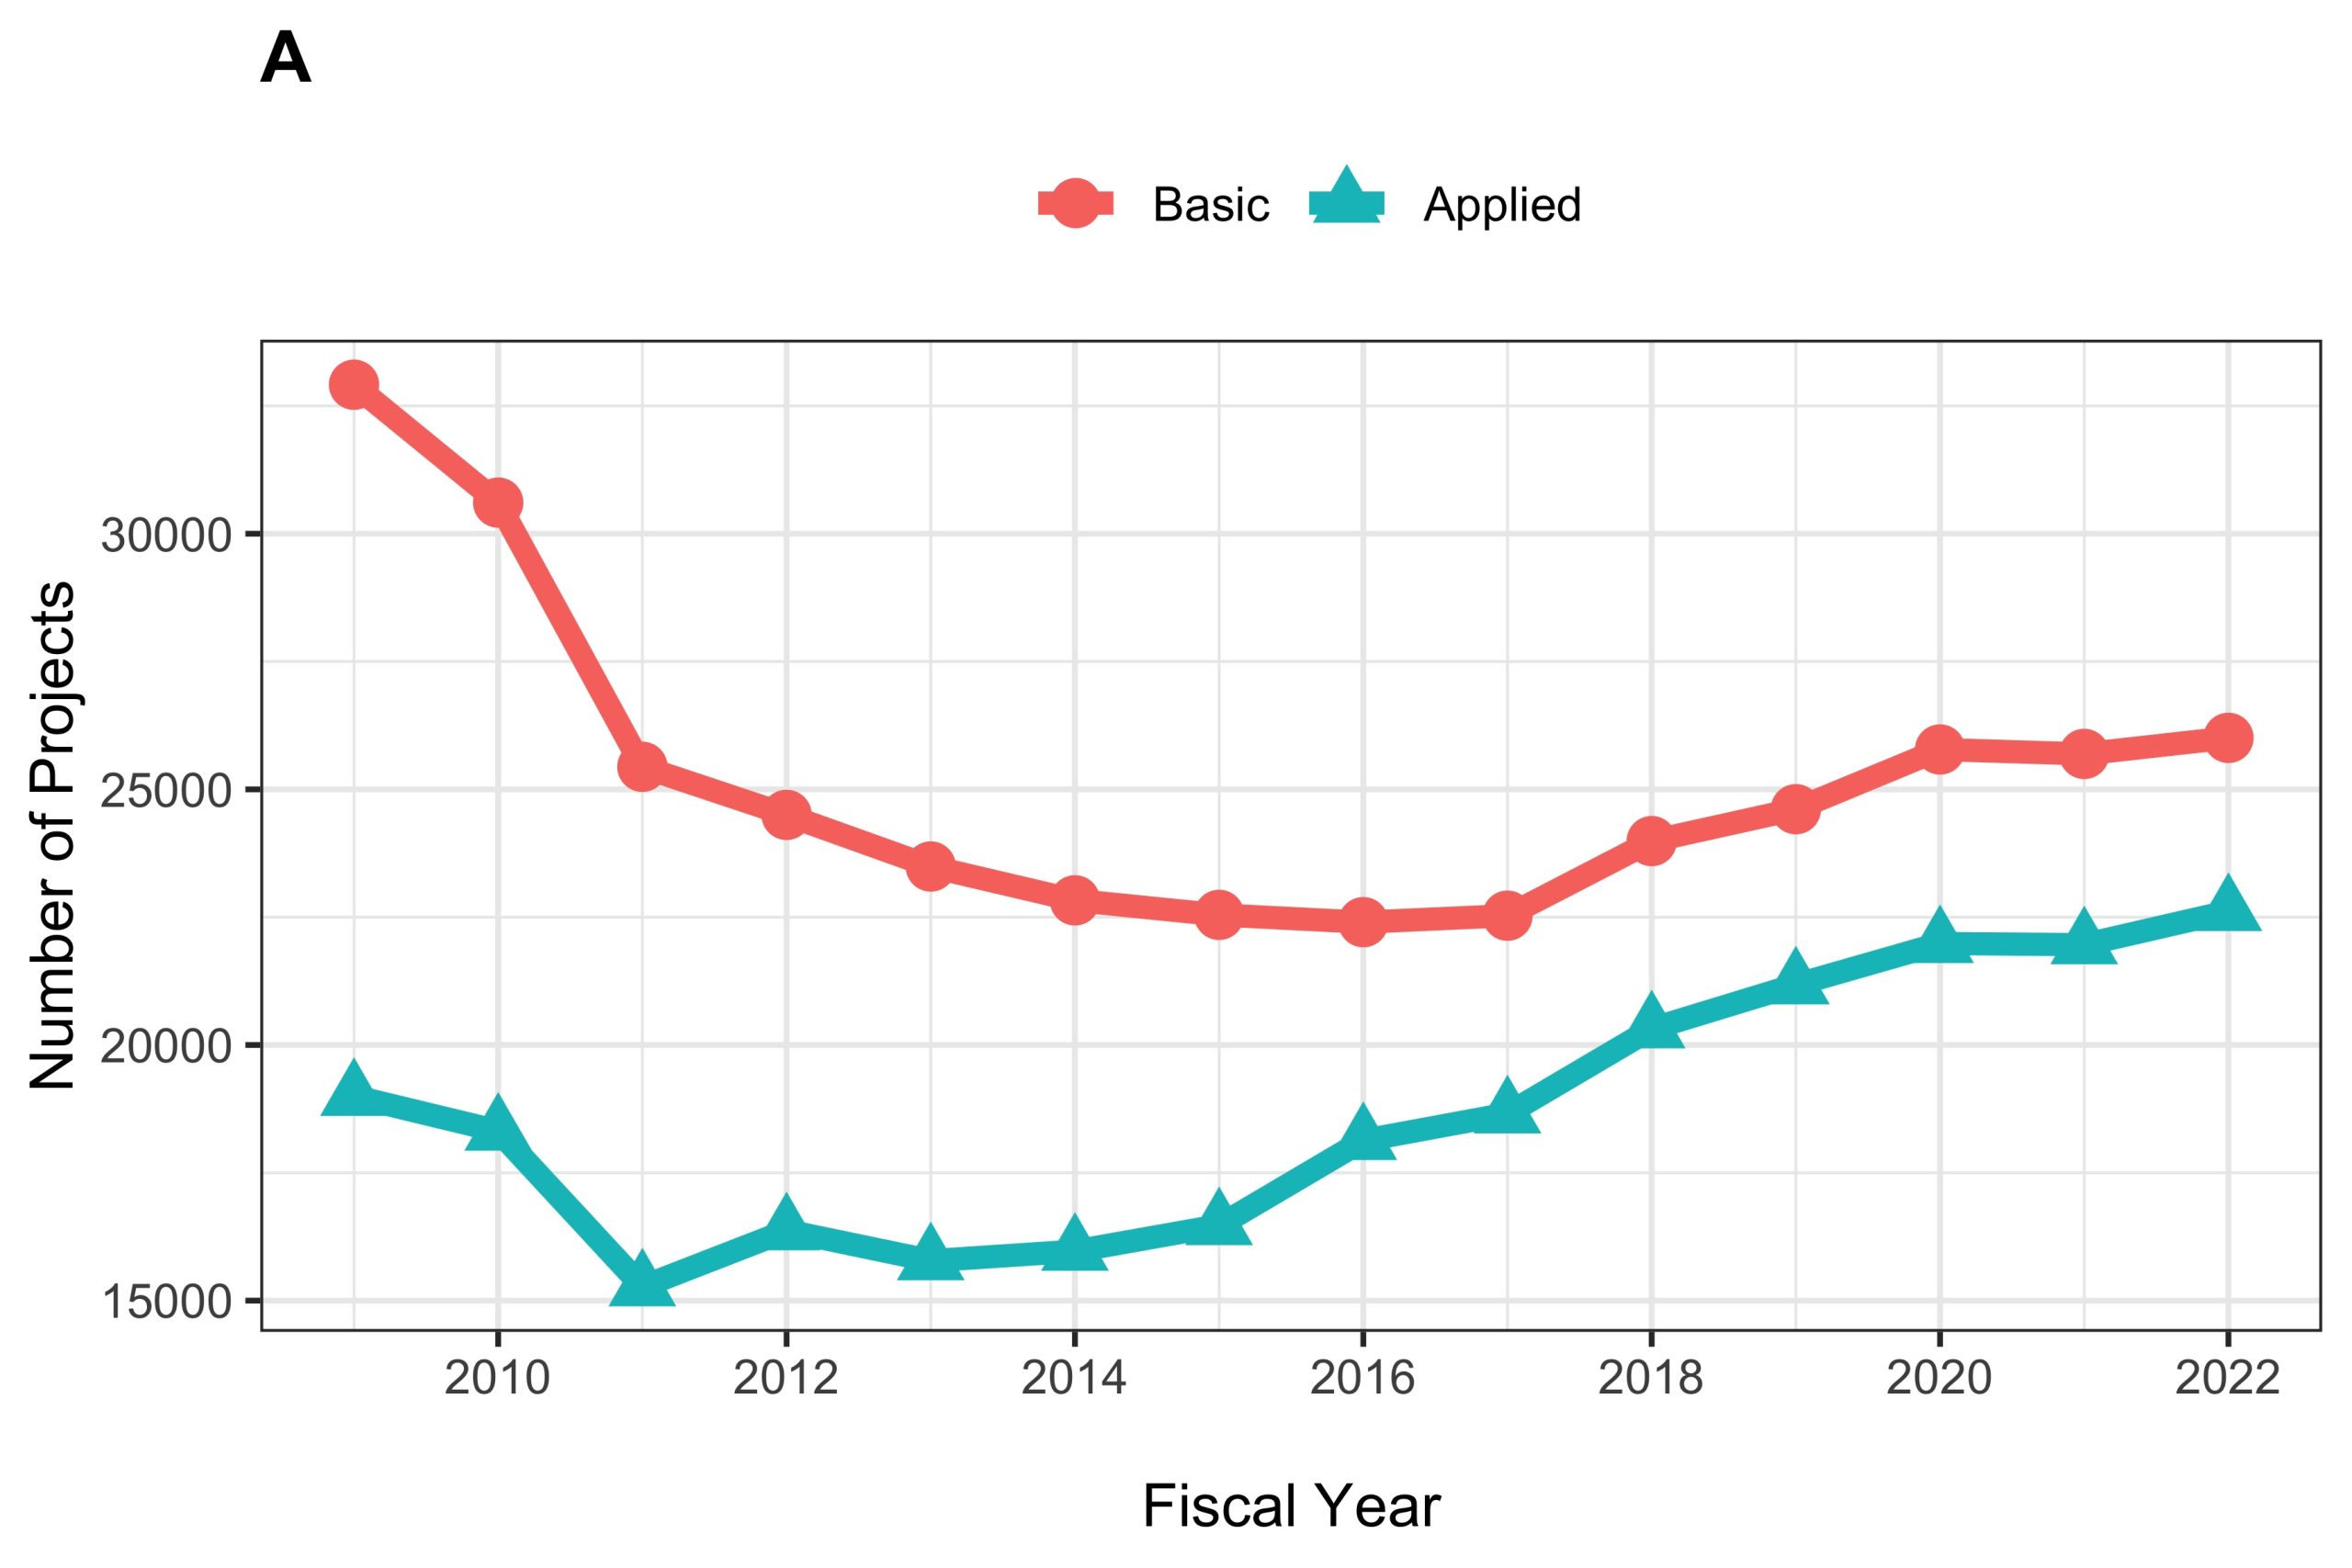
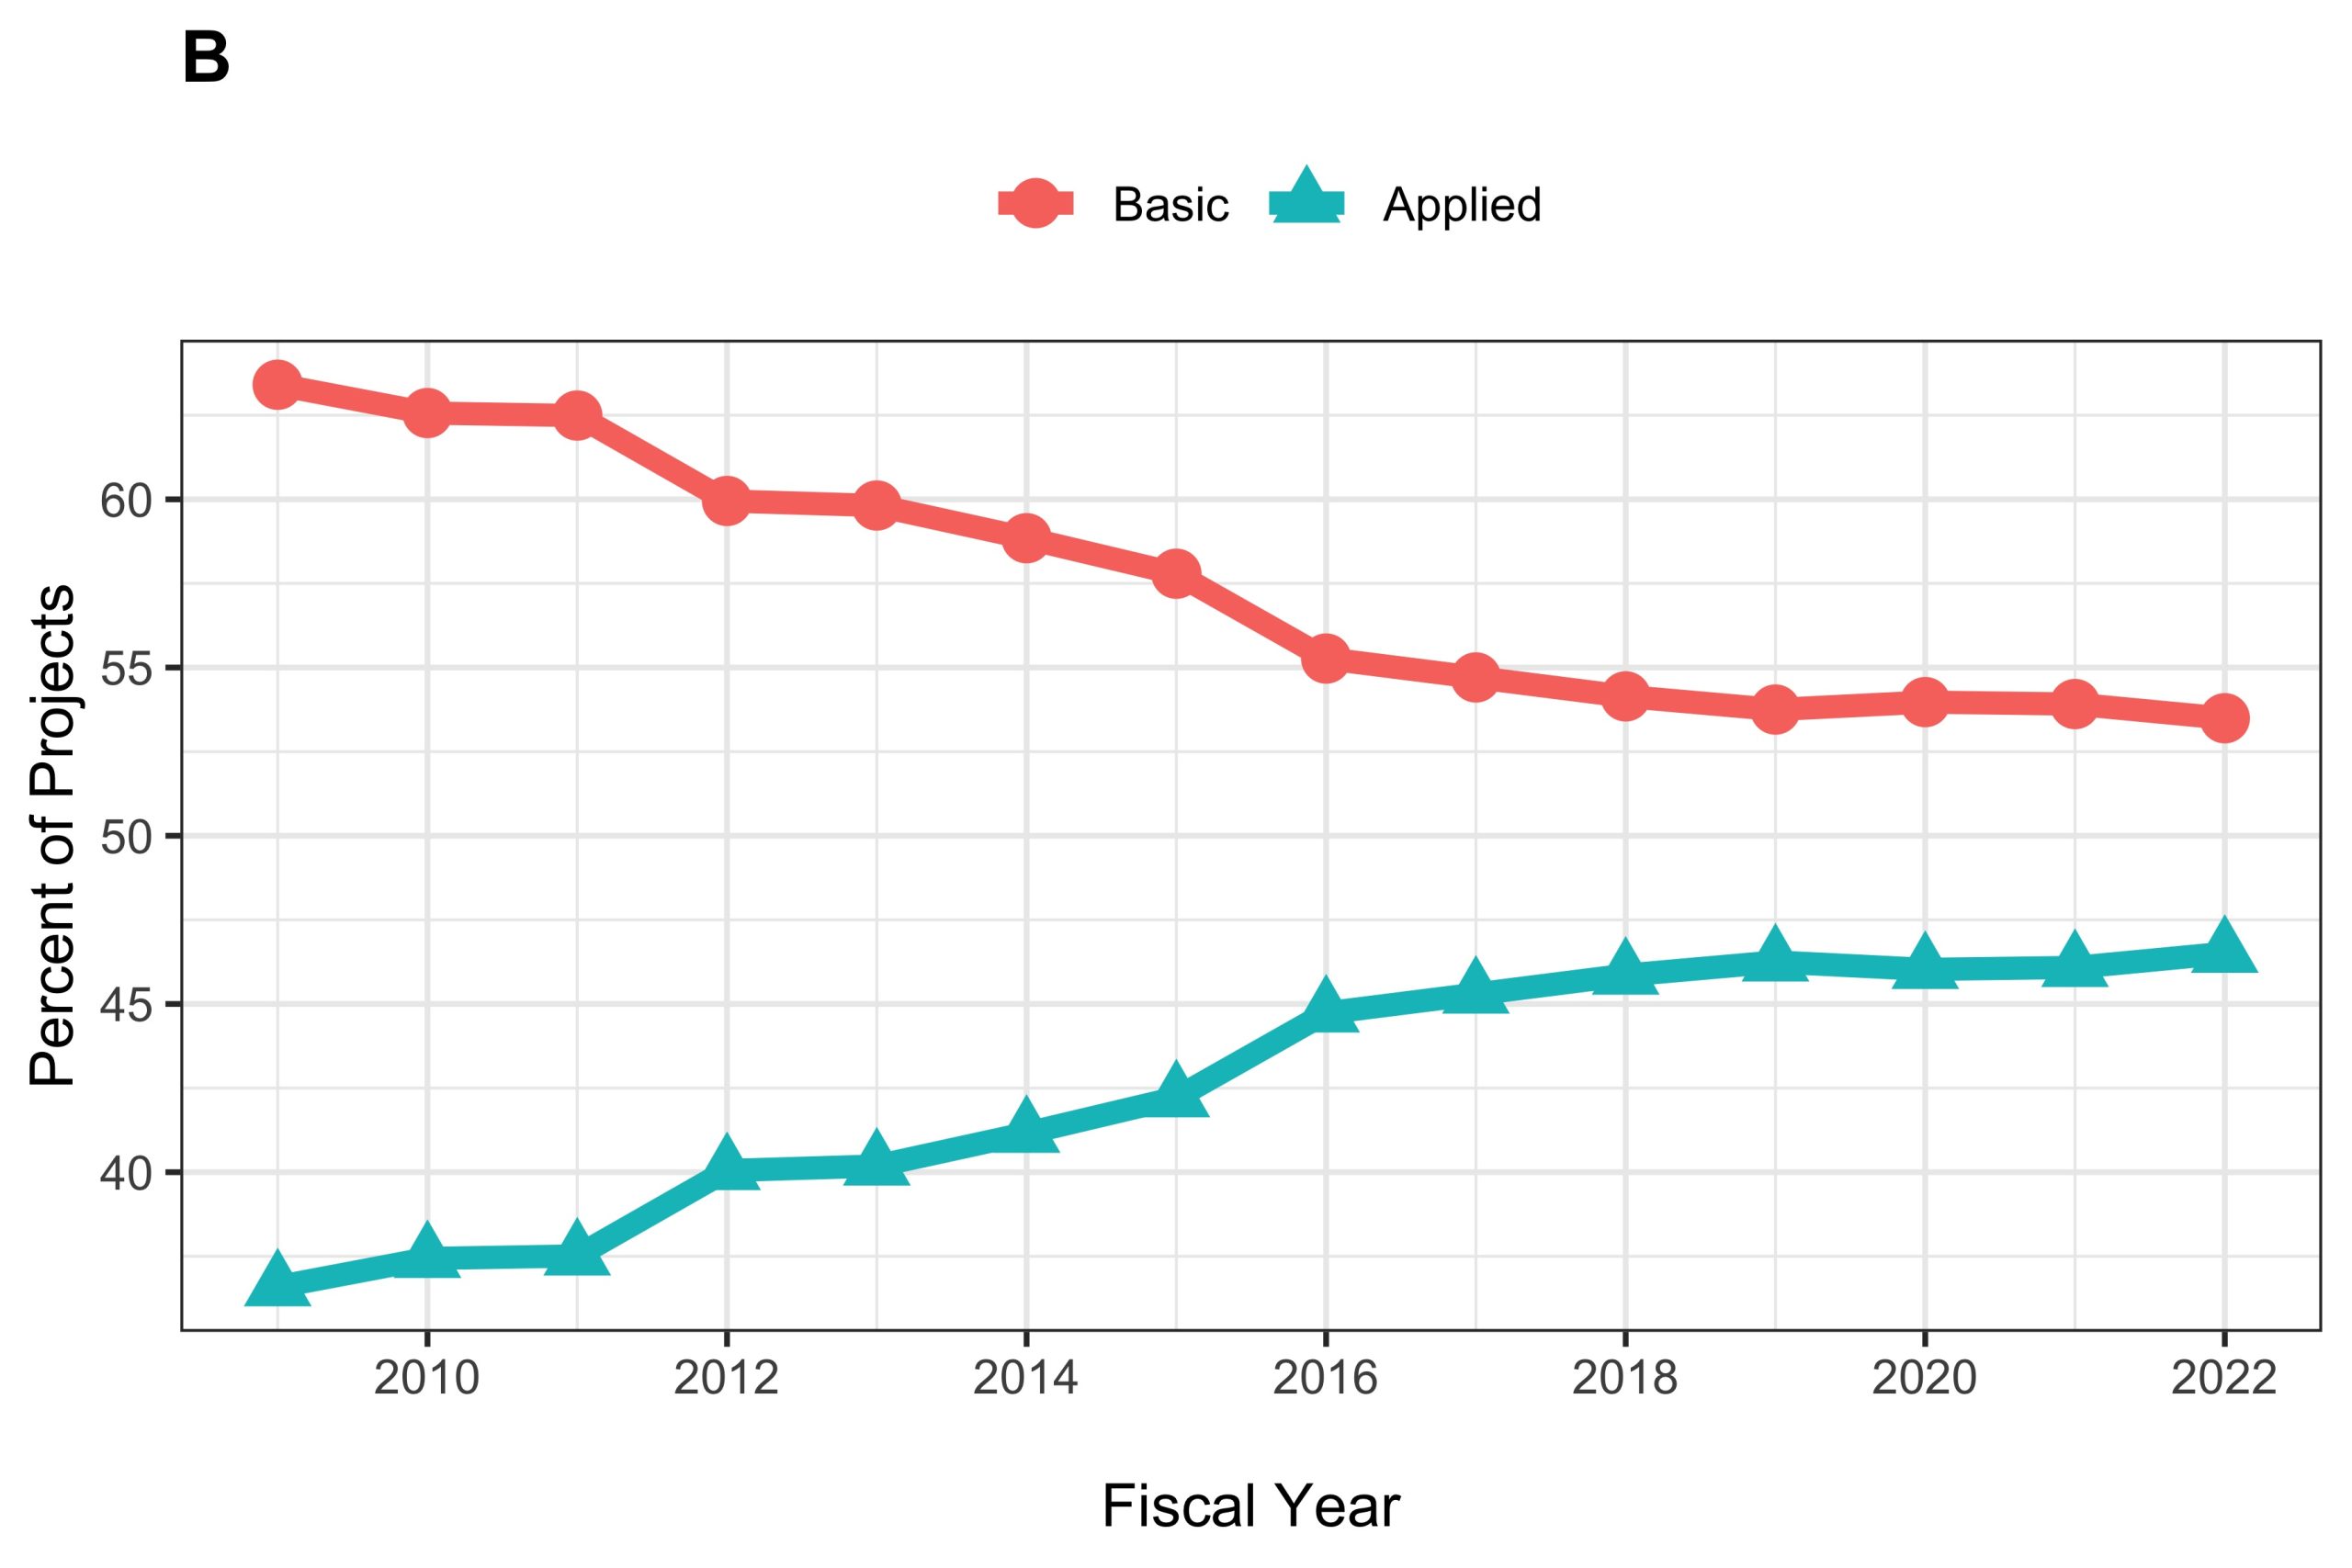
Figure 4 also focuses on Research Project Grants and shows trends in funding over time. Funding for both basic and applied research decline until FY 2013, and the rates have increased since. Funding for applied research have generally been higher than basic since FY 2014. The funding rates for both have held relatively steady since FY 2020. Applied research represented a larger proportion of funding beginning around FY 2014.
Figure 4: Funding for Basic and Applied Research: FYs 2009 to 2022
Figures 5 and 6 show Research Project Grant data with types of applied projects broken down into sub-categories. Of note:
- Basic research had the higher overall number of projects and funding compared to the other groups.
- Basic research numbers modestly increased since FY 2012, with funding steadily increasing starting around FY 2016.
- Clinical research numbers and funding have generally remained relatively constant since FY 2011.
- Translational & clinical projects slightly increased since FY 2018.
- Translational projects slightly increased starting in FY 2016, and generally had the lowest funding amount and percentage compared to the other groups.
Figure 5: Number of Basic and Applied Research Sub-groups: FY 2009 to 2022
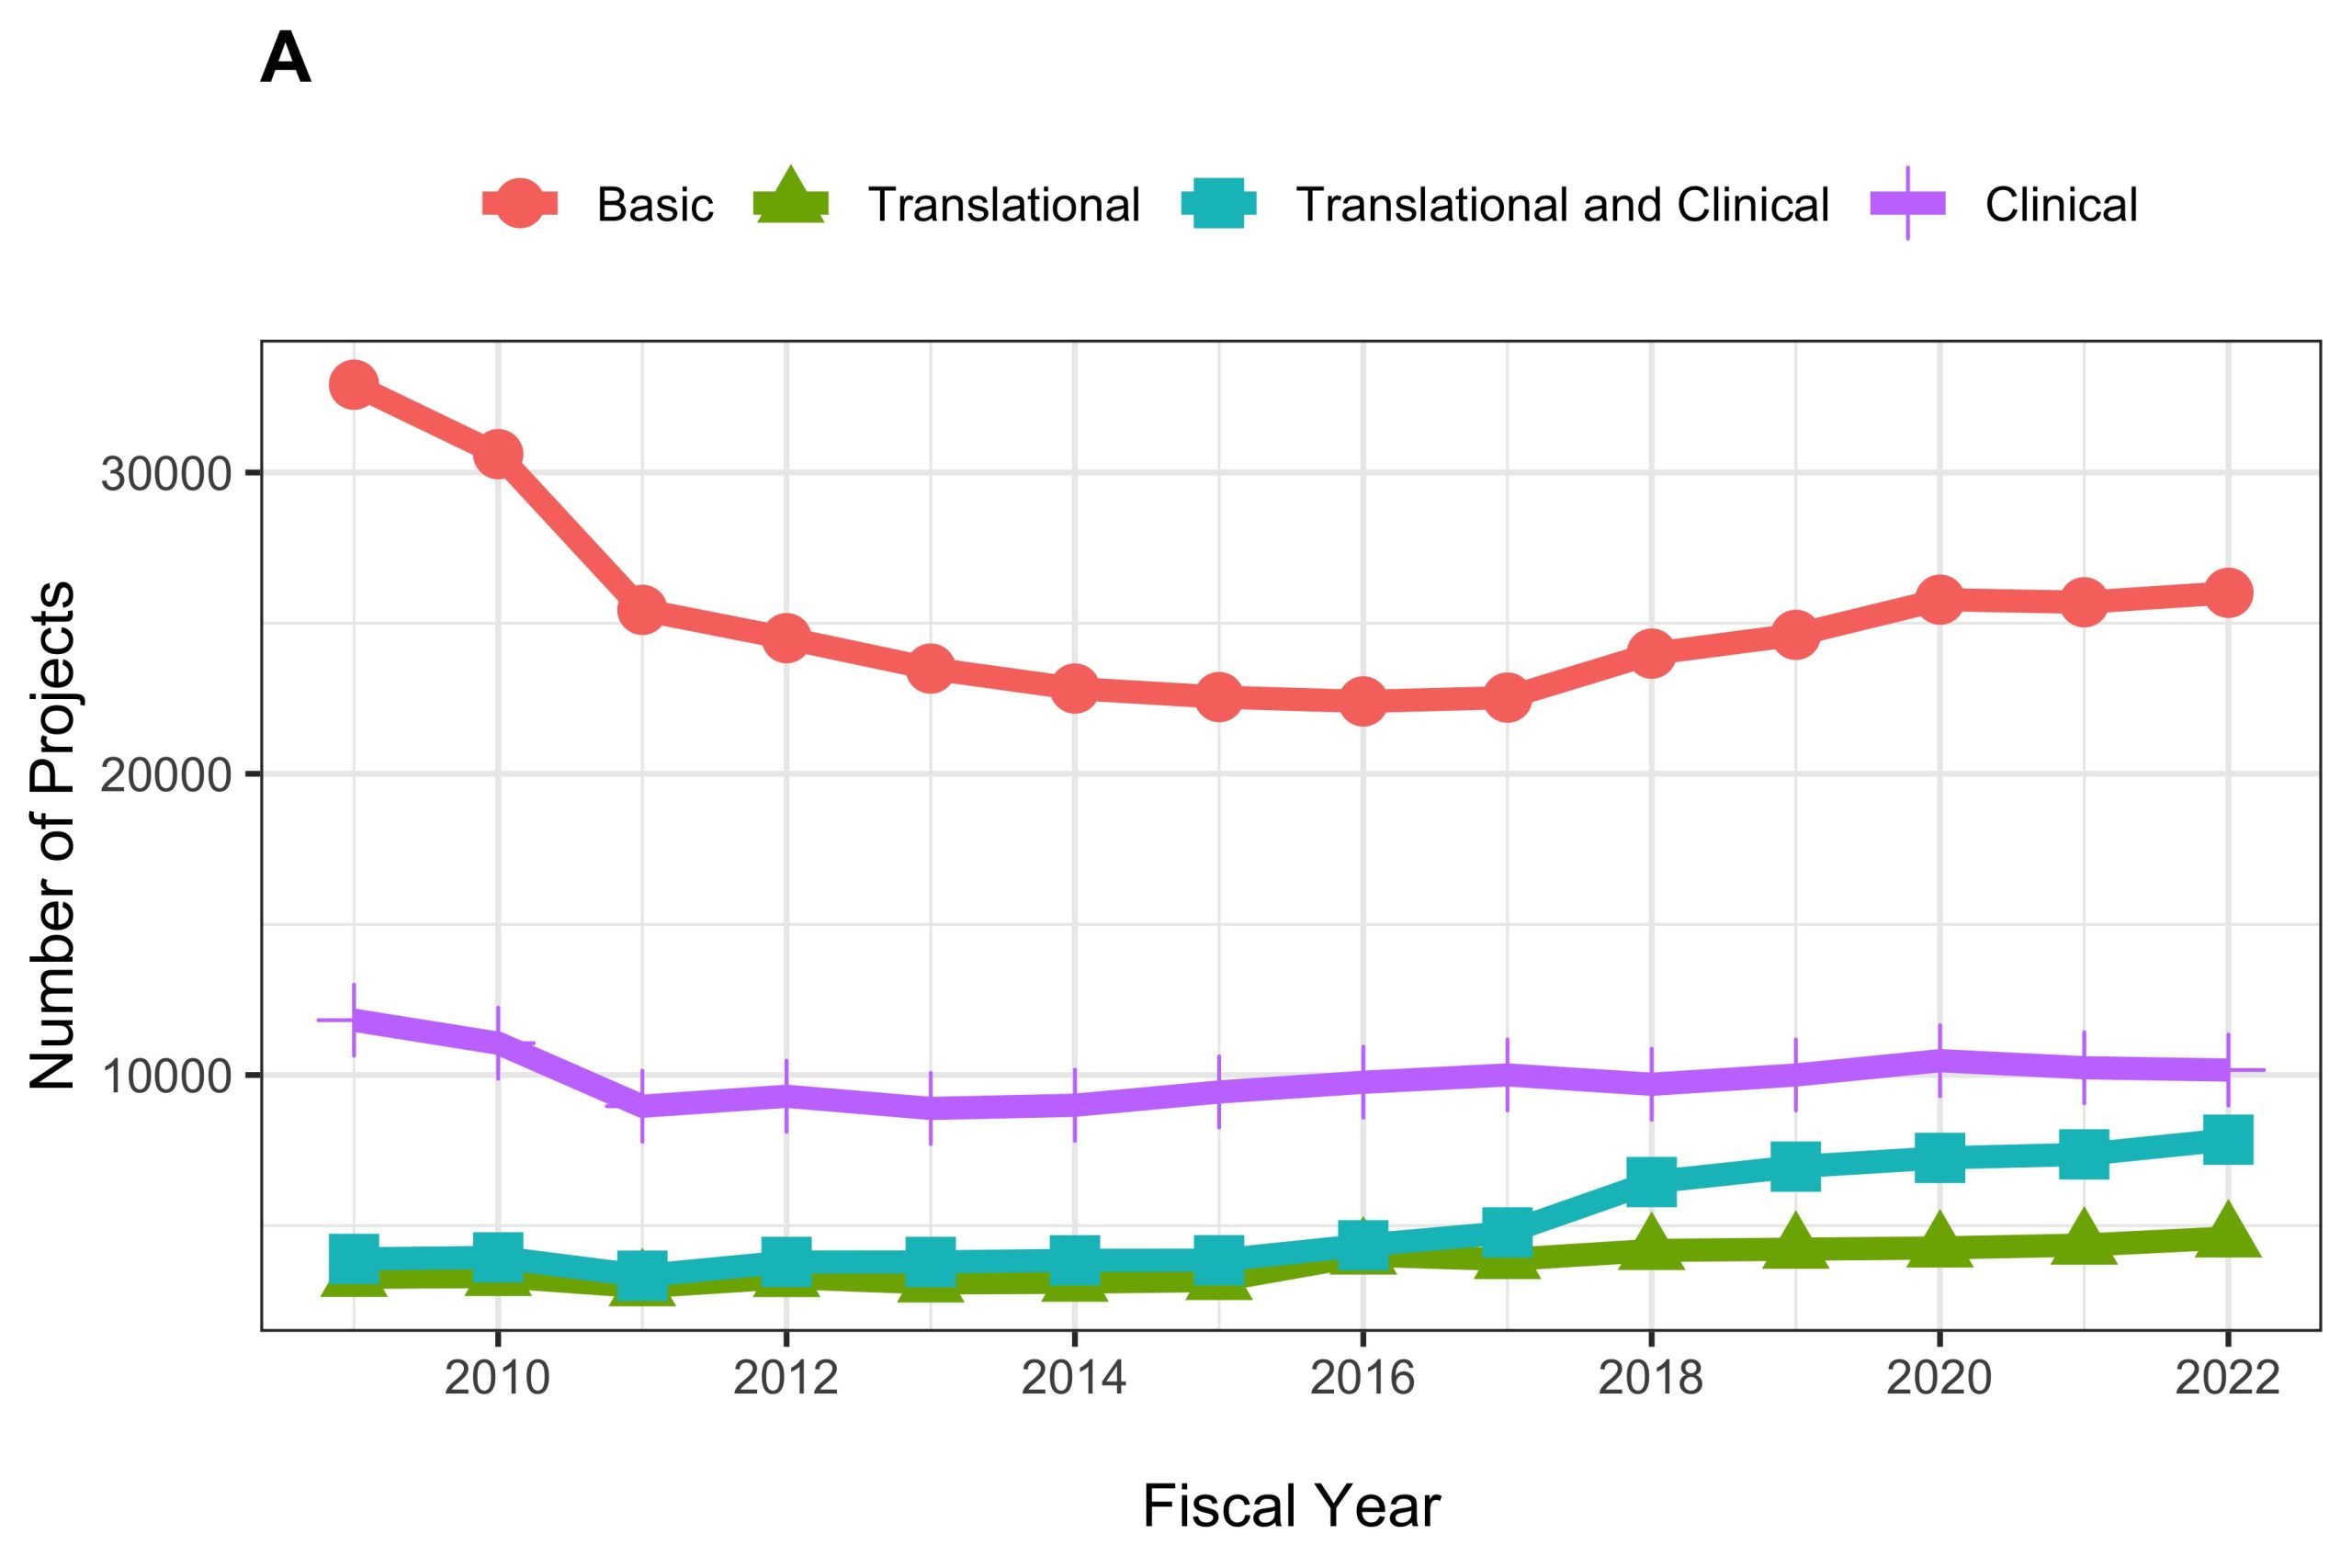
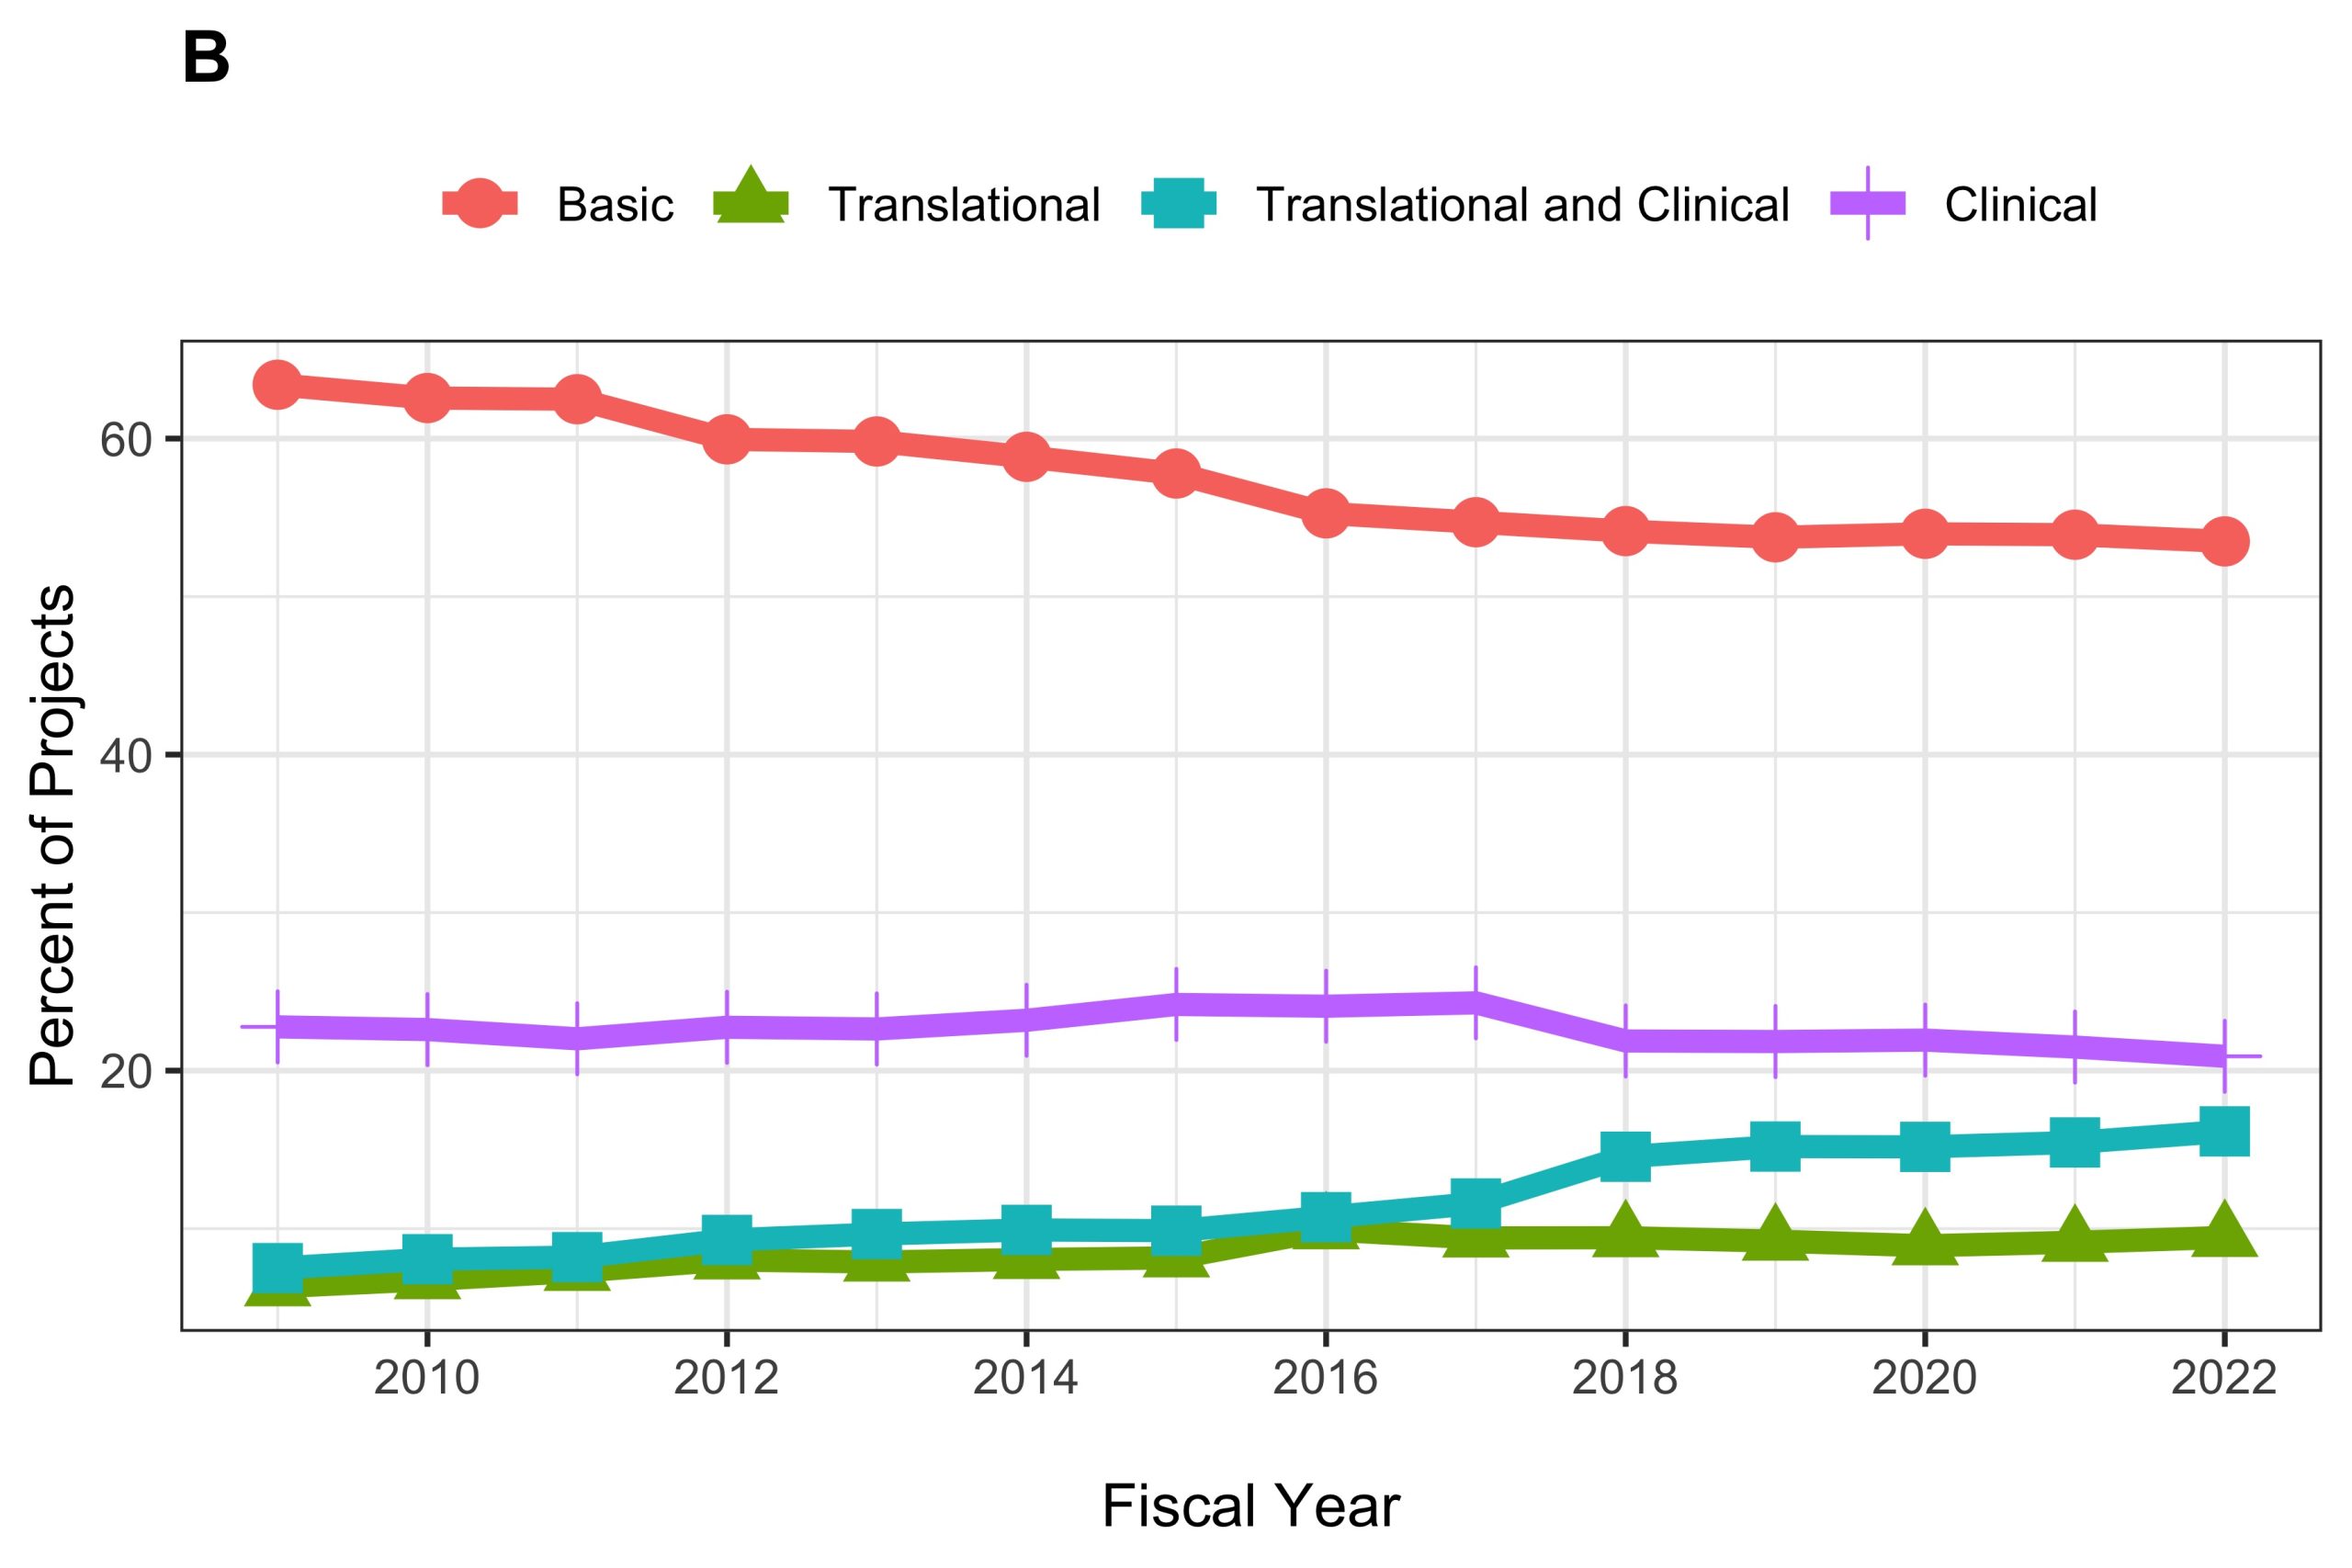
Figure 6: Funding for Basic and Applied Research Sub-groups: FY 2009 to 2022
In summary, from FYs 2009 to 2022, the proportion of research projects devoted to basic research declined while the proportion of combined translational and clinical research projects increased. As of FY 2022, there is an even division of basic and applied projects, but applied projects account for the majority of NIH spending. Most of the shifts occurred between 2009 and 2018, with trends stabilizing since. I am grateful to my colleagues in the Office of Extramural Research (OER) Division of Scientific Categorization and Analysis (DSCA) for their help in conducting and reporting these analyses.
Editorial Note (January 9, 2024): the source data for the figures presented in this blog are available on the Special Report section of RePORT (direct link to spreadsheet).
I think the dichotomy between “basic” and “applied” research is often a false distinction. Much of the work one might call “applied” (i.e., promotes healthy behaviors) develops and/or tests theories of behavior change. Historically, I think, the distinction was used by “basic researchers” to feel superior to those conducting “applied” work. We discuss this further in Miller-Day, M.A., & Hecht, M.L. (2010). “Applied” Aspects of the Drug Resistance Strategies Project. Journal of Applied Communication Research, 38, 215-229. NIHMS209280
Great blog, Mike. I would love to see an RCDC Category filter added to NIH Reporter so that you could view basic vs. applied research funding of individual PIs or institutions.
Does it complicate thinking about this, if “applied research” is an average more expensive than “basic” research? Is it?
Very interesting. Is this data available by institute?