
If you conduct human subjects research and completed an RPPR recently, you may have noticed something new in your inclusion enrollment report. If you haven’t had a chance to see it yet, we’ve got great news: Inclusion Enrollment Reports now include a table summarizing the age data that you submit as part of the participant-level data.
As you may recall, the Inclusion Across the Lifespan policy requires information on the sex or gender, race, ethnicity, and age at enrollment of each participant in prospective human subjects research. This requirement became effective for research from applications submitted to NIH starting January 25, 2018.
To fulfill the requirement, investigators complete a template spreadsheet that lists the sex or gender, race, ethnicity, age, and the age unit used for each participant. The spreadsheet is then uploaded in the Inclusion Enrollment Report, or IER. Each year investigators are to add new participants to the spreadsheet in order to provide cumulative data.
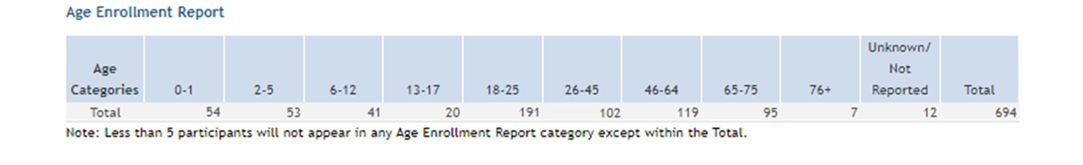
Until June 2023, the IER showed a summary of the uploaded sex or gender, race, and ethnicity information in the cumulative enrollment table, but age data were not displayed. Now, the IER includes a separate age data table that summarizes participant enrollment, divided into several age groups. NIH staff also see this table when looking at a study’s information.
One important thing to note: for privacy reasons, data will not be displayed if the number of participants in any age group is less than 5. This does not apply to the total column, so you can always use that to confirm the number of participants accounted for by the data you provided.
0 Comments