
18 Comments
Introduction
Postdoctoral NIH T32 programs aim to provide select trainees with experience to enable successful career and research development. In a previous posting, we presented NIH career development, or K award, and R01 equivalent research grant outcomes of participants in post-doctoral T32 programs. We showed that men with MD-PhD degrees had the highest rates for R01 application submission and award receipt (as PI). Women comprised a greater proportion of trainees over time. Serving as PI on a K-awards predicted a substantially higher rate of later support as PI on R01 awards. Here we present further analyses focusing on the association of under-represented minority (URM) status with subsequent K or R01 awards.
Cohorts
These analyses are based on the outcomes of 33,977 T32 post-doctoral participants who matriculated between 1995 and 2009, for whom we had data on age, gender, and URM status, and who had received MD, MD-PhD, or PhD degrees. URM status was known in over 95% of matriculants, and was defined as self-identification as Black, Hispanic, American Indian, or Pacific Islander or participation in an NIH diversity program. We followed participants for designation as principal investigator (PI) on subsequent K and R01-equivalent awards (which we’ll refer to as R01 going forward) through 2017. Table 1 shows race and ethnicity according to gender; Whites and Asians were most common.
Table 1: T32 Participant Race and Ethnicity According to Gender
| Race or Ethnicity | Men (%) | Women (%) |
| Total N (%) | 17810 (52.4) | 16167 (47.6) |
| White | 12125 (68.1) | 10754 (66.5) |
| Asian | 3737 (21.0) | 3256 (20.1) |
| Mixed | 831 (4.7) | 839 (5.2) |
| Black | 670 (3.8) | 941 (5.8) |
| Hispanic | 341 (1.9) | 260 (1.6) |
| Native American | 54 (0.3) | 56 (0.3) |
| Pacific Islander | 43 (0.2) | 48 (0.3) |
Table 2 shows characteristics and high-level outcomes according to matriculation cohort. Over time, a greater proportion of matriculants were women and, to a lesser extent, from URM groups.
Table 2: T32 Participant Characteristics According to Matriculation Cohort
| Characteristic/Cohort | 1995-1999 | 2000-2004 | 2005-2009 | |
| Total N (%) | 10849 (31.9) | 11306 (33.3) | 11822 (34.8) | |
| Age (years) at Matriculation | 30 or less | 3387 (31.2) | 3852 (34.1) | 4200 (35.5) |
| 31 to 35 | 4822 (44.4) | 4977 (44.0) | 5377 (45.5) | |
| 36 or more | 2640 (24.3) | 2477 (21.9) | 2245 (19.0) | |
| Degree | MD | 3250 (30.0) | 3953 (35.0) | 4080 (34.5) |
| MD-PhD | 1240 (11.4) | 1191 (10.5) | 1095 (9.3) | |
| PhD | 6359 (58.6) | 6162 (54.5) | 6647 (56.2) | |
| Gender | Men | 6034 (55.6) | 6010 (53.2) | 5766 (48.8) |
| Women | 4815 (44.4) | 5296 (46.8) | 6056 (51.2) | |
| Under-Represented Minority | Not URM | 9756 (89.9) | 9977 (88.2) | 10248 (86.7) |
| URM | 1093 (10.1) | 1329 (11.8) | 1574 (13.3) | |
| Submitted K Application | Yes | 1862 (17.2) | 2386 (21.1) | 2561 (21.7) |
| PI on K Award | Yes | 1298 (12.0) | 1498 (13.2) | 1391 (11.8) |
| Submitted R01 Application | Yes | 3278 (30.2) | 2903 (25.7) | 2028 (17.2) |
| PI on R01 Award | Yes | 1837 (16.9) | 1538 (13.6) | 900 (7.6) |
Among all participants, 4,275, or 13%, served as PI on an R01-equivalent award during follow-up. Table 3 shows characteristics according to under-represented minority status. URM matriculants were more likely to be women and to be age 36 years or higher on matriculation; during follow-up they were just as likely to submit K applications and receive K awards, but were less likely to submit an R01 application or receive an R01 award (as PI).
Table 3: T32 Participant Characteristics According to Under-represented Minority (URM) Status
| Characteristic/URM | Not URM | URM | |
| Total N (%) | 29981 (88.2) | 3996 (11.8) | |
| Age (years) at Matriculation | 30 or less | 10121 (33.8) | 1318 (33.0) |
| 31 to 35 | 13496 (45.0) | 1680 (42.0) | |
| 36 or more | 6364 (21.2) | 998 (25.0) | |
| Gender | Men | 15922 (53.1) | 1888 (47.2) |
| Women | 14059 (46.9) | 2108 (52.8) | |
| Degree | MD | 9844 (32.8) | 1439 (36.0) |
| MD-PhD | 3224 (10.8) | 302 (7.6) | |
| PhD | 16913 (56.4) | 2255 (56.4) | |
| Submitted K Application | Yes | 5967 (19.9) | 842 (21.1) |
| PI on K Award | Yes | 3688 (12.3) | 499 (12.5) |
| Submitted R01 Application | Yes | 7338 (24.5) | 871 (21.8) |
| PI on R01 Award | Yes | 3882 (12.9) | 393 (9.8) |
Time to First Competing R01 Award: Under-represented Minority Status, Age, and Gender
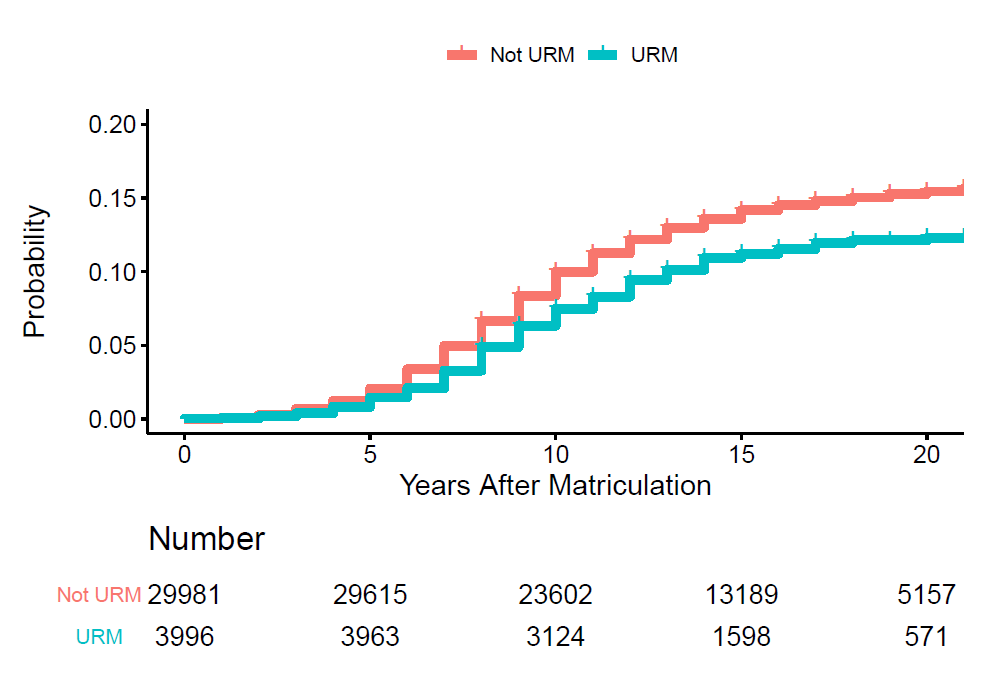
Figure 1 shows that non-URM matriculants were supported as PI’s at a greater rate than URM matriculants.
Figure 1: Time to first R01 award according to under-represented minority (URM) status
Figures 2 and 3 show that for both non-URM and URM matriculants, those who matriculated into post-doctoral programs after age 35 had a lower rate of serving as PI on an R01 award.
Figure 2: Time to first R01 award according to age among those not of under-represented minorities (URM)
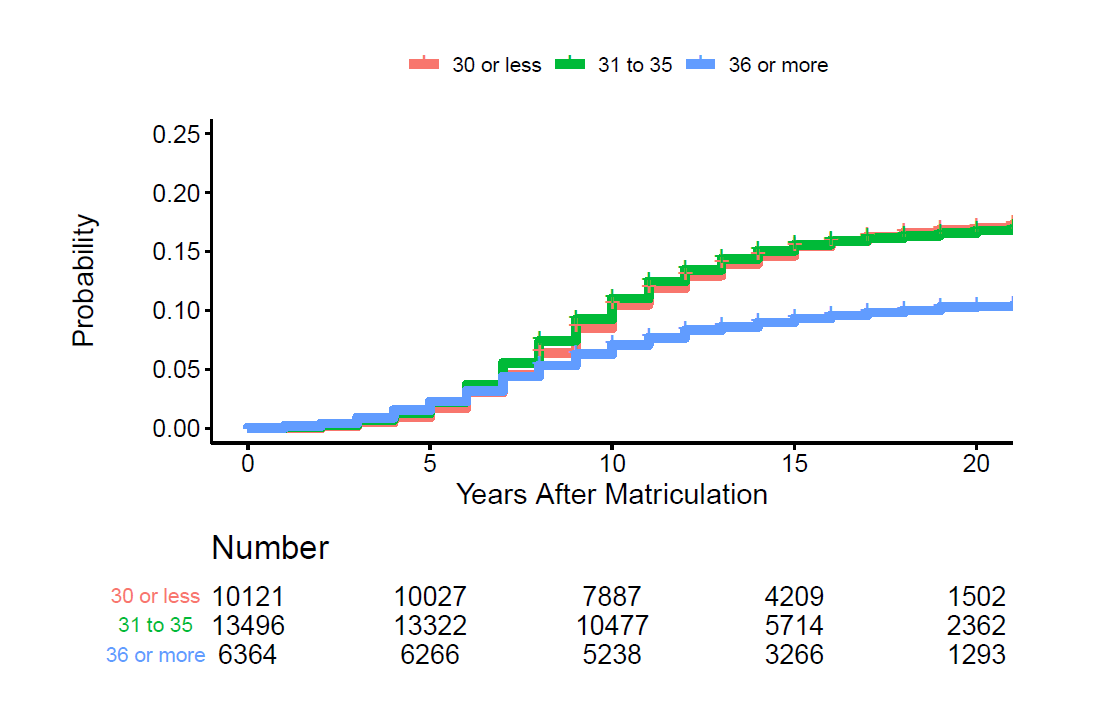
Figure 3: Time to first R01 award according to age among under-represented minorities (URM)
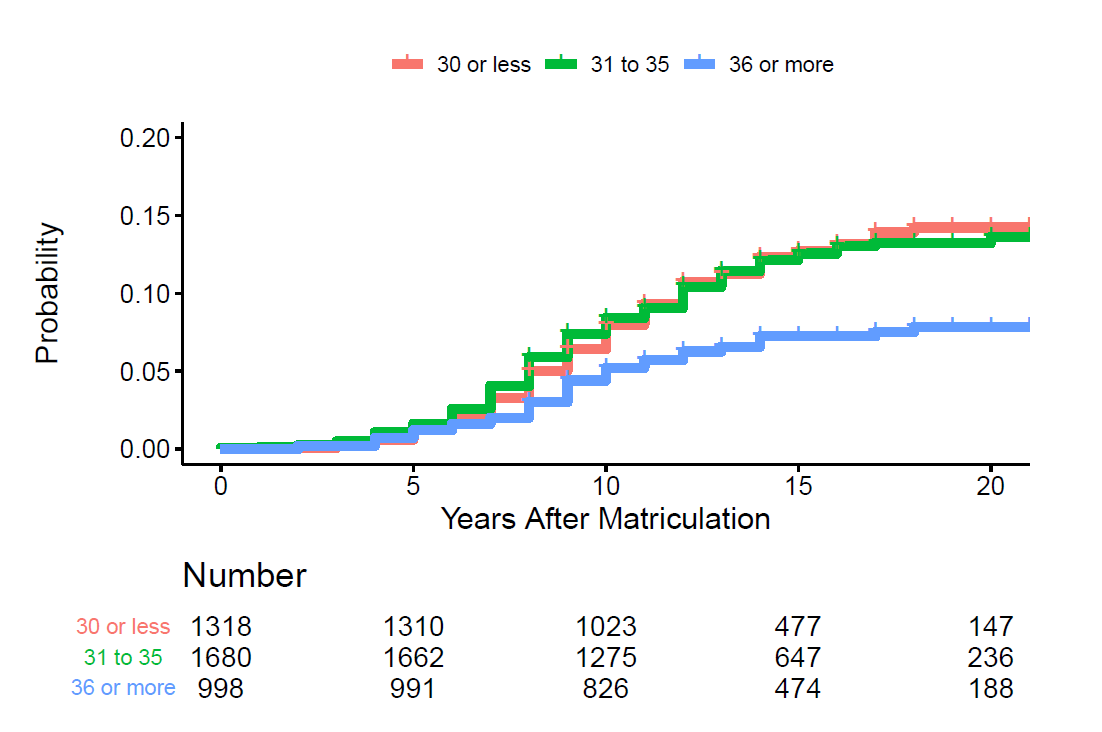
Figure 4 shows the combined associations of URM status and gender with rate of receiving an R01 award; female gender and URM status were associated with lower rates of R01 awards.
Figure 4: Time to first R01 award according to under-represented minority (URM) status and gender
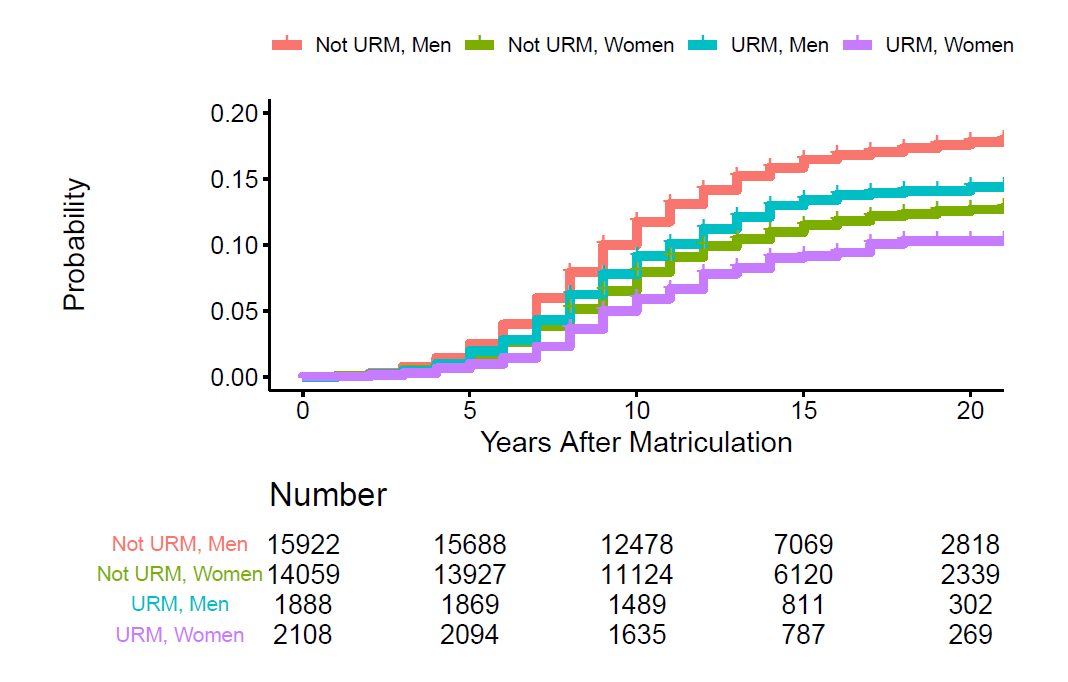
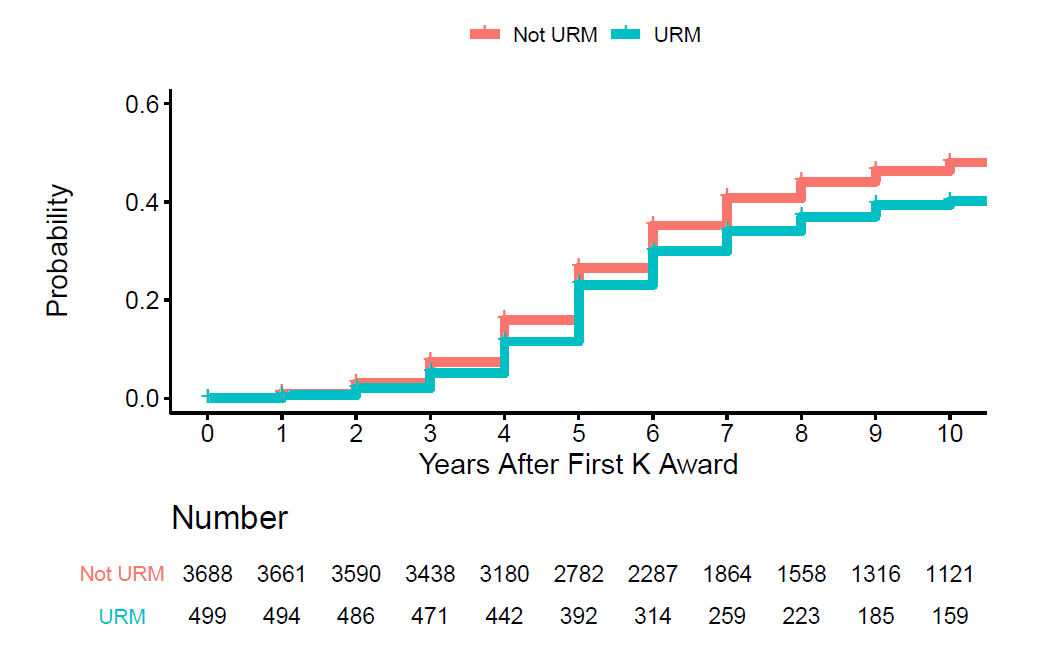
Figure 5 shows that among those trainees who received a K-award, non-URM K-awardees were more likely to be a PI on an R01 award sooner.
Figure 5: Time to first R01 award from first K award according to under-represented minority (URM) status
Multivariable analyses
Table 4 shows a Cox proportional hazards model for time to R01 award. The analyses show adjusted associations of age, gender, degree type, matriculation cohort, and K-award (as a time-dependent covariate) with time to award. Men, recipients with MD-PhD degrees, non-URM matriculants, and recipients of K awards were more likely to become PI’s on R01 awards in less time. The model focuses on those 32,739 participants with at least 8 years of follow-up (since few R01 awards were issued earlier, leading to a violation of the proportional hazards assumption). By bootstrap validation the model performed well with an optimism-corrected concordance statistic of 0.786 (where a value of 1 would imply perfect discrimination and a value of 0.5 would imply that the model performs no better than chance).
Table 4: Cox Proportional Hazards Model for First Competing R01 Award among T32 Post-doctoral Matriculants for Those with at Least 8 Years of Follow-up
| Predictor | HR (univariable) | HR (multivariable) | |
| Age (years) at Matriculation | 30 or less | – | – |
| 31 to 35 | 0.92 (0.85-1.00, p=0.059) | 0.82 (0.75-0.89, p<0.001) | |
| 36 or more | 0.46 (0.41-0.52, p<0.001) | 0.45 (0.39-0.51, p<0.001) | |
| Degree | MD | – | – |
| MD-PhD | 2.15 (1.91-2.42, p<0.001) | 1.67 (1.48-1.88, p<0.001) | |
| PhD | 1.27 (1.16-1.39, p<0.001) | 2.01 (1.84-2.21, p<0.001) | |
| Post-Doctoral Cohort | 1995-1999 | – | – |
| 2000-2004 | 1.02 (0.94-1.12, p=0.585) | 0.99 (0.91-1.08, p=0.833) | |
| 2005-2009 | 0.93 (0.84-1.04, p=0.225) | 0.91 (0.81-1.02, p=0.090) | |
| Gender | Women | 0.71 (0.66-0.77, p<0.001) | 0.70 (0.64-0.75, p<0.001) |
| Under-Represented Minority | URM | 0.84 (0.74-0.95, p=0.007) | 0.83 (0.73-0.94, p=0.004) |
| K Award (Time-Dependent) | Yes | 9.52 (8.82-10.27, p<0.001) | 10.58 (9.76-11.47, p<0.001) |
Summary
In these updated analyses of the outcomes of T32 post-doctoral trainees with MD, MD-PhD, and PhD degrees, we find that non-URM men had the highest rates for R01 application submission and award receipt (as PI). Women, and to a lesser extent, URM matriculants comprised a greater proportion of trainees over time; both women and URM matriculants had lower rates of R01 award receipt (as PI). Serving as PI on a K-awards predicted a substantially higher rate of later support as PI on R01 awards.
I am grateful to my colleagues in the NIH Office of Extramural Research (OER) Division of Biomedical Research Workforce and Division of Statistical Analysis and Reporting for their help collecting these data and conducting these analyses.
Can you please present the groups’ data separately? Then we can get at answers to the most obvious fundamental question here, i.e., does T32 experience close the gap identified in Ginther et al. 2011 and Hoppe et al. 2019 and if so, to what extent? It isn’t entirely clear but the N totals in Table 1 and Table 3 suggest you are including Asian PIs in the not URM data. So you’ve potentially included a group which suffers a funding disparity (Asian, as per Ginther) into the not URM group and a group which apparently does not (Hispanic, again, as per Ginther) into the URM category.
Hi Mike. Just to clarify, the blog we state, “URM status was known in over 95% of matriculants, and was defined as self-identification as Black, Hispanic, American Indian, or Pacific Islander or participation in an NIH diversity program.” So, no, Asians were not considered URMs except for Pacific Islanders.
My question was whether you included Asian applicants in the not-URM population. And I asked this in context of requesting better disaggregation of the various groups, especially given that the Ginther report shows clearly that collapsing all URM together and (if you did) including non-US doctorate Asian applicants in with “not-URM” is basically throwing noise into the analysis.
As we noted earlier, no, Asians were not considered URMs in this study except for Pacific Islanders.
So the question I have takes this analysis in the opposite direction… IE among R01 funded investigators, what proportion had a prior F32? Did applicants with a prior F32 have a higher success rate in R01 applications than those without a prior F32? Overall, the rate that F32 applicants are even applying for R01 funding seems astonishingly low to me (under 25% I think), and of them, not even half successfully get funded (if I am reading the charts correctly). On the other hand, anecdotally, I know many R01 funded investigators who were never F32 funded. I think the answers to these questions this gets to the issue of whether success in getting F32 funding predicts later success as an independent investigator for anyone no matter URM status.
.
I would like to know about any data regarding F32 funding and associations with R01 funding rates as well. Could someone please answer this question? Thank you.
I’m struck by two observations.
1. Training of URM scientist is slowly trending upward but clearly reflects challenges in equity that we have not overcome. We have work to do to develop URM scientists who become RO1 funded .
2. The number of URM that become T32 fellows is alarmingly small. Training efforts that address this inequity are needed to bring future URM scientists into the profession.
I ask the community:
Are current funding and training mechanisms (ie. administrative diversity supplements) sufficient to address this?
If not, what new mechanisms are needed to address this challenge?
Mike, thanks for the data and the transparency.
Is the granular data used for this publicly available or available upon request?
We currently do not publicly report further disaggregated data for this analysis beyond what is provided here. You may submit a Freedom of Information Act (FOIA) request to NIH for any responsive records. Please note that we may withhold information to protect the personally identifiable information of our supported investigators, as well as do not create new records as a result of a particular FOIA request.
Do you do analyses by disability status or did I miss it? Scientists with disabilities are under-represented as far as I am aware
We are preparing new statistics on the demographics of principal investigators supported on research grants, including disability status. In the meantime, you may find this public report helpful (available via the NIH Data Book) which does discuss some data related to disability status: https://report.nih.gov/sites/report/files/docs/NIH_Principal_Investigators_by_Gender_Race_Ethnicity_and_Disability_2016-2020_02_23_2021_PDF.
Has there ever been any attempt to parse out what percentage of the Hispanic group are Europeans directly from Spain vs. people from Latin America? I am concerned that the true level of under representation is being hidden by the way this term is defined in the federal guidelines.
We do not have data available to directly address this question. For reference, we do use the 1997 Office of Management and Budget definition for “Hispanic” (https://obamawhitehouse.archives.gov/omb/fedreg_1997standards).
I understand that the NIH has to follow the federal definition* on the data collection forms, but I would respectfully suggest that the NIH consider ways that it can drill down in to this category. Given the very small percentage of people in the category overall and the large number of scientists who come from Western Europe, which includes people from Spain, it seems an important distinction when understanding and/or addressing the extent of true under representation.
*– Hispanic or Latino. A person of Cuban, Mexican, Puerto Rican, Cuban, South or Central American, or other Spanish culture or origin, regardless of race. The term, “Spanish origin,” can be used in addition to “Hispanic or Latino.”
Thank you, NIH for publishing this, but I also feel like NIH needs to update its definitions, even if the federal definitions stay the same. In that document from 1997 that was mentioned in this conversation, requests to include a separate ethnicity category for middle eastern, for example, was denied (on what basis, I don’t know), and they consider them “white!” While, we all know people from the middle east or north Africa are truly a minority group and are not treated as white people. Doesn’t it sound like an issue? So, I believe some URMs are not in the right category in this report.
Would you please add more detail to how you defined Hispanic? Did that include those who self-identify as having European Spanish origin?
Similarly to how you have appropriately separated Pacific Islanders from Asian groups, Hispanic is not one homogenous group, particularly when adding those of direct Spanish origin.
In examining Hispanic/Latinx related equity, I encourage operationalizing URMs as those who are persons excluded because of their ethnicity or race (PEERs). For example, how are T32 Mexican-Americans and Puerto Rican, two of the largest US Hispanic/Latinx groups, fellows fairing?
We use the 1997 Office of Management and Budget (OMB) definition for “Hispanic” (https://obamawhitehouse.archives.gov/omb/fedreg_1997standards) These OMB standards are for data collection on race and ethnicity that must be used by all federal agencies, including NIH.
One thing that is very striking is how poorly the MD only folks do, compared with MD/PhD and PhD. This is one reason that NIDDK is shifting away from the T32 model, as I understand it, which I think makes sense. As a former T32 director, the programs are often used to pay MD folks who really don’t have a strong commitment to science. Despite that, I am a strong advocate for physician-scientists (I am one myself), and MDs have traditionally done just about as well as PhDs when they do apply for R01. So it is important not to interpret these as suggesting that possible MD scientists don’t deserve support. IMO, we just need to find better ways.