
25 Comments
Introduction
Postdoctoral NIH T32 programs aim to provide select trainees with experience to enable successful career and research development. Here we present data on NIH career development, or K award, and R01 equivalent research grant outcomes of participants in post-doctoral T32 programs.
Cohorts
These analyses are based on the outcomes of 35,528 T32 post-doctoral participants (including 18,671 men and 16,857 women) who matriculated between 1995 and 2009, for whom we had data on age and gender, and who had received MD, MD-PhD, or PhD degrees. We followed them for designation as principal investigator (PI) on subsequent K and R01-equivalent awards (which we’ll refer to as R01 going forward) through 2017. Table 1 shows characteristics and high-level outcomes according to matriculation cohort. Over time, a greater proportion of matriculants were women.
Among all participants, 4,299, or 12%, served as PI on an R01-equivalent award during follow-up. Among the 4,236 who served as PI on a K award, 1,769, or 42%, later supported later served as PI on an R01-equivalent award. Conversely, among the 31,292 who were not PI’s on a K award, only 2,530, or 8%, later served as PI on an R01-equivalent award.
Table 2 shows characteristics according to gender. Men appointed to T32 programs were more likely to have MD or MD-PhD degrees. A greater proportion of men submitted K and R01 applications and received K and R01 awards during follow-up.
Time to First Competing R01 Award
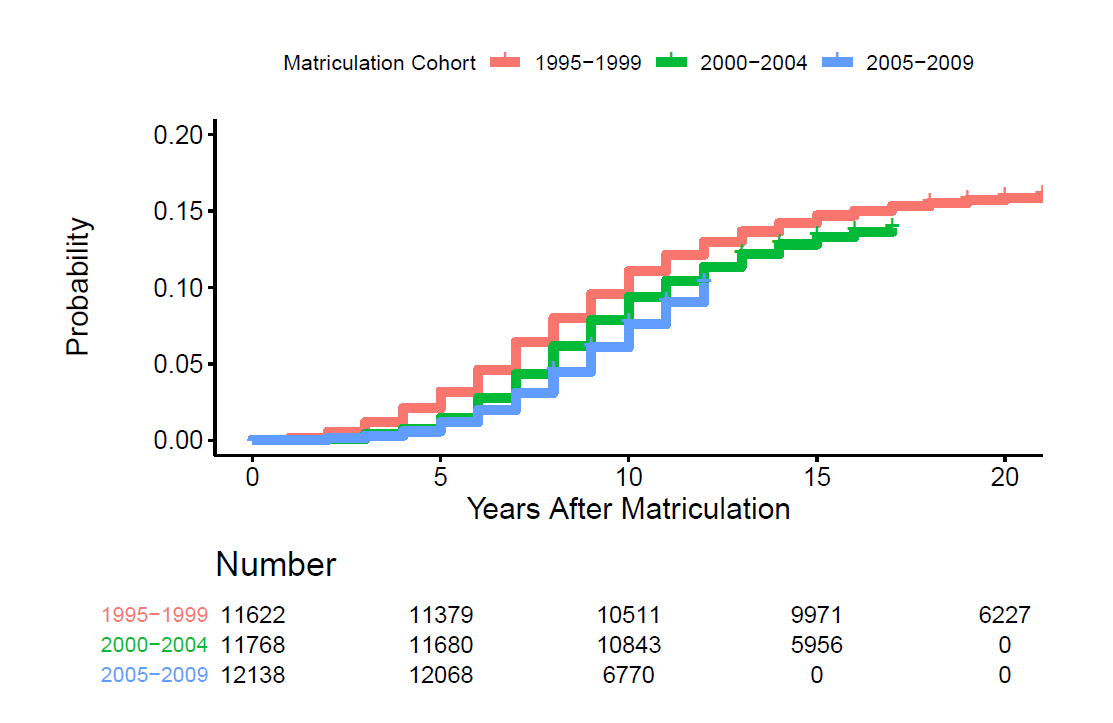
Figure 1 shows Kaplan-Meier event rates for time from T32 matriculation to time to serving as a PI on a first competing R01 award according to cohort. Those in the 2005-2009 cohort (meaning after the end of the NIH doubling) were less likely to eventually be a PI on an award. Figure 2 shows that recipients with MD-PhD degrees were PI’s on awarded grants at greater rates than those with PhD degrees, whereas those with MD degrees were PI’s on awards at the lowest rate. Figure 3 shows that men were supported as PI’s at a greater rate than women. Figures 4 and 5 show that for both men and women, those who matriculated into post-doctoral programs after age 35 had a lower rate of serving as PI on an R01 award.
Table 1: T32 Participant Characteristics According to Matriculation Cohort
| Characteristic/Cohort | 1995-1999 | 2000-2004 | 2005-2009 | |
| Total N (%) | 11622 (32.7) | 11768 (33.1) | 12138 (34.2) | |
| Age (years) at Matriculation | 30 or less | 3607 (31.0) | 3982 (33.8) | 4298 (35.4) |
| 31 to 35 | 5166 (44.5) | 5181 (44.0) | 5517 (45.5) | |
| 36 or more | 2849 (24.5) | 2605 (22.1) | 2323 (19.1) | |
| Degree | MD | 3559 (30.6) | 4161 (35.4) | 4243 (35.0) |
| MD-PhD | 1327 (11.4) | 1241 (10.5) | 1130 (9.3) | |
| PhD | 6736 (58.0) | 6366 (54.1) | 6765 (55.7) | |
| Gender | Men | 6440 (55.4) | 6271 (53.3) | 5960 (49.1) |
| Women | 5182 (44.6) | 5497 (46.7) | 6178 (50.9) | |
| Submitted K Application | Yes | 1898 (16.3) | 2423 (20.6) | 2602 (21.4) |
| PI on K Award | Yes | 1313 (11.3) | 1512 (12.8) | 1411 (11.6) |
| Submitted R01 Application | Yes | 3315 (28.5) | 2932 (24.9) | 2047 (16.9) |
| PI on R01 Award | Yes | 1844 (15.9) | 1546 (13.1) | 909 (7.5) |
Table 2: T32 Participant Characteristics According to Gender
| Characteristic/Gender | Men | Women | |
| Total N (%) | 18671 (52.6) | 16857 (47.4) | |
| Age (years) at Matriculation | 30 or less | 5774 (30.9) | 6113 (36.3) |
| 31 to 35 | 8752 (46.9) | 7112 (42.2) | |
| 36 or more | 4145 (22.2) | 3632 (21.5) | |
| Degree | MD | 6750 (36.2) | 5213 (30.9) |
| MD-PhD | 2530 (13.6) | 1168 (6.9) | |
| PhD | 9391 (50.3) | 10476 (62.1) | |
| Submitted K Application | Yes | 3846 (20.6) | 3077 (18.3) |
| PI on K Award | Yes | 2386 (12.8) | 1850 (11.0) |
| Submitted R01 Application | Yes | 4845 (25.9) | 3449 (20.5) |
| PI on R01 Award | Yes | 2662 (14.3) | 1637 (9.7) |
Transition Time from First K to First R01 Award
Figure 6 shows corresponding Kaplan-Meier event rates for time from first K award to first competing R01 award according to matriculation cohort. Participants in later cohorts became PI’s on R01 awards more quickly. Figure 7 shows that those with PhD and MD-PhD degrees served as PI’s on R01 awards sooner than those with MD degrees. Figure 8 shows that men were more likely to be a PI on an R01 award sooner.
Multivariable analyses
Table 3 shows a Cox proportional hazards model for time to R01 award. The analyses show adjusted associations of age, gender, degree type, matriculation cohort, and K-award (as a time-dependent covariate) with time to award. Men, recipients with MD-PhD degrees, and recipients of K awards were more likely to become PI’s on R01 awards in less time. The model focuses on those 35,079 participants with at least 7 years of follow-up (since few R01 awards were issued earlier, leading to a violation of the proportional hazards assumption). By bootstrap validation the model performed well with an optimism-corrected concordance statistic of 0.784 (where a value of 1 would imply perfect discrimination and a value of 0.5 would imply that the model performs no better than chance).
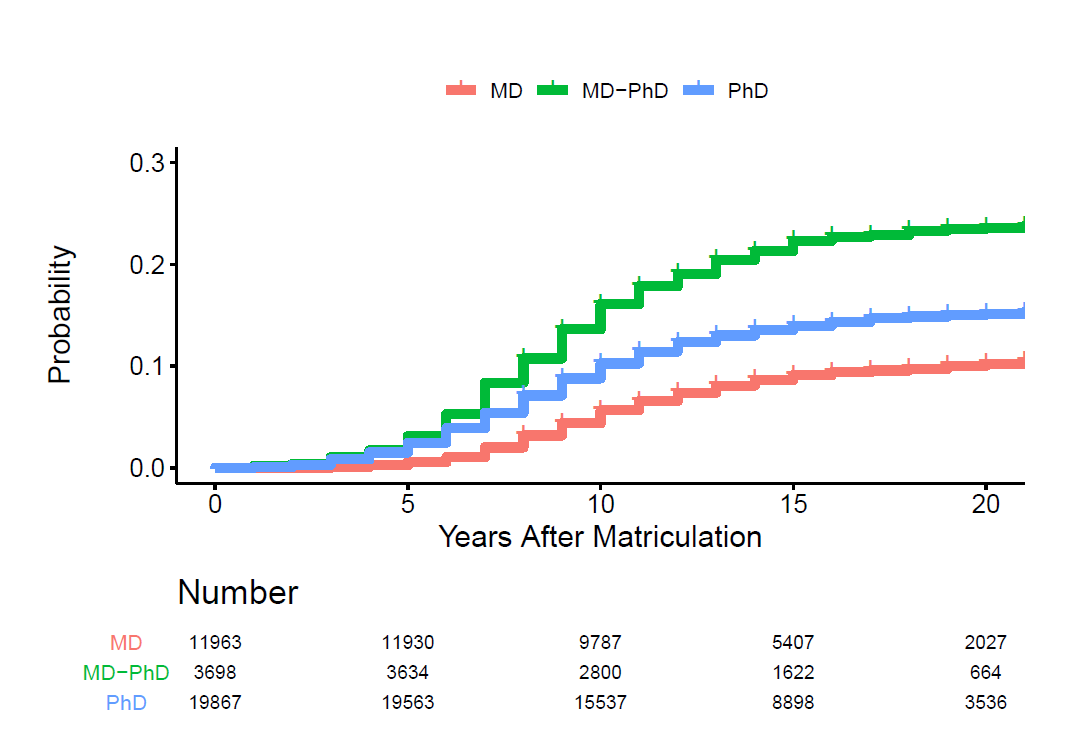
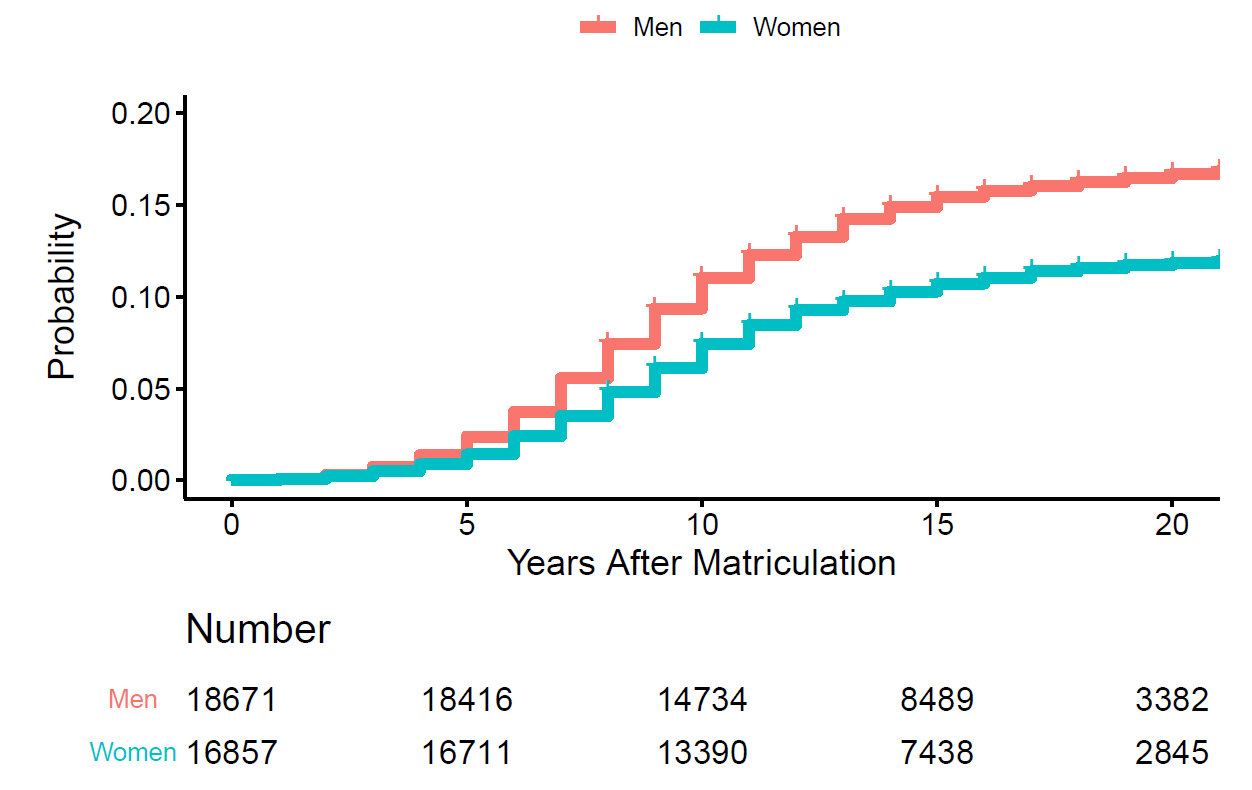
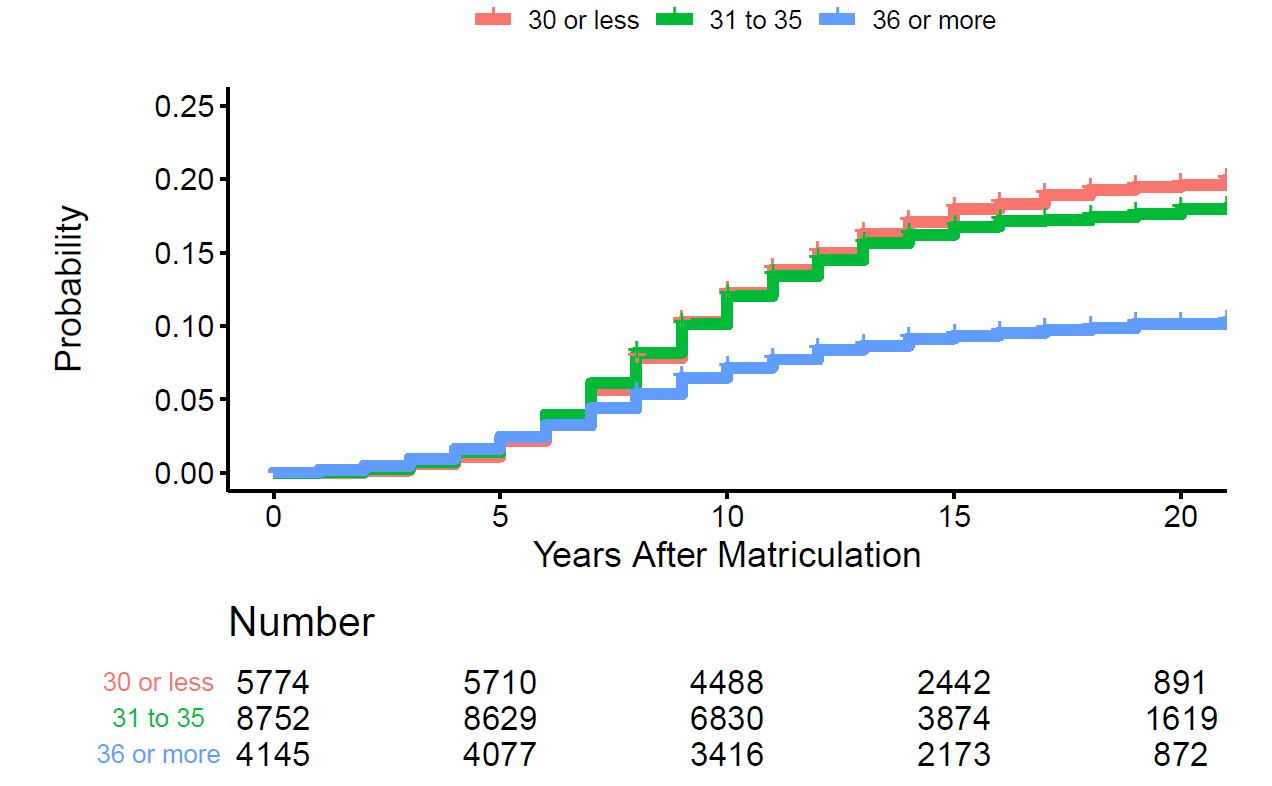
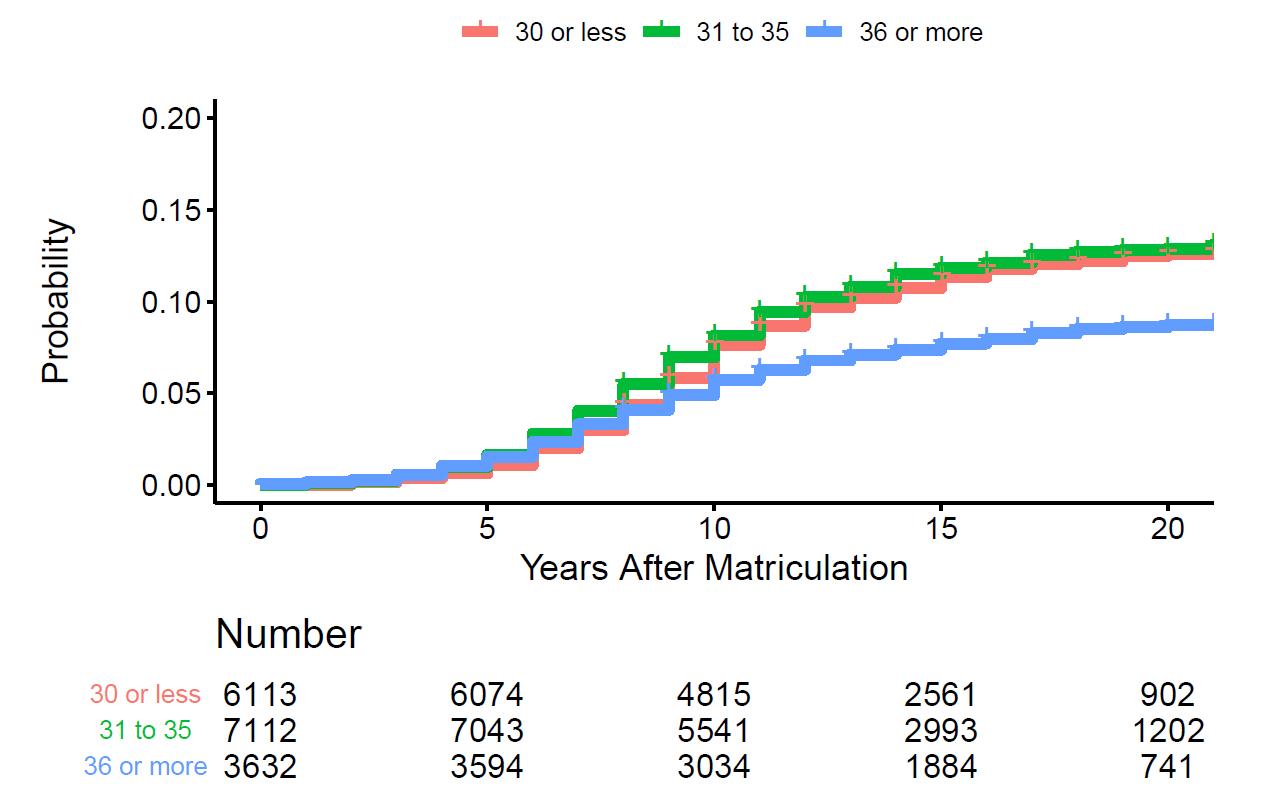
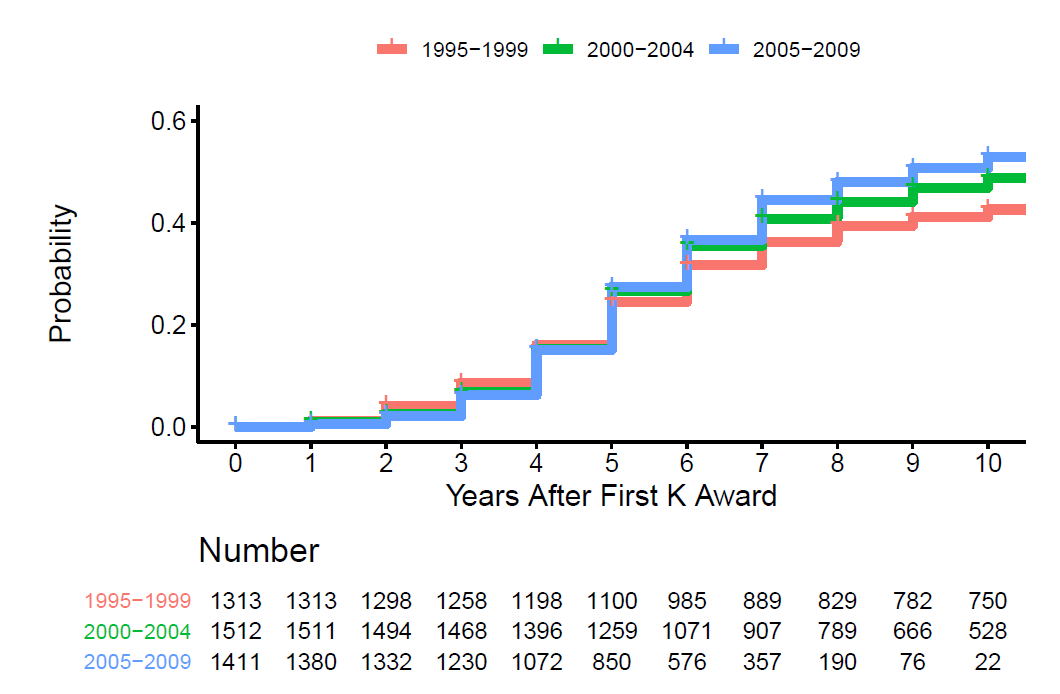
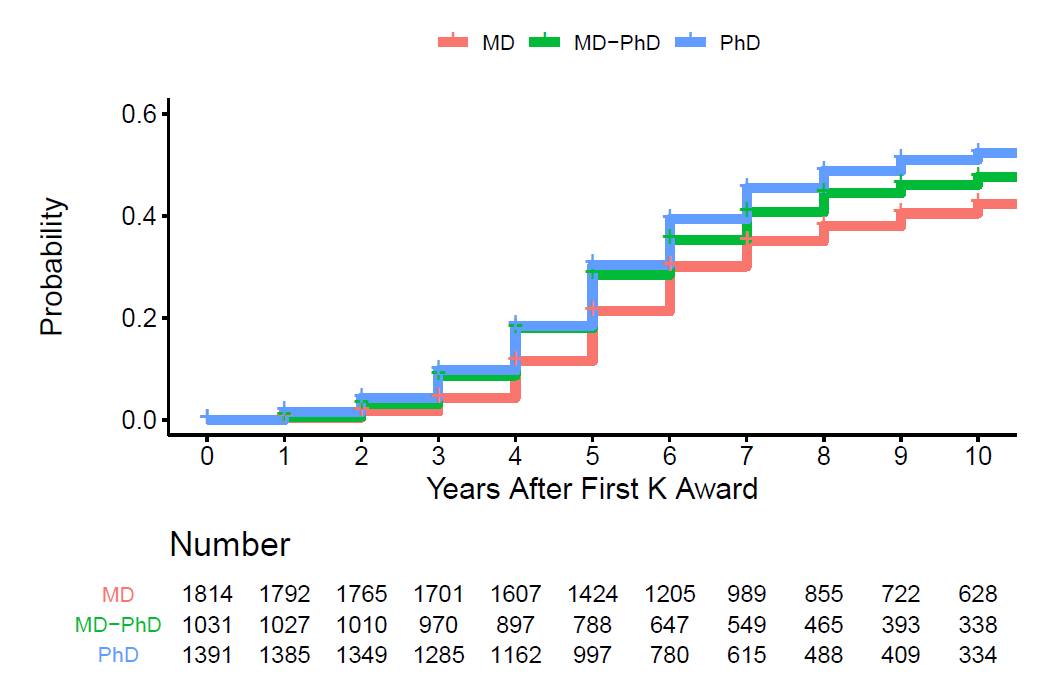
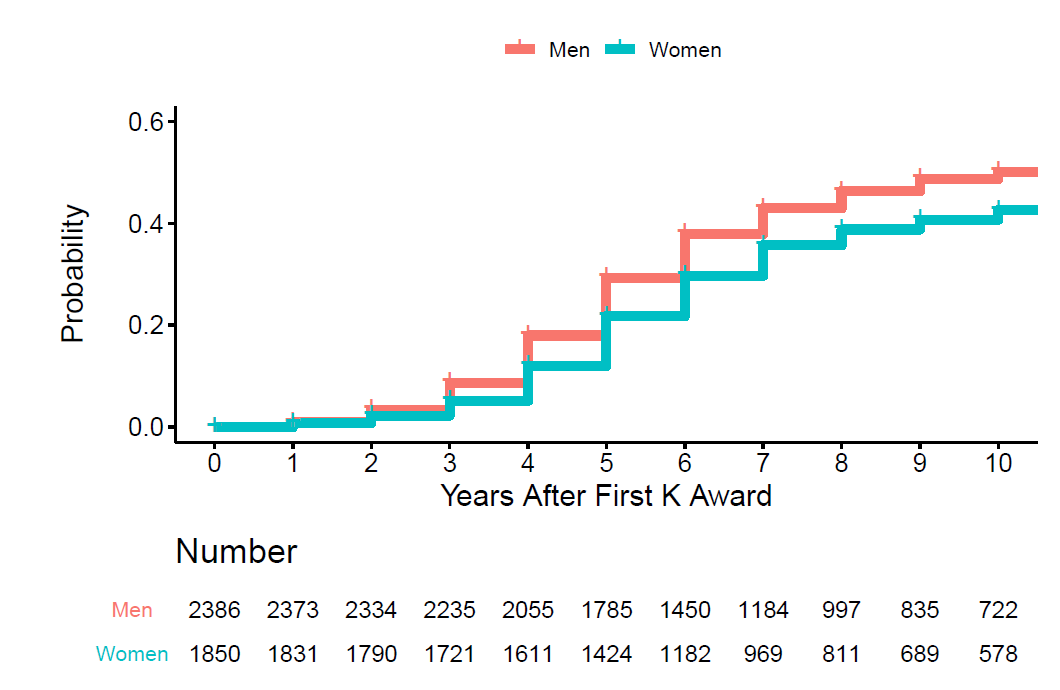
Table 3: Cox Proportional Hazards Model for First Competing R01 Award among T32 Post-doctoral Matriculants for Those with at Least 7 Years of Follow-up
| Predictor | HR (univariable) | HR (multivariable) | |
| Age (years) at Matriculation | 30 or less | – | – |
| 31 to 35 | 0.96 (0.89-1.03, p=0.240) | 0.84 (0.78-0.91, p<0.001) | |
| 36 or more | 0.49 (0.44-0.55, p<0.001) | 0.46 (0.41-0.52, p<0.001) | |
| Degree | MD | – | – |
| MD-PhD | 2.33 (2.10-2.60, p<0.001) | 1.78 (1.60-1.99, p<0.001) | |
| PhD | 1.34 (1.23-1.45, p<0.001) | 2.05 (1.89-2.24, p<0.001) | |
| Post-Doctoral Cohort | 1995-1999 | – | – |
| 2000-2004 | 1.02 (0.95-1.11, p=0.558) | 0.97 (0.90-1.05, p=0.458) | |
| 2005-2009 | 0.89 (0.81-0.99, p=0.025) | 0.84 (0.77-0.93, p=0.001) | |
| Gender | Women | 0.69 (0.64-0.74, p<0.001) | 0.68 (0.64-0.74, p<0.001) |
| K Award (Time-Dependent) | Yes | 9.42 (8.79-10.10, p<0.001) | 10.27 (9.54-11.05, p<0.001) |
Summary
In these analyses of the outcomes of T32 post-doctoral trainees with MD, MD-PhD, and PhD degrees, we find that men with MD-PhD degrees had the highest rates for R01 application submission and award receipt (as PI). Women comprised a greater proportion of trainees over time. Serving as PI on a K-awards predicted a substantially higher rate of later support as PI on R01 awards.
I am grateful to my colleagues in the NIH Office of Extramural Research (OER) Division of Biomedical Research Workforce and Division of Statistical Analysis and Reporting for their help collecting these data and conducting these analyses.
I’d love to see the K award analysis separated into those available to PhDs and those only available to MD/PhDs–in other words how much of the success in moving on to an R01 is driven by the increased success of MD/PhDs?. Specifically, did having a K99 increase likelihood of getting an R01–early data from NIGMS suggested otherwise, if my memory is correct
Race/ethnicity does not seem to have been considered in the analyses? While data may have been sparse for these groups, it would be helpful to add this variable to the descriptive table.
Completely agree. I was waiting to see the race/ethnicity breakdown.
me, too.
I also wonder why race/ethnicity was not included.
Another ditto for this — I was specifically looking for the race breakdown, because we need to understand whether the K program does not do as well for URM candidates.
As usual, this is a fascinating analysis. As an MD only scientist who does primarily laboratory research, this does support my priors in suggesting the value to society in the MSTP programs. On a somewhat tangential, but related note, I am just devastated that the NIH has decided to stop supporting the Biomedical Workforce Dashboard (https://report.nih.gov/bmwdashboard/). This was an invaluable resource that we had used to measure our programs against national averages. The statement that comparable reports are under development…seems disingenuous.
Is there any way to look at rate of publication as well?
These data reflect that it is almost impossible for a clinician to do research anymore. NIH is probably happy about that.
For me, I am with Joni Mitchell: “Don’t it always seem to go, That you don’t know what you got ’til it’s gone”
PhDs CANNOT understand everything that an MD can understand but an MD CAN understand everything that a PhD can understand.
I disagree, it goes both ways. An MD cannot understand “everything” like a PhD cannot understand ” everything” either — team science 🙂
I’m an MD PhD and there are innumerable things that PhDs understand that I do not. I rely upon them continuously to keep my basic science/animal models/statistical analyses/knowledge of past literature well grounded. But yes, there is a clinical understanding about specific diseases that requires an MD touch, and usually an MD who still sees patients.
Definitely goes both ways.
This is such an elitist view and undermines the collaboration necessary for translational science.
I agree completely (and you were nicer than I would have been).
How do the success rates compare between T32-funded postdocs vs non-T32 funded postdocs? If there were no difference between the two groups, would that suggest the limited value of the T32 postdoc programs?
I’d like to see
a) the rate of success for K-award. Am I reading Table 1 correctly: It seems to suggest it is lower for the later cohort compared to the first one, and it is now 50%. Disheartening.
b) comparison group. that’s a more convincing proof that the T32 really helps these postdocs.
Perhaps I missed this… the conclusion is that being covered by a T32 postdoctoral grant or getting a K award is heavily positively correlated with getting R01-level funding… but are the comparisons fair – meaning, is it being taken into account the percentage of each type of trainee (e.g. T32 funded vs not) who is in a PI position and actively seeking an R01 (versus outside academia)? Are T32-funded and K awardees more likely to go into academia? Basically, are we comparing apples to apples?
My take is that you have people who were interested enough in research to take time for a T32…but then leave research. Yes, the MDs have a very attractive alternative in clinical work, but I would think the vast majority of this cohort had a strong attraction to research at some time. Some of them would realize that lifestyle is not for them and leave. But these data show that just that decision became far more likely once the NIH funding halved.
In summary I think these data show that a few thousand potential physician scientists (beyond the historical norms) were interested, then assessed the prospects during a year or two of T32 and decided it was not worth the added struggle and risk of the lower NIH budget and left research forever.
Wow–this is very helpful data. And wow, look at Figures 3 and 8! Those are quite troubling to consider how dramatic the disparity is regarding gender in terms of receiving R01 level funding. If I understand correctly, these plots effectively show that for a given level of previous funding (T32 recipients in Fig 3 and K recipients in Fig 8), there is both a shift in time to first R01 award and also a magnitude effect such that the total proportion of women to eventually get an R01 is also lower.
We all know this is an issue in science, but I have not seen data like this that controls for previous award history. I hope that data like this can help us think of ways to improve our mentoring of women scientists during the T and K phases, and also consider if improvements are needed in the peer review process if bias is being introduced there.
We’re looking at a decade +, some relevant updated info would be helpful. In a nice
way it would be helpful to list current info. It’s 2021. W M Foster
What about DVM-PhD ‘s?
NIH has explicitly developed transition mechanisms through K99 – R00. It would be interesting to see the success of this mechanism in achieving academic positions and subsequent R01 applications or equivalent. These applications are reviewed in a broad range of CSR committees and it is my experience the there is an incomplete understanding of their goals by reviewers
Great data. Thank you. I would love to see the same data for scientists who were not funded by a T32. I assume the NIH does not have such data.
Good point, I’d like to also know how many scientists work outside of government/academia/big corp funding. I know what the answer might be, but it would be interesting to know.
Great data and visualization. Thank you.
Do the T32 data include trainees funded by MSTP training grants?