
5 Comments
As highlighted in many previous blog posts and the recent National Academies of Sciences, Engineering, and Medicine (NASEM) report, promoting a strong biomedical workforce is a top priority for the NIH. In 2017, NIH launched the Next Generation Researchers Initiative, which is a multi-pronged approach to increase the number of NIH-funded early stage investigators. An important component of this initiative is the call for increased transparency and availability of data about the make-up of the biomedical research workforce. More complete data will allow NIH leadership to best understand and address the needs of our emerging workforce.
To this end, I would like to highlight a recently published study examining the demographics of the NIH workforce, conducted by my colleagues in the Office of Extramural Research, “Examining Trends in the diversity of the U.S. National Institutes of Health participating and funded workforce”.
This paper, which appeared in the Federation of American Societies for Experimental Biology (FASEB) Journal last month, examined representation according to career stage (new, early-stage, or experienced investigator), gender, ethnicity, and race of investigators identified on research applications and awards. This study focused on the time period between 2009, when NIH first implemented new and early stage investigator policies, and 2016.
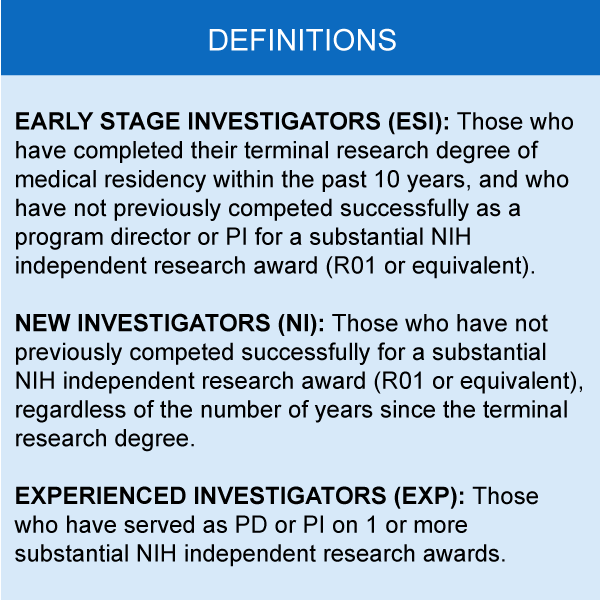
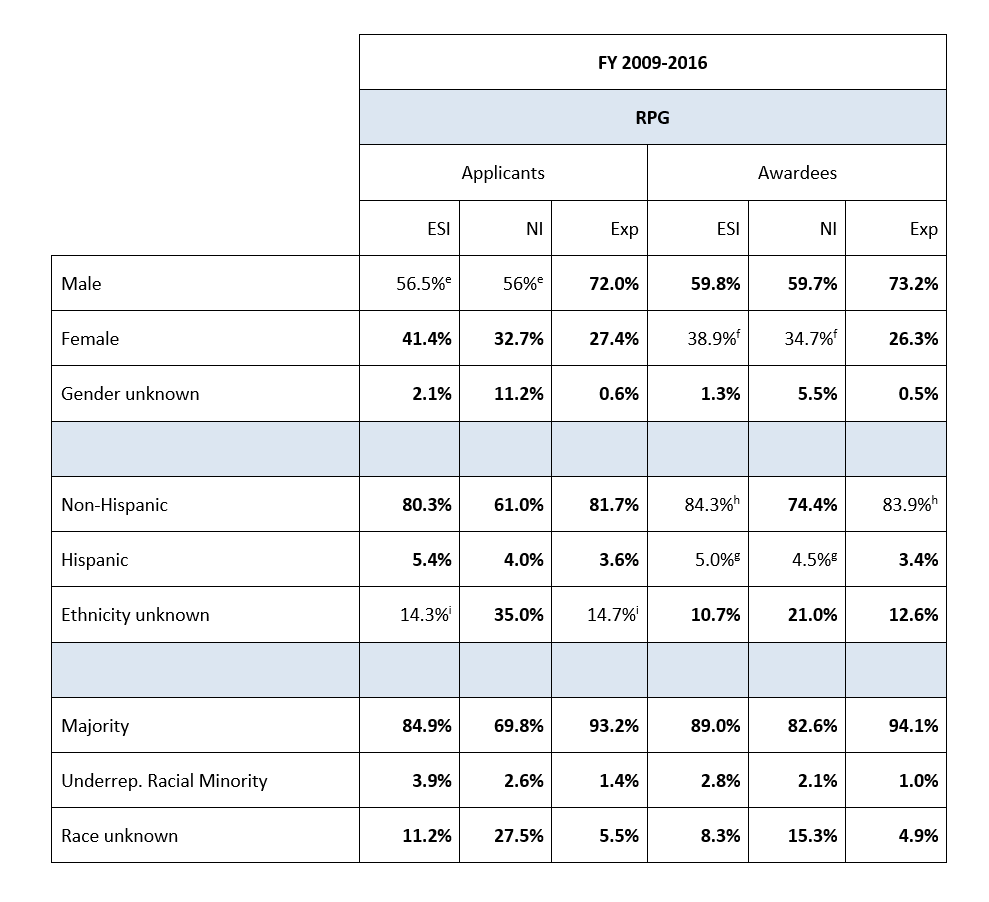
When looking at the data by career-stage, we see that women, underrepresented racial minority, and Hispanic researchers comprise a higher percentage in both the ESI and NI groups compared to the experienced investigator (Exp) group (Table 1). This suggests these groups could be disproportionately affected if resources for new and early-stage investigators decline. However, these data also highlight an opportunity for NIH to enhance the diversity of the biomedical workforce by increasing support for ESI and NI.
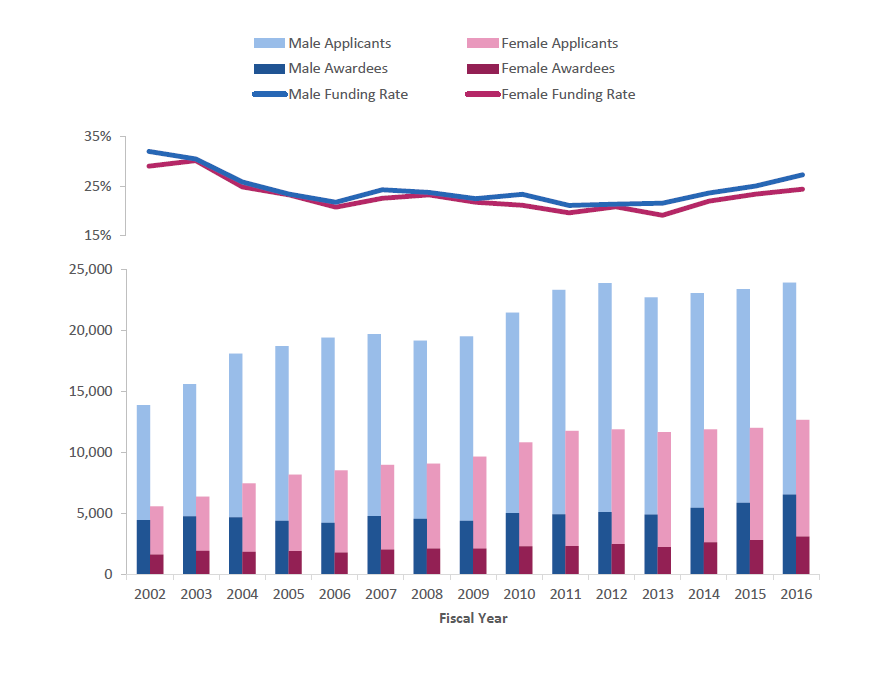
The funding rate for women is less than that for men (Figure 1). That said, compared with men, female researchers have shown a much larger percent increase in applications and awards over time.
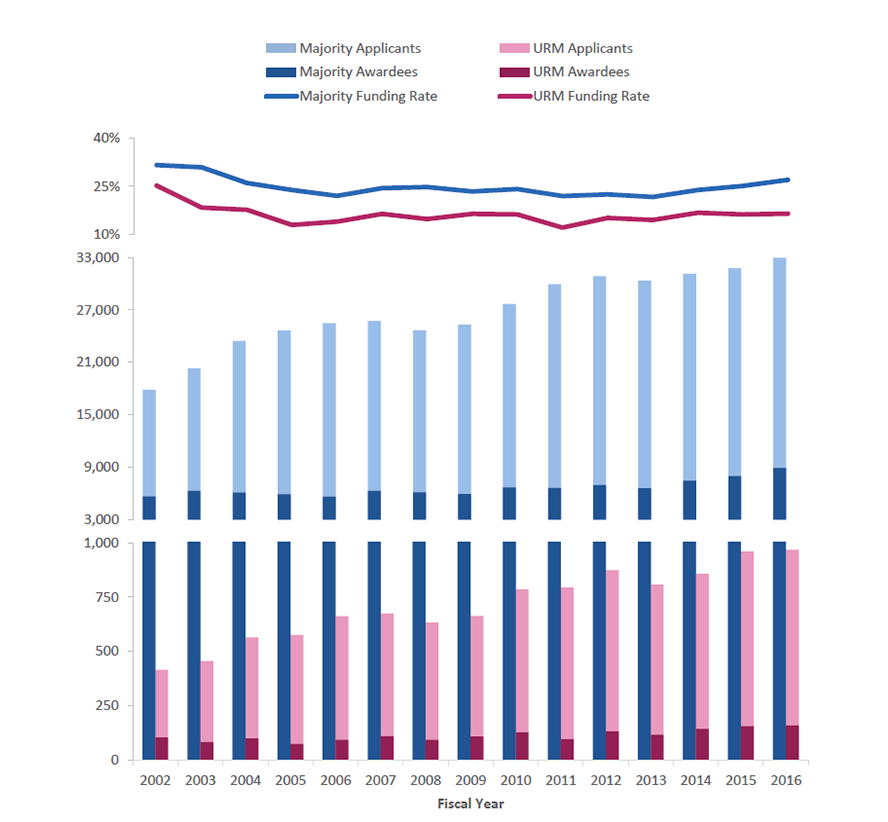
While applicants and awardees from underrepresented racial minority (URM) groups experienced a higher pace of growth than majority groups, their funding rate still remains substantially lower than that of the majority applicants (Figure 2).
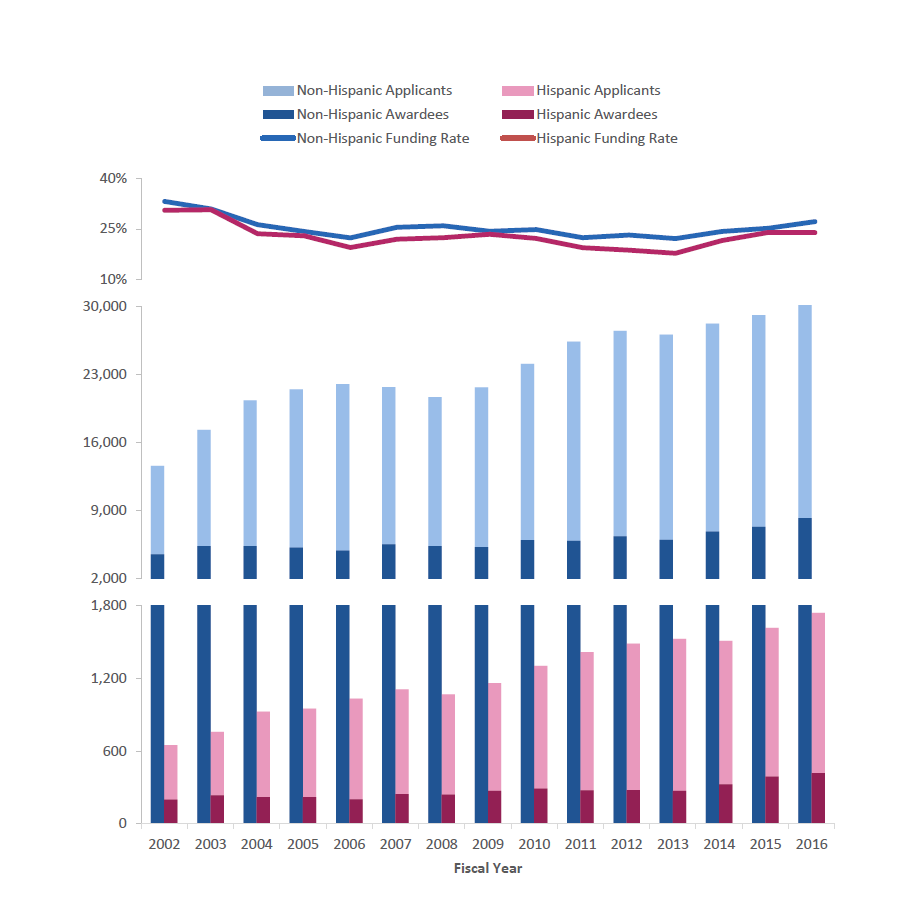
There was faster growth in Hispanic applicants and awardees compared with majority applicants and awardees with an encouragingly smaller gap in the funding rate (Figure 3).
While more work is needed to improve representation of NIH-funded women and nationally underrepresented minority investigators, we do see that the early stage and new investigator groups are much more diverse than the experienced investigator group.
This provides important evidence that funding of more early career investigators could help enhance the diversity of the NIH workforce.
For more information on Next Generation Researchers Initiative, related policies, and resources, check-out our webpage. I would like to acknowledge and congratulate Silda Nikaj, Deepshikha Roychowdhury, Kay Lund, Marguerite Matthews, and Katrina Pearson for their work on this publication.
In your data you divide the genders, and have a “gender unknown” category.
Are you including within this category, those that are Intersex, or identify as non-binary, or is everyone grouped in this category grouped based on “no data”? or basically has not ticked male or female?
When will you start allowing the recognition of intersex individuals in your statistics?
Interesting study, and shows disparities between URM funding rates. Are “Hispanics” actually URMs? If so, I assume this would be a majority Mexican-American population in the U.S. Or are investigators from Spain, Argentina, and non-URM hispanics included in that group? If these two groups are not separated it might obscure funding rates between two populations that face unique challenges in STEM fields.
What about those with disabilities? I am frustrated to see data and consideration about the barriers for researchers with disabilities left out of these efforts.
If Diversity Matters, Provide Data for Institutions and States
I applaud Michael Lauer and others at the NIH for keeping us appraised of disparities in success rates and funding rates for investigators grouped by age, race and gender. However, as recognized by senior NIH officials (e.g., Mol Biol Cell 26:1578), diversity in science also includes the regions in which it is conducted.
Open Mike noted (May 29, 2018) that grants are awarded to institutions, not investigators, and federal funding agencies have had a long-standing interest in allocations among states. Why, then, has the NIH (e.g., Open Mike) focused discussions on age, race and gender?
Recent articles in PLoS One (11:e0155876), PeerJ (4:e1917) and biorXiv (doi: 10.1101/367847) are germane to this issue. Disparities in success rates and funding rates are even greater among institutions and states than they are by age, race and gender.
NIH director Francis Collins has recognized that “the US biomedical research workforce does not currently mirror the nation’s population demographically” and that “recruiting and retaining a diverse set of minds and approaches is vital to harnessing the complete intellectual capital of the nation” (PNAS 112:12240).
If the NIH is truly interested in promoting the diversity of the scientific workforce, it should release success rate and funding rate data for institutions and states. With such data in hand, scientists at-large could help director Collins (and others at the NIH) better harness the “complete intellectual capital” that exists throughout the United States.
This was my first thought as well. My own experiences raised questions about institutional biases in the review process (and, perhaps, representation of reviewers). I would love to see a similar analysis related to diversity of applicant institutions. How many applications and what is the funding rate for applications from small colleges, IDEA-eligible states, national regions, historically black colleges, non-profit organizations, and non-profit health systems?