A few weeks ago, we touted the value of the NIH’s Research, Condition, and Disease Classification (RCDC) system to give us consistent annual reporting on official research budget categories and the ability to see trends in spending over time. RCDC’s robust scientific validation process, which allows for such consistency, provides public transparency into over 280 different NIH budget categories.
RCDC categories do not encompass all types of biomedical research. So, how can we get this type of data for other research areas that are not encompassed in RCDC categories, especially those which are newly emerging fields? Are we able to use the same thesaurus-based classification system to explore other research trends?
RCDC’s algorithms may be leveraged to follow scientific topics as they evolve. We can then evaluate the resulting data to get a glimpse into scientific progress in those fields.
To demonstrate, let’s consider advanced gene editing. The field of advanced gene editing, which encompasses technologies like CRISPR/Cas9, ZFNs, and TALENs, has dramatically expanded since 2012. These recently developed technologies show promise for treating diseases as diverse as malaria and diabetes because they can precisely alter a gene’s sequence and function in a living organism.
Even though “Advanced Gene Editing” is not an official indexed RCDC category, we can still use the RCDC thesaurus to develop an unofficial category definition and retroactively apply it to NIH grant applications between fiscal years (FYs) 2008 to 2017. The resulting data acquired through this process, which we call “retrospective indexing,” can be evaluated and compared to the known timeline for the emergence of advanced gene editing as a research area.
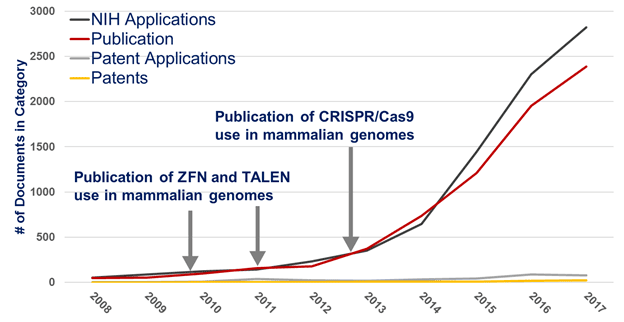
Figure 1 shows that the number of NIH applications seeking support for advanced gene editing research steadily increased after FY 2011 (black line). NIH made 1,200 total awards to this field in FY 2017 (data not shown). This represented an investment of over $500 million.

Not only can we get a glimpse into the number of applications, but we can apply this process to other document types as a marker of impact (e.g. using data on patents from the U.S. Patent and Trademark Office as well as publications from PubMed). Similar to the number of applications, we observed a steady increase in the total number of all publications (regardless of NIH support) related to advanced gene editing from fewer than 200 in 2011 to a peak of nearly 2,500 in 2017 (red line).
The RCDC retrospective indexing method also appears to be yet another way to help us identify patents and publications in an emerging scientific field. In general, the number of patent applications (gray line) and awarded patents (yellow line) has also increased from 2008 to 2017, though slower than that seen for applications. This process identified 415 patent applications, of which 74 were awarded. Moreover, thirteen advanced gene editing patents cited NIH support directly in the application. And, finally, 59 advanced gene editing patents cited publications in their applications which directly acknowledged NIH support.
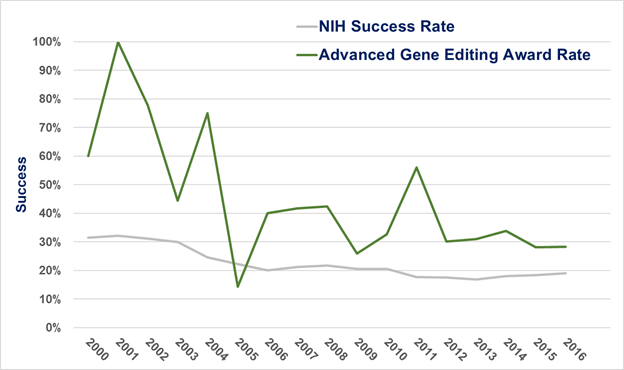
Next, we looked at the success rates for applications that focused on advanced gene editing. Figure 2 shows that the success rate for these applications (green line) over time was generally higher than the overall success rate for all applications submitted to NIH for funding (gray line). Check out this post for more information on NIH’s success rate for your reference.

This case study demonstrates that the current RCDC thesaurus can be used as a resource to assess research measures, such as applications, funding, patents, and publications. Though this is not meant as a supplement for official categorical reporting, it does provide information on research support that the funding NIH Institutes and Centers can review when setting priorities and forecasting research trends. Furthermore, when put in context with other research outputs, like patents and publications, we can gain a better understanding of the impact of NIH funding in both established research areas and those burgeoning areas that we are just beginning to comprehend.
I would like to acknowledge Agnes Demianska, Julio Pineda, Kirk Baker, Judy Riggie, Richard Ikeda, Brian Haugen, and Cindy Danielson with the Office of Extramural Research for their work on this project.


0 Comments