
6 Comments
Earlier this year we reported on the unique numbers of research project grant (RPG) awardees and applicants each year since the end of the NIH doubling, in 2003. We described how the number of unique RPG awardees has remained relatively constant, while the number of applicants (as assessed over 5-year windows) has steadily and markedly increased.
A number of readers asked us about the prior NIH-supported research training and career development of these investigators. Among RPG awardees, what proportion had received prior fellowship, training, or career development (F, T, or K) awards? And perhaps of greater interest, among unsuccessful, unfunded applicants, what proportion had received prior fellowship, training or career awards?
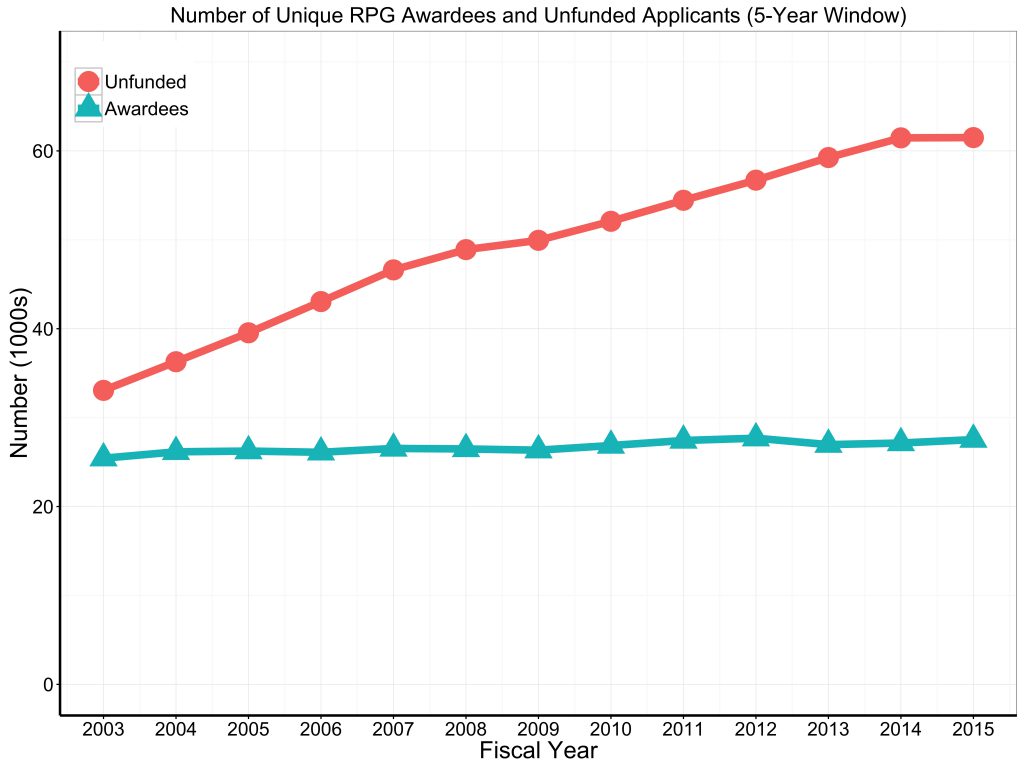
To answer these questions, we start with a quick recap. Figure 1 shows the same data that we showed before, but slightly differently. The green-triangle line shows the number of unique RPG awardees for each fiscal year. The orange-circle line shows the number of unique unsuccessful, unfunded applicants, as in the last blog, over a five-year window prior to each fiscal year in the Y-axis. We see that the number of unique awardees has remained relatively stable since 2003, while the number of unique unfunded applicants has increased substantially.
Next we’ll look at the percentage of these unique RPG awardees and unfunded RPG applicants who previously received support from fellowship, training, or career awards. Figure 2 shows the proportions of unique awardees and unfunded applicants who had prior F awards. Over time, awardees included a greater proportion of prior F recipients. The proportions for awardees and unfunded applicants have decreased, but the decrease has been steeper among unfunded applicants.
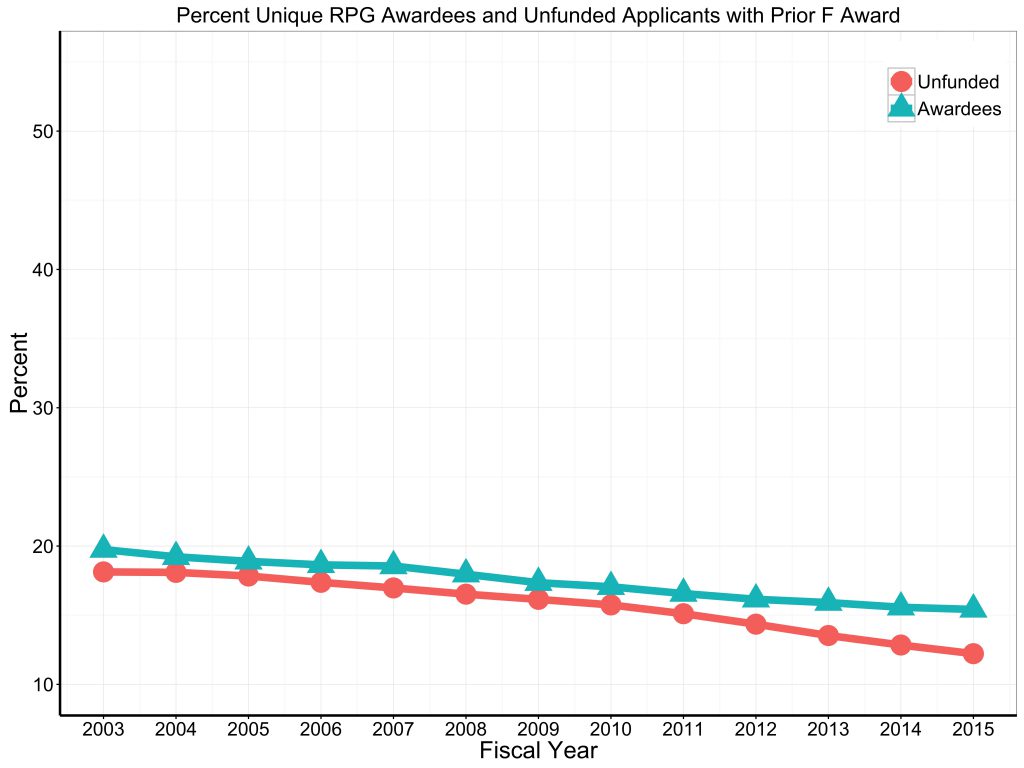
Figure 3 shows the proportions of unique awardees and unfunded applicants who were previously supported off of a T award. Over time, the proportion of awardees who were prior T recipients increased slightly, whereas the proportion of unfunded applicants with prior T award support decreased. In recent years, RPG awardees were more likely than unfunded applicants to have been previously supported off of a T award.
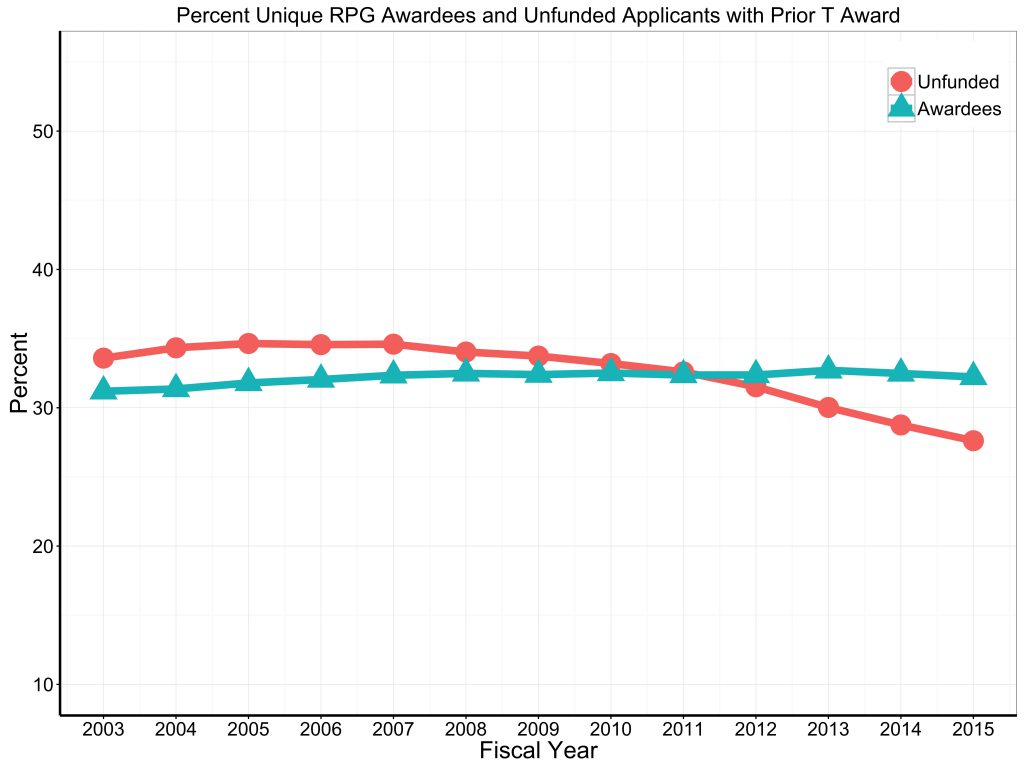
Figure 4 shows the proportions of unique awardees and unfunded applicants who had prior K awards. Over time, the proportion of awardees who were prior K recipients increased, whereas the proportion of unfunded applicants with prior K awards increased to a lesser degree. Furthermore, since RPG awardees were more likely than unfunded applicants to have received prior K awards.
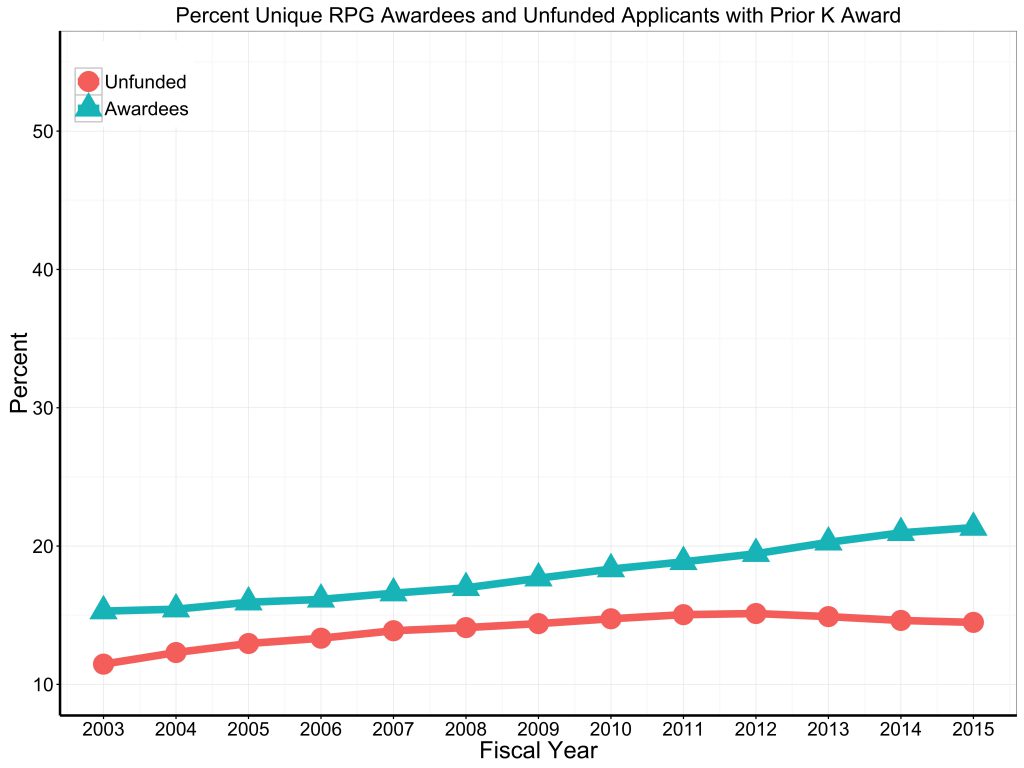
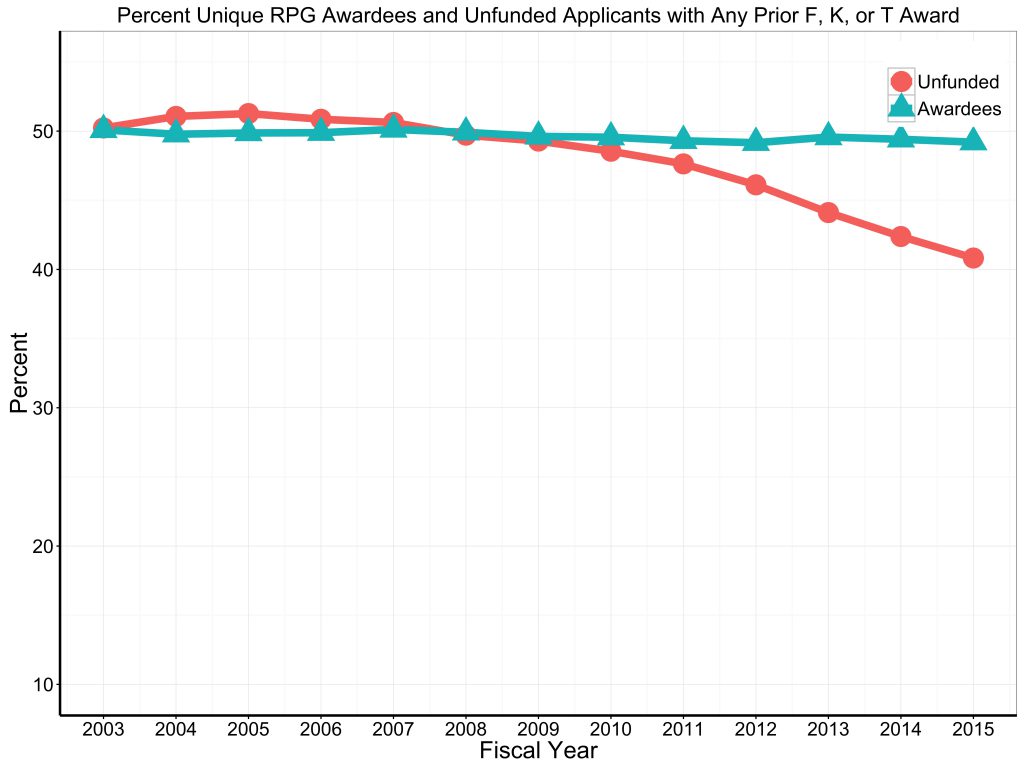
Figure 5 puts our data together, showing the percentage of awardees and unfunded applicants who had any prior fellowship, training or career award (note that some had received more than one prior award – here we look at whether they received any prior award at all). Since 2003, approximately half of all RPG awardees had received or been supported by at least one prior F, T, or K award, and the proportion has remained stable. However, among unfunded applicants, we find that the proportion with prior F, T, or K awards has substantially declined, from approximately 51% to just over 40%.
These findings suggest that with the advent of hyper-competition, successful awardees are more likely to have received prior training or career awards. Others have previously discussed the value of training and career development awards. Several years ago, an evaluation report of NIH individual mentored career development grants described the association between success in securing a K grant and subsequent grant application outcomes. Scientists who received K08 and K23 awards were more likely than those who K applications were unfunded to subsequently apply for and to receive an NIH RPG. Similarly, post-doctoral recipients of NRSA F and T awards are more likely than their colleagues to later apply for and receive an NIH RPG (.pptx link, see slide 28). In their recently published book Follow the Money, Funding Research in a Large Academic Health Center ![]() , Henry Bourne and Eric Vermillion (both from the University of California at San Francisco) note that K awards effectively function as “auditions” for aspiring faculty members. They write, “Judging clinical competence is straightforward, but it remains fiendishly hard to predict whether a budding scientist will succeed…So, the university uses NIH K awards to help decide whether or not to accept candidate clinician-scientists as full faculty members.” Our current findings suggest that with increasing levels of competition, investigators who wish to secure RPGs are more likely to be successful if they previously competed for and received a training or career development award.
, Henry Bourne and Eric Vermillion (both from the University of California at San Francisco) note that K awards effectively function as “auditions” for aspiring faculty members. They write, “Judging clinical competence is straightforward, but it remains fiendishly hard to predict whether a budding scientist will succeed…So, the university uses NIH K awards to help decide whether or not to accept candidate clinician-scientists as full faculty members.” Our current findings suggest that with increasing levels of competition, investigators who wish to secure RPGs are more likely to be successful if they previously competed for and received a training or career development award.
I am most grateful to my colleagues in the OER Statistical and Analysis Reporting Branch for their help in conducting and presenting these analyses.
Thank you for this interesting analysis. I am curious whether these trends could be a result of increasing numbers of foreign-born applicants who either trained abroad or were not eligible for T, F or K awards during their training in the U.S.
Is there any way for you to break the unfunded applicants in Figure 1 down by the number of grant applications submitted per unique PI in the prior 5 y interval?
It would be interesting to compare these results with fellows who received private fellowships- i.e. Damon Runyon, Helen Hay Whitney etc. Are these even better. Predictors?
Is the analysis of the RPGs available by R01 versus other commosmaller mechanisms like R21, R03, R34, etc. thanks
NIH has shifted more and more of the costs for various training grants onto the universities hosting trainees. We are a public university that has experienced a huge reduction in state support over the past decade or more. We are increasingly unable to find ways to support training grants because of the large cost sharing requirement they pose and the lack of available, allowable sources for that cost share. If these mechanisms are valuable for training the next generation of researchers NIH should rethink their policies regarding how they are funded unless it is an intentional strategy to favor private universities with large private endowments that allow them to absorb these costs at the expense of public universities which increasingly cannot.
It’s really great to see prior training or career awards are helping increase the odds of success for the RPG awardees.