
7 Comments
Wangler, et al. recently published an article in Genetics on NIH funding for model organism research involving Drosophila. The authors extracted grant information from NIH ExPORTER and looked for the word “Drosophila” in either the title or abstract. By this approach the authors found that NIH support for Drosophila-based research is declining.
We chose to investigate further trends in NIH support for Drosophila and other model organism research. Two groups of NIH staff used two different approaches. Our Office of Research Information Systems (ORIS) used an automated thesaurus-based text mining system which mines not only project titles and abstracts but also the specific aims contained in the application; this is the system we use to generate “Research Condition and Disease Category” (or RCDC) tables, which are publicly posted to the NIH RePORT website. In a separate effort, our Office of Portfolio Analysis (OPA) supplemented a different text mining algorithm with extensive manual curation. Both methods – the wholly automated thesaurus-based text mining approach and the manual curation supplemented text mining approach – yielded similar findings. In this blog, we will present the results of the manually curated approach.
We analyzed all R01 applications from FY 2008 to FY 2015 and used text mining to find specific keywords, including for Drosophila “Drosophila” or “melanogaster”; for C. elegans “Caenorhabditis elegans,” or “C. elegans”; for zebrafish “zebrafish,” “D. rerio,” “Danio rerio,” or “Brachydanio rerio”; and for Xenopus “X. laevis,” “Xenopus laevis,” “Xenopus,” “X. tropicalis,” or “Xenopus tropicalis.” For Drosophila research we used additional filters including an author history that included a substantial fraction of papers with Drosophila keywords in the title. For all model organisms we used a disambiguation protocol to identify R01 applicants who attended specific model organism meetings (except for Xenopus because of small numbers). We had seven curators manually curate all candidate grants; among them there was strong agreement (Kappa 0.86 to 0.88).
With these approaches we found 3,699 Drosophila applications; 1,962 C. elegans applications; 2,437 zebrafish applications; and 1,101 Xenopus applications. Figure 1 shows the yearly award rates for each model organism along with overall R01 award rates. Award rates for all model organism applications exceeded overall R01 award rates; for Drosophila, C. elegans, and Xenopus, model organism award rates were substantially higher than overall R01 award rates.
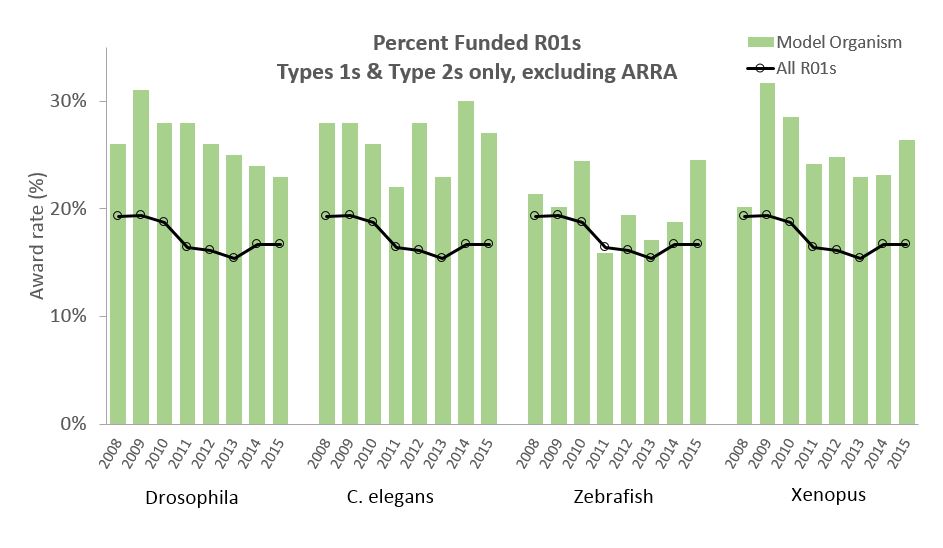
Figure 2 shows the number of non-ARRA Drosophila awards (competing and non-competing) over time. The light blue bars refer to grants identified by Wangler et al., while the dark blue bars refer to grants we identified. For all years our text-mining and manual curation approach identified substantially more grants. While the overall number of awards has declined, the decline largely reflects the overall decline in support for NIH R01s. As a percentage of all R01s, the percentage of Drosophila awards has declined slightly from 2.31% in 2008 to 2.18% in 2015.
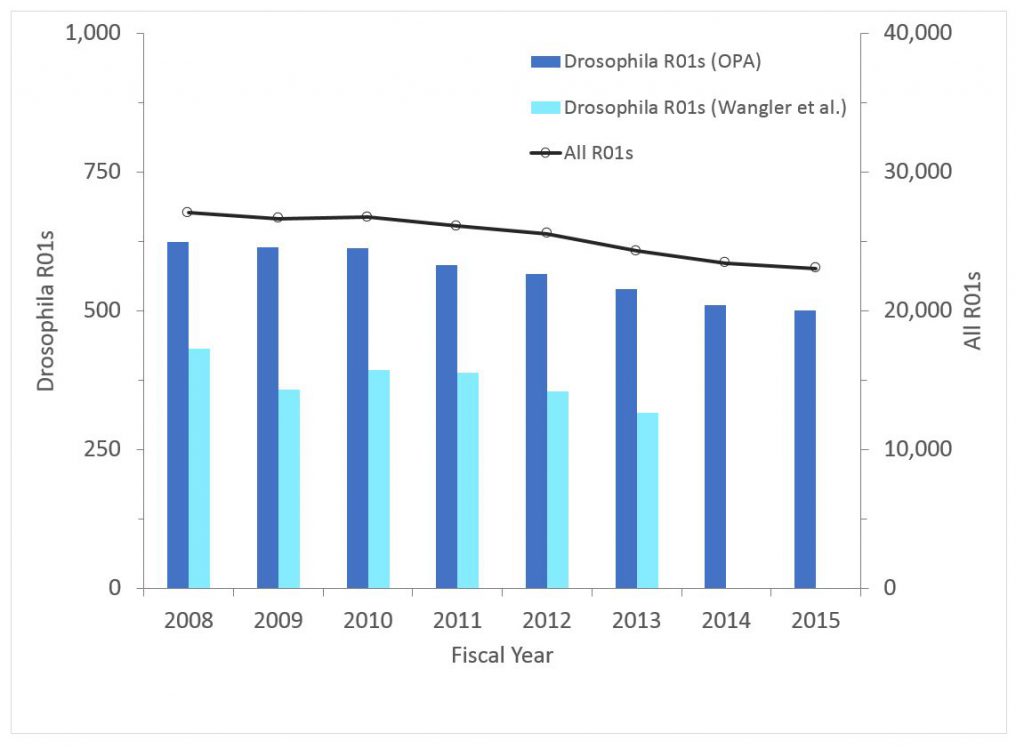
Figure 3 shows corresponding data except in terms of funded dollars. The patterns are similar.
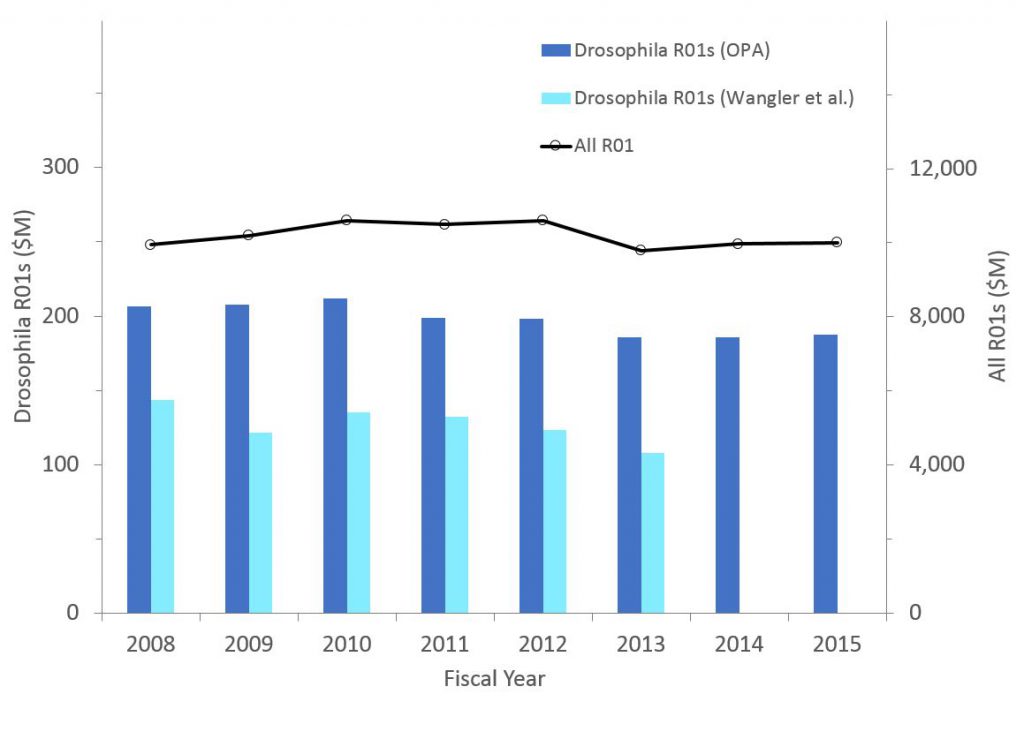
Figure 4 shows the number of awards (competing and non-competing) for C. elegans research. If anything, the proportion of all R01s supporting C. elegans research has increased (from 0.87% in 2008 to 0.98% in 2015).
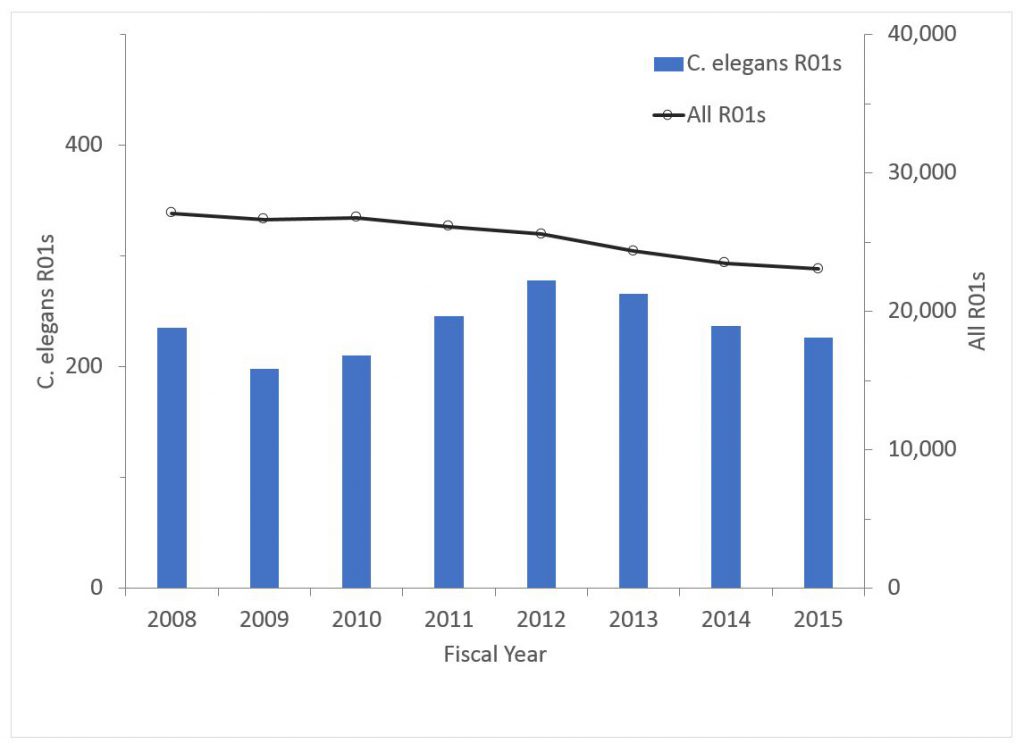
As a proportion of funding, C. elegans research has been stable (0.81% of all R01 dollars in 2008, 0.84% in 2015).
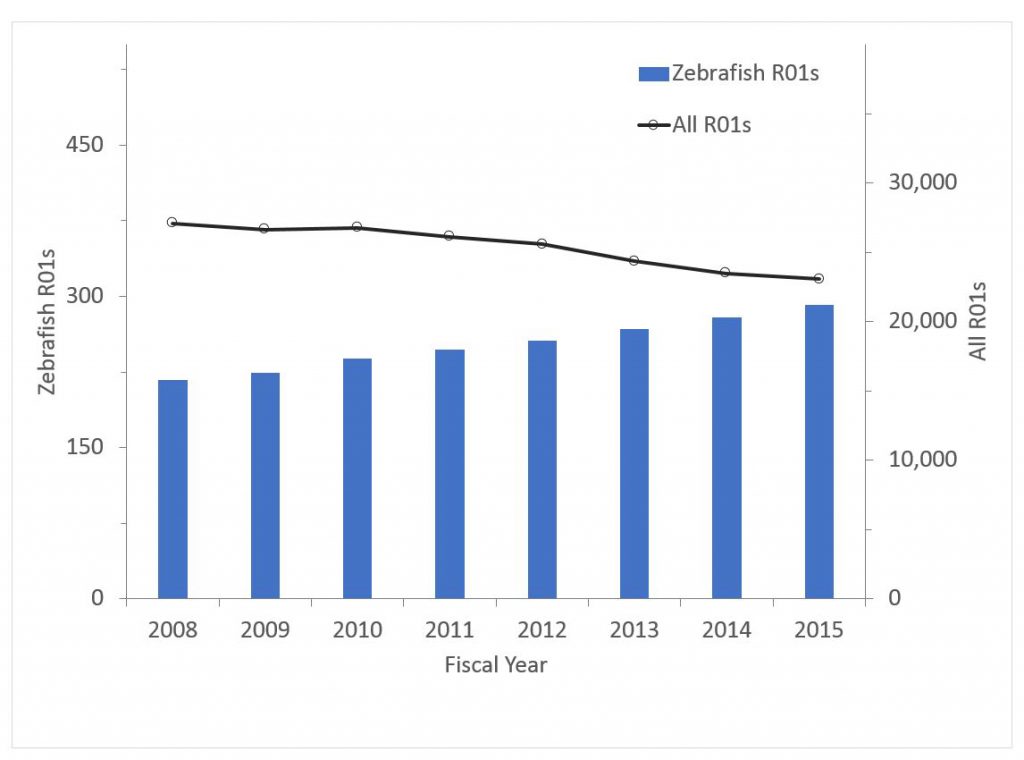
Figure 5 shows the number of awards for zebrafish research. Zebrafish research has “bucked the overall trend” – while the number of overall R01 grants has declined, the number of zebrafish awards has increased. In 2008, zebrafish awards accounted for 0.80% of all R01 awards; by 2015 this has climbed to 1.27%. The trend for funding has been even more remarkable – from 0.74% of R01 dollars in 2008 to 1.24% in 2015.
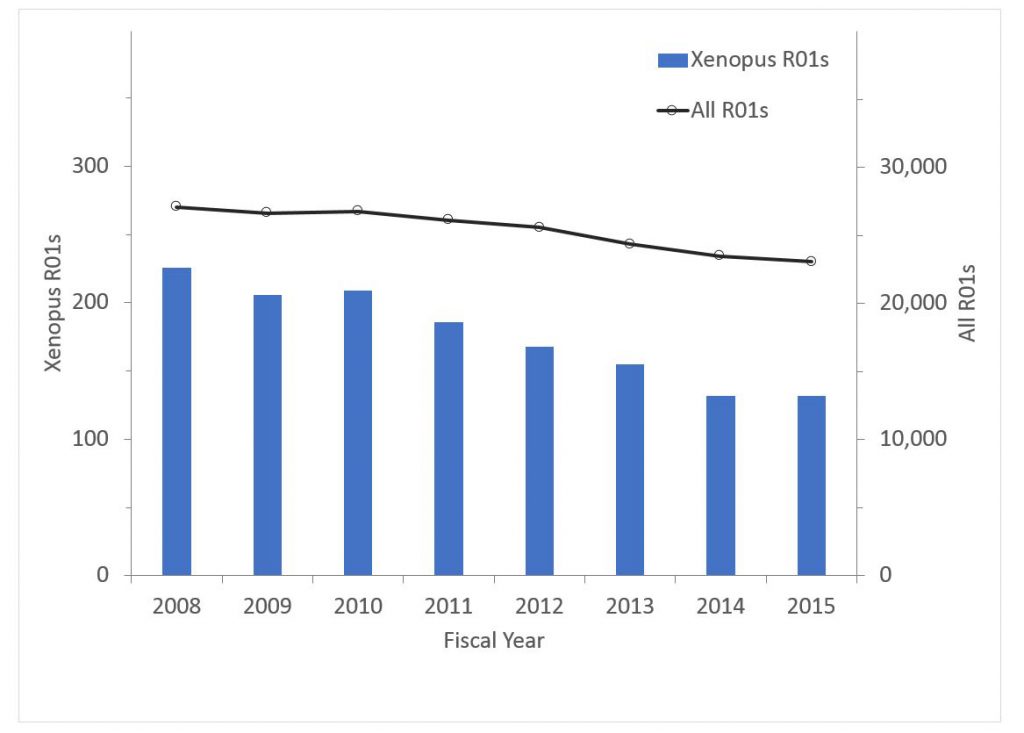
Finally Figure 6 shows data for Xenopus research. The percent of all R01s declined from 0.83% in 2008 to 0.57% in 2015; the corresponding values for funding were 0.76% in 2008 and 0.52% in 2015.
Figure 6:
Overall, we found that award rates for model organization applications have been relatively stable with respect to both the number of awards and amount of funding. Drosophila awards have dropped slightly as a fraction of all R01s (from 2.31% to 2.18%), for an overall decrease of 5.6%. C. elegans awards oscillated, but overall increased by 36.1% while zebrafish awards increased by 58.8%. Xenopus awards fell by 31.3%. Taken together, these data suggest a shift in focus from Xenopus towards C. elegans and zebrafish research, with the shift primarily explained by the number of applications we’ve received.
We are grateful to Office of Portfolio Analysis and Office of Extramural Research staff for their help in conducting these analyses.
Thanks for this analysis, but can you please address the other questions below to make this analysis more transparent? The timing of this analysis for the #TAGC16 meeting where Director Collins just spoke to model organism researchers is more than just coincidental.
Why has this analysis left out mouse and fungi (ie: yeast) as Model Organisms? Are other animals (rats, primates, livestock) also considered as model organisms by the NIH?
How do the fly, worm, frog and fish compare to mouse, which I bet the mouse gets the vast major share of extramural funding?
Finally, what is the proportion of extramural funds going to model organisms research versus the rest of NIH extramural funding, and how has this trended over the 1980 to current time period?
Thanks for your suggestions. We are planning a followup blog related to this post. Stay tuned!
The stable success rate is somewhat reassuring, but another important question is “What is a healthy percentage of model organism work for the NIH portfolio?” The percents you cited seem alarmingly low to me and I think may reflect the demise of basic research supported by NIH. I agree with the previous comment, that a much longer-term view would be helpful. I think support for basic research and model organism research may have already declined substantially by 2008. Full disclosure: I am a basic researcher, but I do not work with any type of model organisms.
Following up on HR_academic’s comment, can you include birds in the followup? Specifically, songbirds (Zebra finch, Taeniopygia guttata; Benagalese finch, Lonchura striata; European starling, Sturnus vulgaris)
The point is that each of these model systems receives less than 1-2% of total NIH funding. There is no doubt that there is bias toward atypical model systems in study sections in favor of rats and mice.
This is a very enlightening analysis. In a follow up, I would be interested to see whether RO1s that propose to use two or more model organisms in the specific aims are being funded at higher rates when compared with single model organism based applications. In other words- does NIH funding favor or disfavor research that aims to validated findings across species?
Figure 1 indeed confirms the perception that funding rate for Drosophila grants has steadily declined against the overall R01 funding rate over the past five years. It is true that the Drosophila rate exceeds the overall rate both before and after this decline. But is it NIH’s goal to bring funding rates for all organisms to the same level? To the overall rate?