
15 Comments
Scientific Workforce Diversity
In this post, we analyze funding rates for Fiscal Year (FY) 2010 to FY 2022 mentored career development award (K) applicants according to the race-ethnicity of designated Principal Investigators (PIs). Receipt of a career development award often presages R01 receipt. We used data from frozen, official, NIH success rate files. We focus on applicants for K01, K08, K23, K25,and K99 direct budget authority awards.
We obtained data on the race and ethnicity of PIs from their entries into the eRA Commons Personal Profile. As noted by NIH, PIs provide these data on a strictly voluntary basis, and these data are not used for making funding decisions. If individuals described themselves as Hispanic in the ethnicity field and not Black in the race field, then race-ethnicity was considered to be Hispanic; otherwise the individual’s race-ethnicity was based on their entry in the race field. Race-ethnicity groups with small cell sizes are removed from the report.
As a reminder, NIH publishes three main kinds of grant outcome metrics, namely award rates, success rates, and funding rates. Award and success rates are application-based metrics, while funding rates are person-based. Throughout the report we refer for convenience to Principal Investigators (“PIs”) as applicants or awardees. In point of fact, applicants and awardees are institutions who in turn designate PIs; PIs are typically employees of the applicants and awardees.
Tables 1 and 2 show characteristics according to race-ethnicity of scientists who were designated as a PI on at least one K application submitted in FY 2012 (the year the Ginther paper was published) and in FY 2022. Compared to white applicants, FY 2022 Black applicants were more likely to submit a K01 application and less likely to submit K08 or K23 applications. The K01 mechanism is used by some ICs to enhance workforce diversity. Black applicants were more likely to submit proposals including human subjects and less likely to submit proposals including animal models.
Table 1: Characteristics according to race-ethnicity of scientists who were designated as a Principal Investigator on at least one K application in FY2012. ND = not displayed due to small cell size.
| Characteristic | White | Asian | Unknown | Hispanic | Black | |
| Total N (%) | 1255 (52.0) | 587 (24.3) | 280 (11.6) | 153 (6.3) | 94 (3.9) | |
| Female | 583 (46.5) | 251 (42.8) | 119 (42.5) | 84 (54.9) | 71 (75.5) | |
| Age (years) | Median (IQR) | 36.0 (33.0 to 39.0) | 37.0 (34.0 to 40.0) | 35.0 (33.0 to 38.0) | 37.0 (35.0 to 40.0) | 36.5 (34.0 to 40.0) |
| Degree | MD | 294 (23.4) | 145 (24.7) | 37 (13.2) | 36 (23.5) | 24 (25.5) |
| MD-PhD | 128 (10.2) | 82 (14.0) | 22 (7.9) | 19 (12.4) | ND | |
| Other | 29 (2.3) | 19 (3.2) | 91 (32.5) | ND | ND | |
| PhD | 804 (64.1) | 341 (58.1) | 130 (46.4) | 93 (60.8) | 65 (69.1) | |
| Submitted a K01 application | 277 (22.1) | 94 (16.0) | 41 (14.6) | 51 (33.3) | 47 (50.0) | |
| Submitted a K08 application | 198 (15.8) | 101 (17.2) | 36 (12.9) | 19 (12.4) | ND | |
| Submitted a K23 application | 302 (24.1) | 116 (19.8) | 56 (20.0) | 40 (26.1) | 23 (24.5) | |
| Submitted a K25 application | 37 (2.9) | 24 (4.1) | ND | ND | ND | |
| Submitted a K99 application | 444 (35.4) | 252 (42.9) | 138 (49.3) | 41 (26.8) | 15 (16.0) | |
| Submitted a K animal research application | 499 (39.8) | 298 (50.8) | 141 (50.4) | 71 (46.4) | 27 (28.7) | |
| Submitted a K human research application | 675 (53.8) | 245 (41.7) | 119 (42.5) | 77 (50.3) | 60 (63.8) | |
Table 2: Characteristics according to race-ethnicity of scientists who were designated as a Principal Investigator on at least one K application in FY2022. ND = not displayed due to small cell size.
| Characteristic | White | Asian | Unknown | Hispanic | Black | |
| Total N (%) | 1859 (51.2) | 907 (25.0) | 296 (8.2) | 284 (7.8) | 195 (5.4) | |
| Female | 1045 (56.2) | 419 (46.2) | 77 (26.0) | 169 (59.5) | 133 (68.2) | |
| Age (years) | Median (IQR) | 36.0 (34.0 to 39.0) | 36.0 (34.0 to 39.0) | 36.0 (34.0 to 39.0) | 37.0 (34.0 to 40.0) | 38.0 (35.0 to 42.0) |
| Degree | MD | 351 (18.9) | 176 (19.4) | 49 (16.6) | 41 (14.4) | 43 (22.1) |
| MD-PhD | 182 (9.8) | 105 (11.6) | 29 (9.8) | 18 (6.3) | 14 (7.2) | |
| Other | 179 (9.6) | 93 (10.3) | 95 (32.1) | 27 (9.5) | 17 (8.7) | |
| PhD | 1147 (61.7) | 533 (58.8) | 123 (41.6) | 198 (69.7) | 121 (62.1) | |
| Submitted a K01 application | 370 (19.9) | 115 (12.7) | 43 (14.5) | 66 (23.2) | 73 (37.4) | |
| Submitted a K08 application | 314 (16.9) | 138 (15.2) | 62 (20.9) | 35 (12.3) | 20 (10.3) | |
| Submitted a K23 application | 463 (24.9) | 163 (18.0) | 56 (18.9) | 49 (17.3) | 47 (24.1) | |
| Submitted a K25 application | 23 (1.2) | 13 (1.4) | ND | ND | ND | |
| Submitted a K99 application | 692 (37.2) | 481 (53.0) | 133 (44.9) | 133 (46.8) | 54 (27.7) | |
| Submitted a K animal research application | 594 (32.0) | 402 (44.3) | 118 (39.9) | 115 (40.5) | 48 (24.6) | |
| Submitted a K human research application | 1121 (60.3) | 415 (45.8) | 147 (49.7) | 149 (52.5) | 137 (70.3) | |
| Submitted a MOSAIC research application | 16 (0.9) | ND | ND | 38 (13.4) | 24 (12.3) | |
Figure 1 shows the number of unique K applicants each fiscal year according to race-ethnicity.
Figure 1: Number of K applicants according to race-ethnicity by fiscal year. Panel A shows data for all groups, while Panel B shows the same data but for White, Hispanic, and Black applicants only.
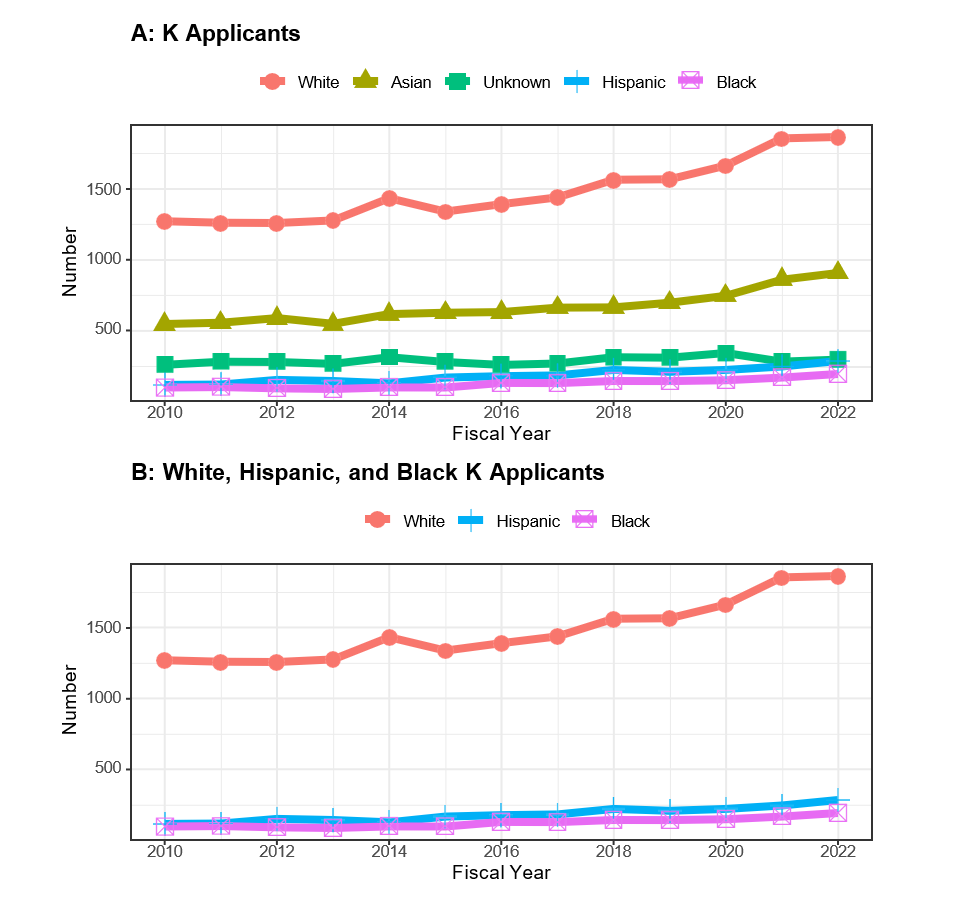
Figure 2 shows increasing numbers of unique Black K applicants and awardees, while Figure 3 shows corresponding values for Hispanic applicants and awardees.
Figure 2: Number of unique mentored K Black applicants and awardees by fiscal year
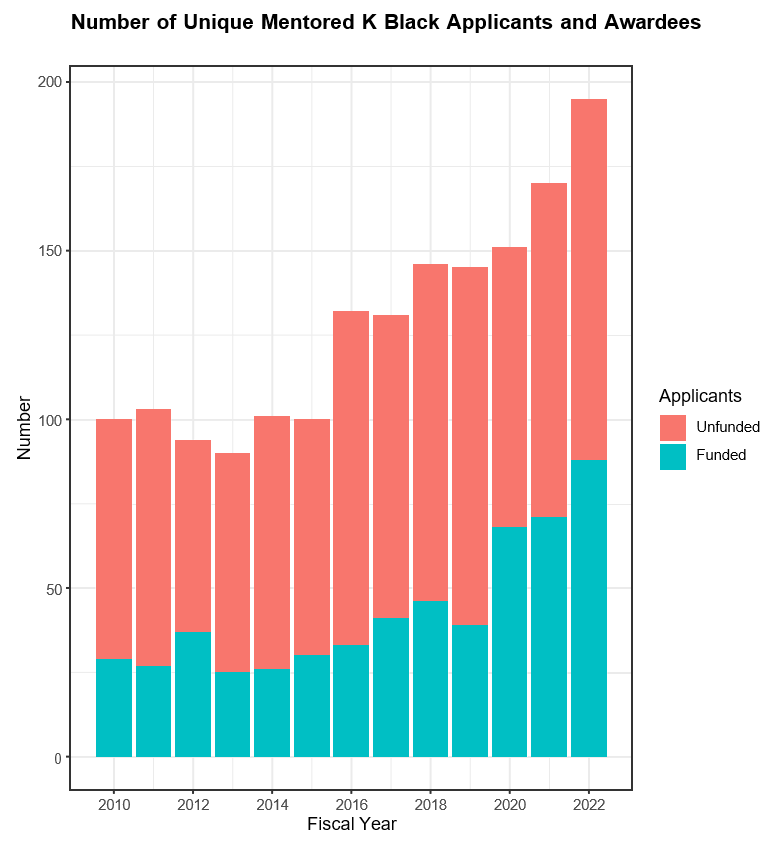
Figure 3: Number of unique mentored K Hispanic applicants and awardees by fiscal year
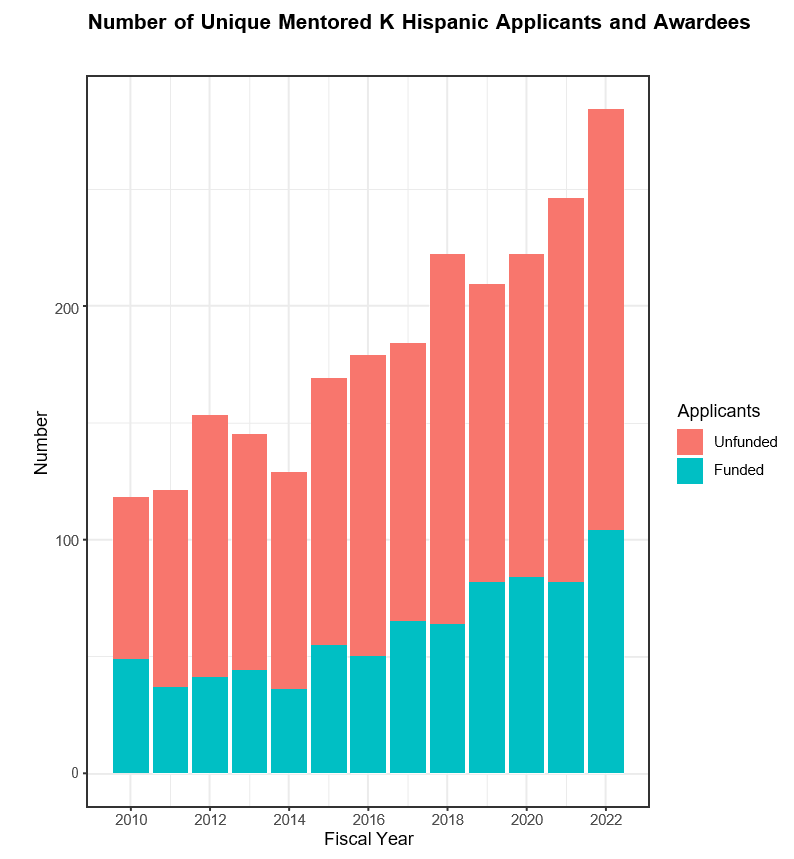
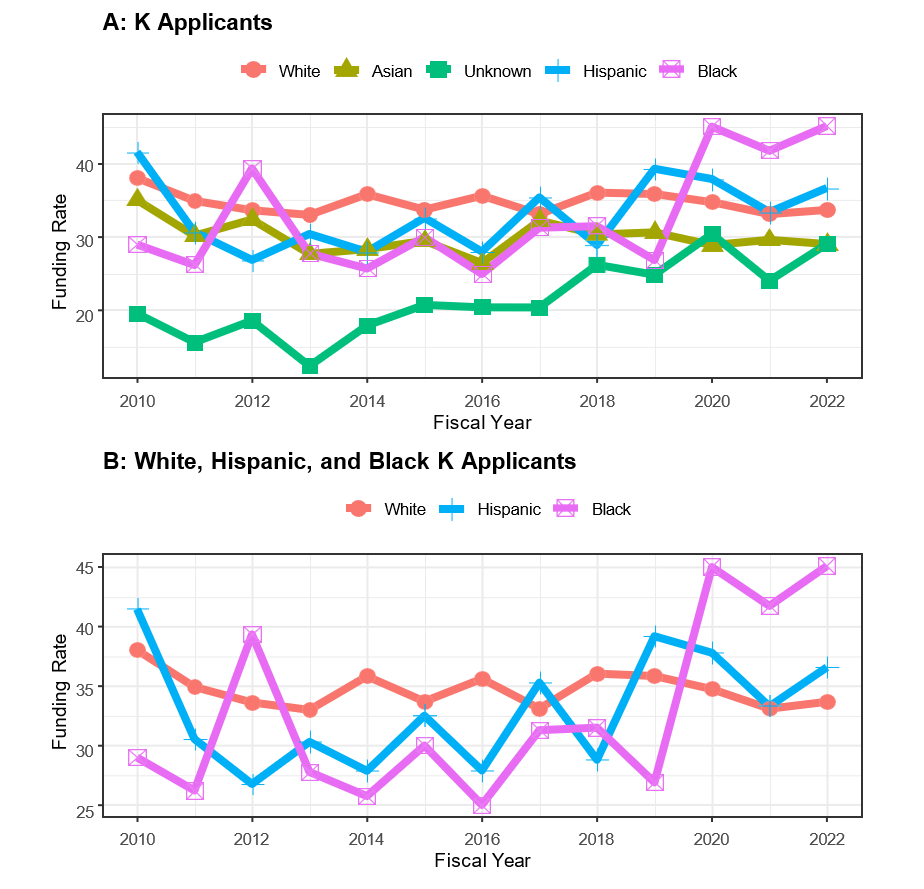
Figure 4 shows K funding rates according to race-ethnicity.
Figure 4: Funding rates for K applicants according to race-ethnicity by fiscal year. Panel A shows data for all groups, while Panel B shows the same data but for White, Hispanic, and Black applicants only.
Of note, in FY 2022 there were 195 Black applicants; of these 54 were K99 applicants, including 24 who were MOSAIC applicants. There were 88 Black awardees; of these 28 were K99 awardees, including 16 who were MOSAIC awardees. There were 284 Hispanic applicants; of these 133 were K99 applicants, including 38 who were MOSAIC applicants. There were 104 Hispanic awardees; of these 46 were K99 awardees, including 18 who were MOSAIC awardees.
In summary, in this analysis of K applicants and awardees, we find that:
- The numbers of Black and Hispanic applicants and awardees have steadily increased over time.
- Funding rates for Black applicants have increased over the past 3 years.
- However, the total number of Black and Hispanic applicants remains quite low.
We are grateful to our colleagues in the NIH Office of Extramural Research Division of Statistical Analysis and Reporting (DSAR) for their help with these analyses. For a more in-depth version of this report, please see the full report.
Editorial note added on October 16, 2023: Native Hawaiian or Other Pacific Islanders as well as American Indian or Alaska Native researchers were excluded from the report as noted in the blog and full length reports (linked at the end) due to small cell sizes. We do not publicly report sample sizes that are sufficiently small (<12), which is considered as potentially identifiable. Separately, our intent was to focus on African American/Black and Hispanic applicants in some of the panels here, but we will only show one panel (that includes Asian and other researchers) going forward on any future analyses.
Why is there no data in this report for Native American K applicants?
In the target analysis, why is there no mention of the ultra low rate by asians who are from a even smaller minority group?
What is the intent of removing Asians in Figure 4B?
Is your data showing that Asian applicants have the lowest funding rate?
A reader also reached out via email asking if the “28 Black K99 awardees is comprised of 16 MOSAIC awards and 12 original mechanism K99 awardees? Do these numbers include applications submitted in 2021 but awarded in 2022?”
The MOSAIC applicants and awardees are included in the overall counts for the K99 applicants and awardees. 28 Black K99 awardees is comprised of 16 MOSAIC awards and 12 original mechanism K99 awardees. Also, there could be applications that were submitted in March 2021 (FY 2021) and got funded in Nov. 2022 (FY 2022) or were submitted in July 2021 (FY 2021) and got funded in March 2022 (FY 2022).
Why there is no mentioning of Asian applicants’ lowest funding rate? Does NIH truly care about equality?
Yes, I’m curious as to why the decision was made to erase Asian-American/Asian K applicants.
Re: Figure 4: Funding rates for K applicants according to race-ethnicity by fiscal year. Panel A shows data for all groups, while Panel B shows the same data but for White, Hispanic, and Black applicants only.
Can you explain why Figure 4 separately reported Panel A and Panel B? Only difference is the removal of Asian and Unknown.
And Figure 4 explains the Funding rate by race-ethnicity in FY2022. The funding rate for Black, White, Hispanic, and Asian look like around 45%, 37%, 34%, and 29%, respectively. Asian is the second largest race-ethnicity group that applied. But the funding rate for Asians is generally lower than for other race-ethnicity. What would be the main cause of the relatively low funding rate for Asians?
The data itself and how the data is presented show the utter bias of NIH towards race and ethnicity.
Indeed…so sad the most obvious disparity in this report is ignored (and probably promoted) by NIH.
Native Hawaiian or Other Pacific Islanders as well as American Indian or Alaska Native researchers were excluded from the report as noted in the blog and full length reports (linked at the end) due to small cell sizes. We do not publicly report sample sizes that are sufficiently small (<12), which is considered as potentially identifiable. Separately, our intent was to focus on African American/Black and Hispanic applicants in some of the panels here, but we will only show one panel (that includes Asian and other researchers) going forward on any future analyses.
“Separately, our intent was to focus on African American/Black and Hispanic applicants in some of the panels here”. Does this mean NIH intentionally ignored Asians whose funding rate is the lowest?
Why is NIH’s response to this matter excluding race and ethnicity based analysis going forward? One needs to measure the problem in order to identify the problem. So in the future, Asians will continue to have the lowest funding rate and NIH is going to hide it? At least continue to publsih data, so there is a record, instead of hiding it. This is like insisting there is no disparity when there is.
Can NIH explain the low funding rate for Asians and any plan to address that?
“In 2022, The funding rate for Asian applicants is 36%, 22%, and 15% LOWER than those for Black, Hispanic, and White applicants, respectively.”
I suggest the above conclusion be added to the report.
For those wondering why removing the curve for Asians, the reasons are simple. Either because most Asian candidates are too excellent to accept a Mentored Career Award (they just can find opportunities elsewhere anyway), or just too bad to do research so better not waste money for their career training at all.