19 Comments
Here we discuss how inflation has been relevant to NIH Research Project Grants (RPG), the largest component of extramural NIH funding.
We can start with a straightforward question: What is inflation? The US Federal Reserve defines inflation as “the increase in the prices of goods and services over time.” Prices for research project grants may increase over time for a variety of reasons:
- Background inflation: Prices increase across the economy due to increases in the money supply and/or economy-wide demand and supply stresses; these are reflected in general price indices, such as the Gross Domestic Product (GDP) price index and the Consumer Price Index.
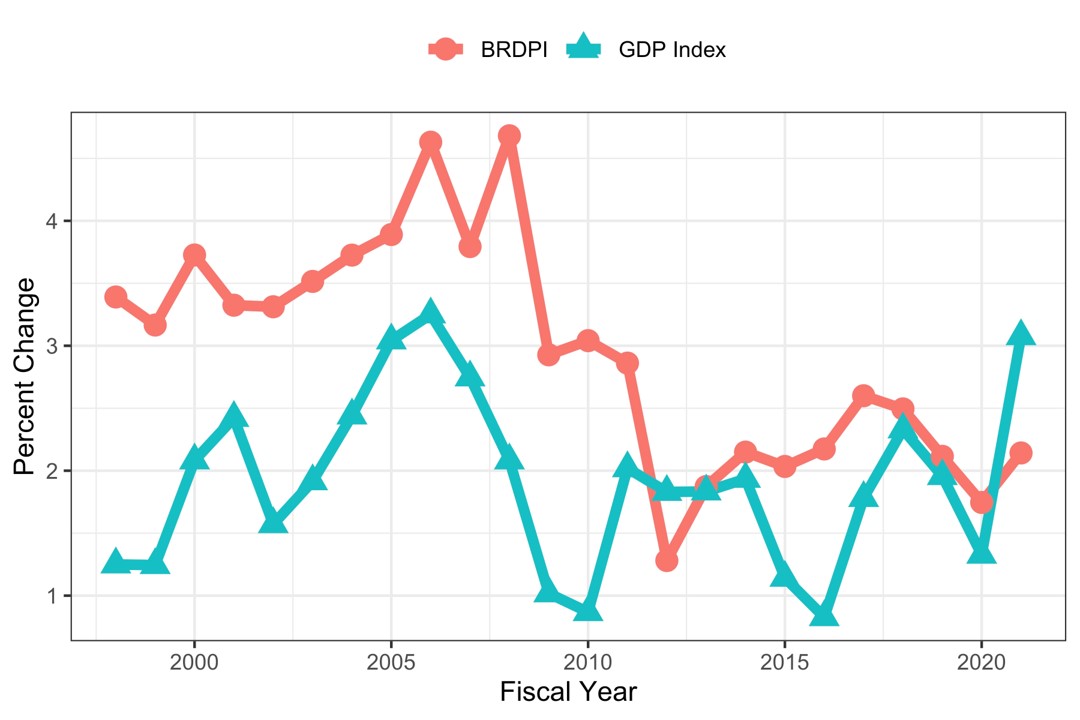
- Research-specific inflation: Prices increase specifically in the biomedical research and development enterprise; these are reported as the Biomedical Research and Development Price Index (or BRDPI). The BRDPI measures changes in the weighted average of the prices of all the inputs (e.g., personnel services, various supplies, and equipment) purchased with the NIH budget to support research. The weights used to construct the index reflect the actual pattern, or proportions, of total NIH expenditures on each of the types of inputs purchased. Theoretically, the annual change in the BRDPI indicates how much NIH expenditures would need to increase, without regard to efficiency gains or changes in government priorities, to maintain NIH-funded research activity at the previous year’s level. Figure 1 shows the BRDPI and GDP Price Index from 1998 to 2021. Until 2012, the BRDPI was generally higher than the GDP Price Index; since then the BRDPI has been equivalent to or lower, likely due to caps on senior faculty salary support.
Figure 1: Inflation indices FY1998 to FY2021.
- Changes in agency purchasing decisions (or compositional effects): We might imagine an automobile-rental firm that starts one year purchasing 10 mid-size sedans. The following year, it might choose to purchase instead 10 luxury mid-size sedans; costs increase not because of background inflation because of the firm’s decisions about what it wants to buy. Alternatively, the firm may purchase 2 large vans, 4 mid-sized sedans, and 4 compact cars. Overall and median costs might not change (compared to the baseline of 10 mid-size sedans), but the firm’s management will be acutely aware of the costs of the 2 large Similarly, NIH Institutes and Centers (IC’s) may choose to issue investigator-initiated R01 awards, R01 awards that cost more (e.g. >500K in direct costs) because of use of large-scale clinical trials, or different size awards (program project grants, cooperative agreements, or small exploratory R21 or R03 awards).
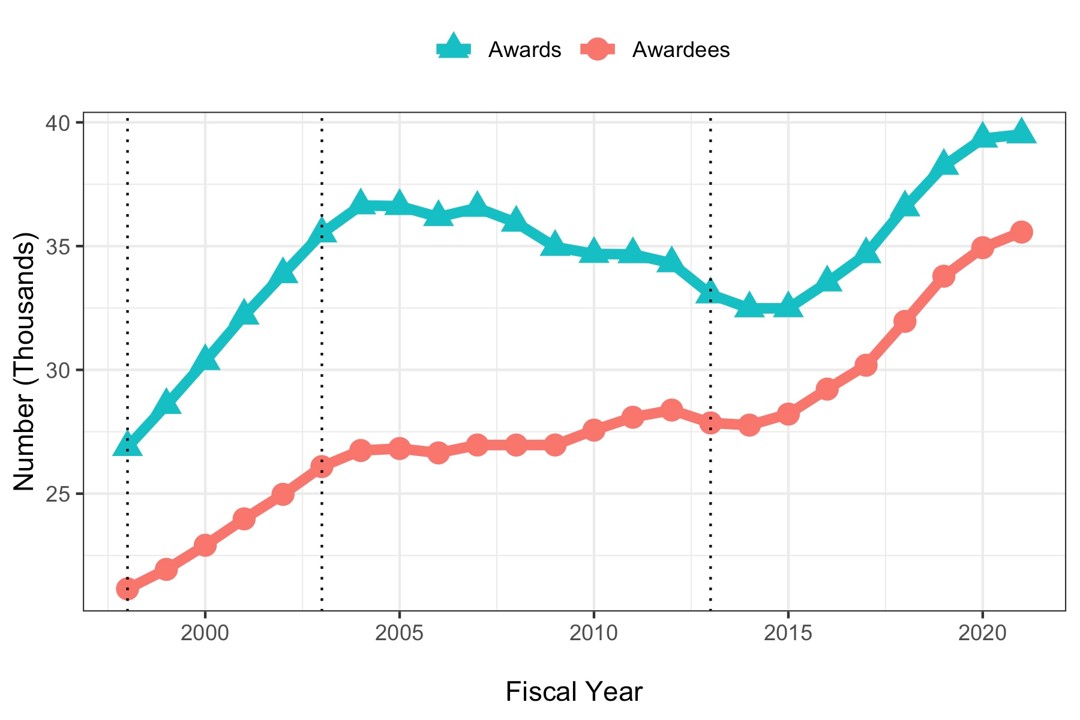
We will focus on real (as opposed to nominal) costs of NIH RPG awards, that is total costs per RPG indexed for the FY2021 BRDPI. First, though, we’ll review a high-level history of NIH RPGs. Figure 2 shows the number of unique competing and non-competing RPGs awarded each year. Between 1998 and 2021, NIH issued 827,815 RPG awards of at least $25,000 per year (BRDPI-indexed to 2021). The 3 vertical dotted lines refer to the beginning and end of the NIH-doubling (1998 and 2003) and the year of budget sequestration (2013). The number of RPGs increased during the doubling, decreased gradually between the end of the doubling and 2015, and rose again with recent NIH budget increases.
Figure 2: Number of unique funded competing and noncompeting RPG awards and designated Principal Investigators (“Awardees”) FY1998 to FY2021.
Figures 3 and 4 show mean and median costs per RPG in both nominal (red lines with circles) and FY2021 BRDPI-adjusted (teal lines with triangles) values. The real (that is FY2021 BRDPI-adjusted) costs of RPGs increased during the doubling (from average values of about $530,000 to about $610,000), fell to a nadir of about $520,000 in 2013, and after a quick rebound in 2014 has remained relatively stable at about $570,000 since.
Figure 3: Average costs (namely total costs, including both direct and indirect costs) for funding RPGs FY1998 to FY2021.
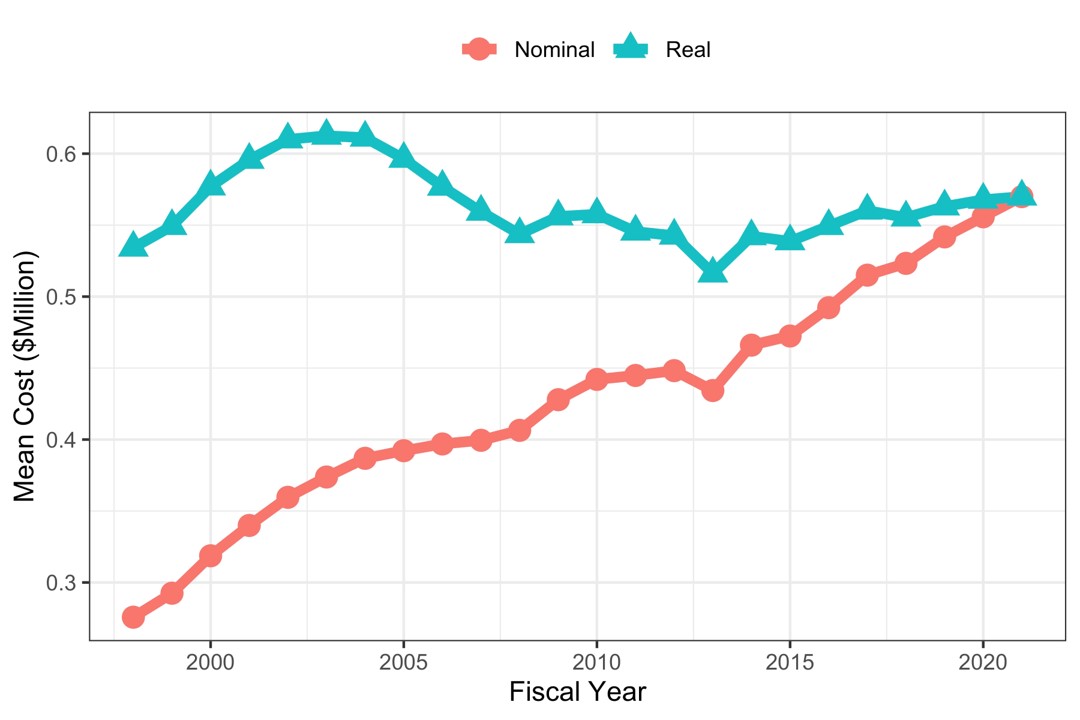
Figure 4: Median costs (namely total costs, including both direct and indirect costs) for funding RPGs FY1998 to FY2021.
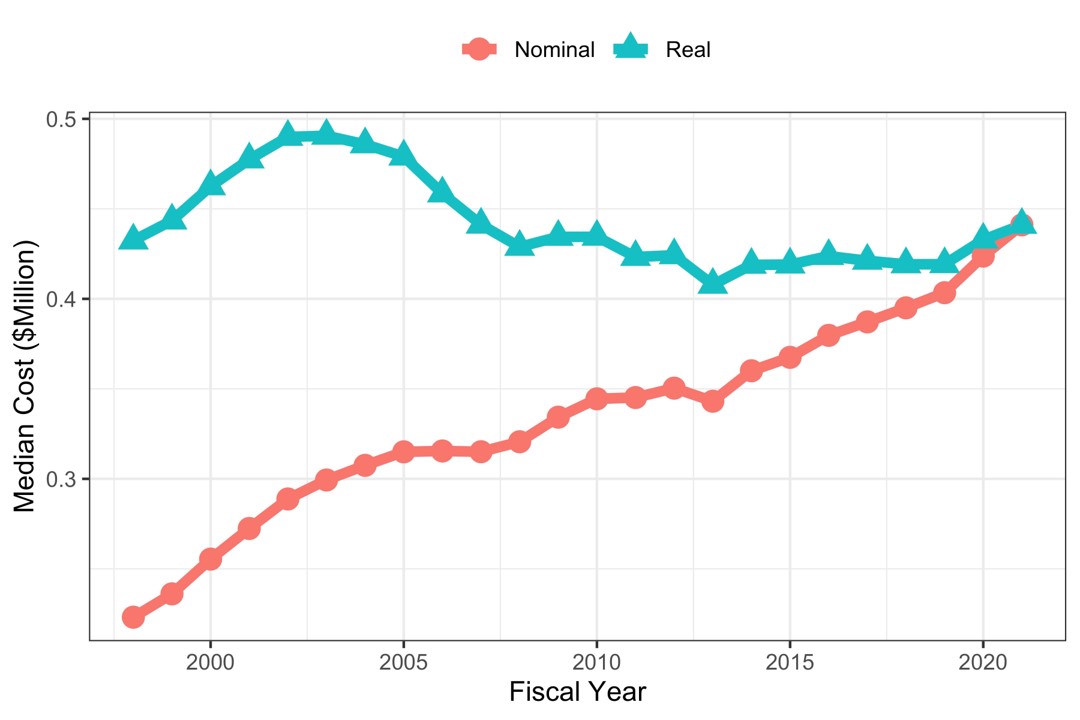
Figures 3 and 4 only shows central tendencies (mean and median). Figure 5 shows the yearly distribution of costs using box plots. The means (shown as diamonds) and medians (central lines) correspond to the data shown in Figures 3 and 4. The means are much greater than the medians, consistent with highly skewed distributions. The whiskers are also quite long, consistent with “fat-tailed” distributions.
Figure 5: Box plots showing year-by-year distribution of RPG costs (in FY2021 BRDPI-adjusted dollars) from FY1998 to FY2021.
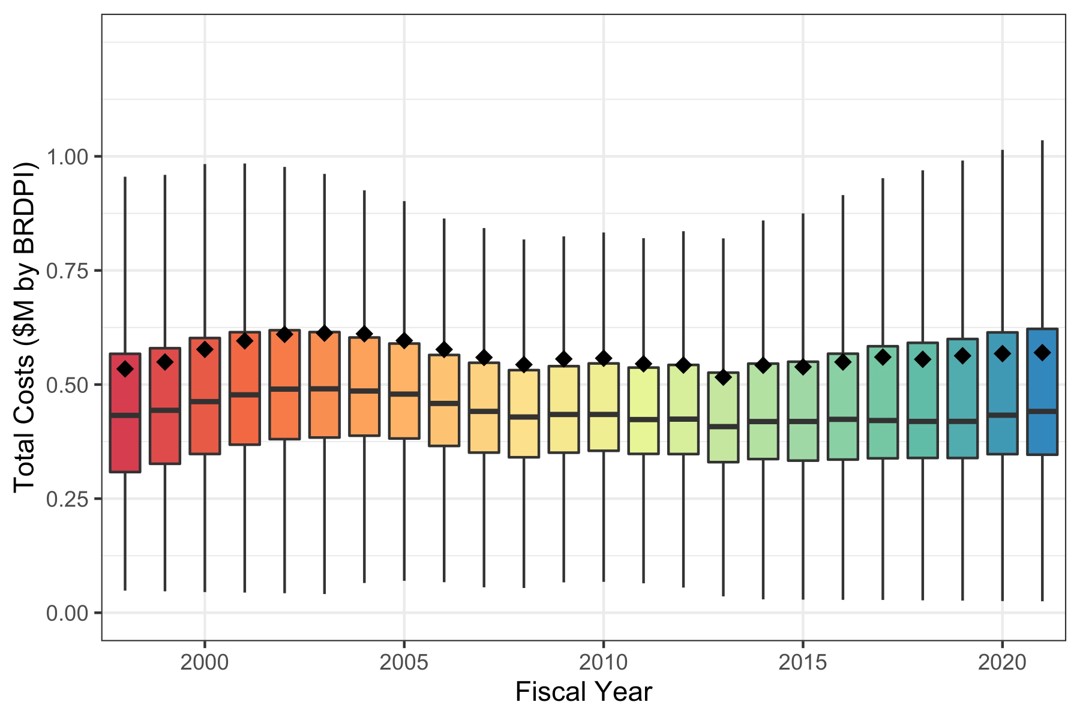
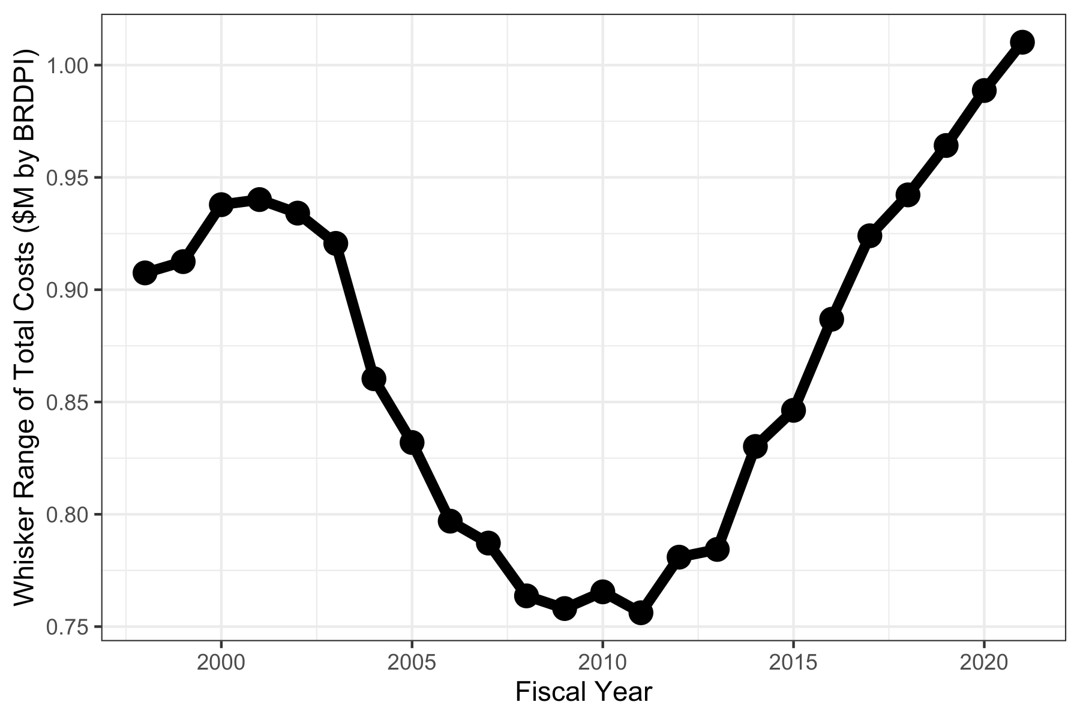
Careful inspection of Figure 5 reveals an interesting pattern in variation. From the time of the doubling until about 2010, the distance between the whisker tips decreased. We can call this distance the “whisker range.” From 2012 through 2021 whisker ranges increased, exceeding levels for the doubling. We can think of the upper (and lower) whisker tips as the most extremely expensive (inexpensive) award that is not an outlier; the distance of the tips from the center (median) reflects the agency’s general willingness to vary its funding instruments. Figure 6 shows the whisker ranges declined from $920,000 to $750,000 between FY2002 and FY2010 and increased to over $1 million in FY2021.
Figure 6: Distance from box-plot whisker tips (from Figure 5) FY1998 to FY2021.
What’s behind these trends? Table 1 shows characteristics of funded RPGs in select fiscal years 1998 (begin of budget doubling), 2003 (end of budget doubling), 2013 (sequestration), 2019 (before the pandemic), and 2021 (most recent year). Over time a greater proportion of RPGs are funded from IC solicitations, involve high total costs (defined here as >$ 5 million is 2021 inflation-adjusted dollars), cooperative agreements, and R03 or R21 mechanisms.
Table 1: Characteristics of funding competing and noncompeting RPGs in select fiscal years.
| Characteristic | 1998 | 2003 | 2013 | 2019 | 2021 | |
| Total N (%) | 26882 (15.5) | 35513 (20.5) | 33047 (19.1) | 38241 (22.1) | 39513 (22.8) | |
| Total Costs ($M BRDPI) | Mean (SD) | 0.53 (0.58) | 0.61 (0.76) | 0.52 (0.70) | 0.56 (0.88) | 0.57 (0.90) |
| Unsolicited | N (%) | 21905 (81.5) | 25913 (73.0) | 23300 (70.5) | 24153 (63.2) | 23471 (59.4) |
| R01-Equivalent | N (%) | 21543 (80.1) | 30124 (84.8) | 26199 (79.3) | 29341 (76.7) | 31258 (79.1) |
| R21 or R03 | N (%) | 1424 (5.3) | 3920 (11.0) | 4805 (14.5) | 5478 (14.3) | 4949 (12.5) |
| Program Grant | N (%) | 811 (3.0) | 984 (2.8) | 595 (1.8) | 374 (1.0) | 328 (0.8) |
| Cooperative Agreement | N (%) | 623 (2.3) | 1493 (4.2) | 1709 (5.2) | 2437 (6.4) | 2404 (6.1) |
| Costs > $5 million BRDPI | N (%) | 38 (0.1) | 102 (0.3) | 70 (0.2) | 140 (0.4) | 135 (0.3) |
| Clinical Trial | N (%) | 2389 (7.2) | 3706 (9.7) | 4176 (10.6) | ||
| Human or Animal | Neither (%) | 5715 (21.3) | 6799 (19.1) | 6197 (18.8) | 7207 (18.8) | 7627 (19.3) |
| Animal (%) | 11357 (42.2) | 14877 (41.9) | 14842 (44.9) | 16231 (42.4) | 16633 (42.1) | |
| Human (%) | 7063 (26.3) | 10529 (29.6) | 9424 (28.5) | 11275 (29.5) | 11820 (29.9) | |
| Both (%) | 2747 (10.2) | 3308 (9.3) | 2584 (7.8) | 3528 (9.2) | 3433 (8.7) | |
In summary, these analyses show that:
- The rate of inflation for NIH-funded research (that is the BRDPI) was higher than the general rate of inflation from 1998 until 2012; since then, the rate of inflation for NIH-funded research has been similar to or even lower than the general rate of inflation. The more recent declines in the BRDPI may be related to caps on compensation of extramural
- Despite increases in nominal costs, recent years have seen increases in the absolute numbers of RPG and R01-equivalent awards.
- Real (BRDPI-adjusted) average and median RPG costs increased during the NIH-doubling (1998 to 2003), but has remained stable since.
- The degree of variation of RPG costs has changed over time, with more marked extremes observed on both higher and lower levels of cost. On the higher end, over time NIH has been funding more cooperative agreements, more projects exceeding $5 million (in FY2021 BRDPI, not nominal, values), and more clinical trials. On the lower end of cost, over time the agency has been funding more low-cost mechanism awards (R03 and R21). On both ends, the agency is funding a greater proportion of solicited projects, with nearly half of RPG money going towards solicited projects.
- Recalling the automobile rental firm analogy, NIH may be pursuing the strategy of simultaneously purchasing more expensive (large vans) and less expensive (compact cars) vehicles.
If you want to learn more about these analyses, please see this more detailed report.
I am grateful to my colleagues in the OER Division of Statistical Analyses and Reporting for their help in conducting and reporting these analyses.
*The post was updated to correct the order of figures.


You appear to have ignored a critical factor in this longitudinal analysis, namely the fixed limit to the modular budget for the R01. It has not been adjusted with inflation and has lost some 45%+ of its spending power since it was put in place. This has huge implications for application churning, success rates and of course general PI stress, all of which take away from the efficient deployment of investigator time, effort and thought on their funded projects. The BRDPI analysis is hardly new, this was discussed on this blog by Director Rockey in 2014 and a warning by Heinig et al in 2007 (DOI: 10.1056/NEJMsb071774). The NIH appears to be over focused on success rates and number of grants funded, both of which can be juiced by decreasing the size of those awards. This ignores the ever increasing amounts of time needed to secure sufficient funds to operate a laboratory and to pursue a research program of study. It appears highly unlikely that the NIH has not thought about the decreased purchase power of the modular R01 once or twice over the years. It is time to be fully transparent about why you have decided (perhaps repeatedly) not to adjust the modular limit in register with what the BRDPI analysis is telling you.
The Laboratory of Molecular Biology, of the Medical Research Council (MRC) at Cambridge has been hugely
successful because it awards research funding for long periods without continual 3 – 4 year grant applications, and without
regard to multiple publications. This gives their researchers time to think about, and do, research, rather than
continually writing grants and short papers. It has obviously been a successful approach judging by the number of
Nobel Prizes their researchers have garnered.
Unfortunately, many UK scientists using this seemingly beneficial approach were sacked in the Thatcher years when they were summarily let go.
I agree. How is it possible that this obvious point was ignored in this Nexus news letter? Plus, Fig. 1 and 2 are out of order. Who is proof reading these reports?
Unfortunately there is not good solution to the (very real) problem you are referring to. Since the amount of money is ~fixed, increasing the cap/award would result in fewer awards being made, leading to PI’s spending even more time to secure one award. Realistically, cap increases should come with a larger NIH budget allocation. My guess is that things will stay the way they are until objective measures of success (number of publications per grant, average impact factor of publications, etc) will demonstrate that the quality/amount of science that can be performed under the cap is starting to significantly suffer. My guess is that could happen sooner rather than later.
Case study:
Post-doc average salary circa 2000 – $25,000/year
Modular R01 budget limit circa 2000 – $250,000/year – direct cost (hardly ever paid in full; many institutes apply across the board ~20% cut, and/or limit it at 4yrs)
Post-doc average salary circa 2020 – $50,000/year
Modular R01 budget limit circa 2020 – $250,000/year – direct cost (hardly ever paid in full; many institutes apply across the board ~20% cut, and/or limit it at 4yrs)
The Division of Statistical Analyses could more easily conclude that a doubling of the R01 modular budget limit is needed.
Suggestion: work harder with legislative/executive branches of government to substantially increase the NIH budget; status quo is unsustainable
Postdoc salary going up to 70K in other institutions!
Thank you for your continued transparency and undertaking this important baseline analysis in advance of increasing inflation. If understand correctly, total NIH RPG investment in inflation-adjusted dollars has held steady since 1998. Individual investigators typically think in terms of funding per individual RPG. Given the increase in overall award numbers (Fig. 1, 27k to 39k since 1998) and the constant RPG investment, one would expect that the inflation-adjusted investment per award has dramatically decreased over time. A similar analysis looking at individual award type (e.g. R01) would be interesting as well as breakdowns by NIH institute/center.
Couldn’t agree more! Giving out the same or even a larger number of of RPG and R01-equivalent awards with a fixed limit budget that is not adjusted means that everyone is getting increasingly less and less to work with.
I also agree that it seems disingenuous not to be transparent about the fact that trainee and PI salaries, supplies, and services have increased so much that a grant given out today would not support the same number of trainees, nor be able to purchase the same reagents (just look at the price of antibodies) as in the recent past. That doesn’t even take into account that to get the grants today, a lot more preliminary data is needed and the expectation that much more needs to delivered. The philosophy that maintains that we need to keep doing more with less is self-defeating and illogical (at the limit it, aims to do everything with nothing). Using the number of (unadjusted) awarded grants is inadequate as a measure of success.
As others have noted, this completely ignores the caps that have remained the same for almost 20 years now. To keep up with inflation over the last 15 years, the cap should be $700,000 for an R01!
Remember, the modular limit isn’t a cap on the amount an applicant can request, its merely the threshold for whether a detailed budget is required. This NCI blog post by Dr. Norman Sharpless, Modular versus Non-Modular Budgets: What’s the Bottom Line?, provides a nice analysis that concludes “a principal investigator should submit a grant application with the right-sized budget for the research being proposed.”
I appreciate the distinction between a cap and a threshold, but my experience as a reviewer is that budgets over $500k are generally viewed with some suspicion and cynicism by study sections, although it is remarkable how many budgets are $499,999 per year! Also, budgets often change right up to the final moment and that is simply incompatible with pre-approval.
Simple Numbers above is quoting base salaries WITHOUT benefits which could be 20-30% on top of the base. Currently a level 0 post-doc is ~55K/yr base (to ~66K/yr base for level 7). Basically, these days a modular R01 covers part of the PI salary, pays a full post-doc maybe a grad student and possibly some minor % for collaborators and then you might have some supply funds to do the actual work.
Faculty salaries and graduate stipends are certainly not keeping up with inflation, and in some ways I am happy that faculty salaries have not gone up by the same % as the post-doc salary (from 2000-2020) as I would have to work even harder to secure grants just to cover salary.
Basically, a modular R01 really limits collaboration (due to the budget), which in turn results in a weak grant. Then, if you go non-modular they tend to cut it anyway close to modular levels……can’t win. You need 2 R01s as PI these days just to have a viable lab.
Thank you for this analysis – you have answered many questions I have had for a while.
Question: How long has the $500,000 direct cost cap been in existence?
Inflation is certainly causing investigators to have to keep cutting their budgets. We are being asked to do more science for less dollars.
Comment: Once grants are awarded, the budget is cut (10-15%), and recently, whole years have been cut (a 5y grant becomes a 4y grant). This compounds the pressure on investigators to try to figure out a way to accomplish their studies. No investigator’s grant budget has fluff in it (!), so when the grant award is cut, less science can be performed and fewer trainees can be funded. I believe these issues are partly responsible for the mid-career exodus of scientists from academia (Gerwin, Nature, 606: page 213, 2 June 2022).
$500,000 is actually not a cost cap, its a planning tool. For applications requesting $500,000 or more direct costs for any year, applicants must seek agreement to accept assignment from Institute/Center staff at least 6 weeks prior to the anticipated submission of any application. See NIH Guide Notice dated October 16, 2001. (This policy does not apply to applications submitted in response to RFAs or in response to other Announcements that include specific budgetary limits.) The policy is intended to help Institutes plan, and provides the opportunity for NIH staff to let the applicant know if they don’t expect to be able to fund an application of that size, which saves the applicant the time of writing an application that would not have a chance of being funded.
You can find this and other related policies on our Submission Policies web page.
I think the point is that $500k should no longer be the limit for getting special permission to proceed with submission; it should be increased proportionally to the cost of research increases.
RE: “Until 2012, the BRDPI was generally higher than the GDP Price Index; since then the BRDPI has been equivalent to or lower”: Until 2012, the orange markers in Figure 1 were always higher than the teal ones. Since then they were higher four times, similar four times, and lower twice. It seems counterfactual to summarize that as “equivalent to or lower.”
The explanation of inflation-adjusted cost trends is valuable, and per earlier comments, there does seem to be a very strong basis here for NIH to raise the dollar limits for the R03, R21, and R15 awards. It is 2022, even the compacts come equipped with dash screens and collision avoidance technologies.
NIH Staff : “Remember, the modular limit isn’t a cap on the amount an applicant can request,”, “$500,000 is actually not a cost cap, its a planning tool.”
This implies that you believe there are no implications whatsoever about who is (and is not) approved for going over the $500k limit from various Program staffs and, more importantly, that you believe that budget levels are review-neutral. Neither of these are true. Even if this latter was the case, we still have the problem that applicants believe the size of their proposal will influence the review of their proposals. And that leads them to want to stick within the modular limit.
So perhaps you could explain why the modular budget process was adopted in the first place and approximately what fraction of R01 proposals were coming in at $250,000 or below at that time. Contrast that with your current rationale for keeping the modular limit where it is, the reasons for having any limit at all and or the reasons for keeping a modular budgeting approach.
It would also be immensely helpful, if it is indeed the case that budget does not affect review, to do some in-depth analysis of outcomes for R01s proposed with in the modular limit, between $250,001-$499,999 and those that trigger the $500k pre-approval requirement. Analysis that includes all of the usual factors of applicant experience, sex, race, ethnicity and all of the stuff that went into your “probit models” in Ginther et al. (2011), of course.
As an Assistant Professor, my first “starter” R01 in the mid 90s funded ~5 people in my lab- mostly graduate students but typically one tech or postdoc. Now the same R01, maxed out at the 250K modular budget limit, supports about 2-2.5 people.
I see this trend across our entire department. Labs are much smaller. We built a new building in the 90s with each module designed to support 4 people and figuring on 2-3 modules per full Professor lab. Few labs fill this space.
As another respondent wrote, as investigators we feel the impact of inflation in the funds available per grant. In practical terms, the R01 has taken more than an ~50% hit in terms of the personnel supported by what was a modest R01 in the 90s to a full modular grant now in 2022.