
40 Comments
Introduction
In its Fall 2020 edition the Journal of Economic Perspectives featured articles on income and wealth inequality. There is ample evidence that in the United States and in Europe inequality has increased over the last 40-50 years. While the factors underlying increasing inequality are complex, there is also concern that high levels of inequality are themselves harmful, possibly contributing to worse population health (e.g., lower life expectancy, higher infant mortality, and more mental illness).
There are similar concerns about the distribution of funding across NIH-supported scientists. Katz and Matter described increasing inequality over time, while the ACD Working Group on Changing the Culture to End Sexual Harassment voiced concern that “the concentration of funding in a relatively small number of investigators” might contribute to unsafe working environments. One intriguing report suggested that excess concentration of resources might inhibit scientific innovation.
This past September, my colleague and I published a paper in the journal eLife on inequalities in the support of scientists designated as Principal Investigators (PIs) of NIH Research Project Grant (RPG) awards. We found that funding inequality among PIs has increased over the past 25 years, but may have decreased modestly in more recent years. We also found greater levels of inequality across organizations.
Measuring Inequality
Before describing the main findings of our paper, we’d like to illustrate three ways in which we measured inequality. Imagine a funding universe with 10 PIs (named “A” through “J”) with $200 million available. Table 1 shows an extreme case in which there is essentially no inequality; eight PIs receive $20 million each, while one PI gets $30 million and another gets “only” $10 million. We present the data in descending order of funding. The PI with the most funding appears at the top, and the PI with the least funding on the bottom. The columns in the table are:
- PI name (“A” through “J”)
- Funding: the amount of funding in support of each PI
- Cumulative Funding: the total amount of funding supporting that PI and all other PIs receiving higher levels of funding (higher up in the Table)
- Cumulative Proportion of Funding: the proportion of total funding (in percent) supporting that PI and all other PIs receiving higher levels of funding.
Table 1 shows one measure of inequality, namely the proportion of funding going to the most highly funded PIs. In this case, we can say that the top 10% of PIs (that is the top one PI in this sample of 10 PIs) were supported by 15% of the funding.
Table 2 shows another extreme case, here one where there is near maximal inequality with one PI (the top 10%) supported by 91% of the funds. Table 3 shows what we’ll call an “in-between,” arguably more realistic, case where there is some degree of inequality with the top 10% supported by 40% of the funds.
In our paper we similarly used a top-proportion approach, focusing on the percent of funding going to the top 1% of PIs. We used two other measures of inequality:
- The standard deviation of the log of funding (“SD-log”), a measure thought to reflect more the low and middle rungs of funding.
- The “Theil Index,” a measure more sensitive to the higher rungs of funding, but also one that enables us to explore inequalities between groups as well as those within groups.
Table 4 shows all 3 measures of inequality for the 3 simulations in Tables 1 – 3. Higher levels of inequality appear as higher values for SD-log and Theil Index.
Inequality of Funding for RPG Principal Investigators
Now let’s apply these 3 measures to the population of PIs supported by NIH RPG awards. Figure 1 panel A shows the proportion of funds going to the top 1%, top 10%, and bottom 50% of PIs. These data include all PIs supported by at least one RPG, but excludes funding from the American Recovery and Reinvestment Act (ARRA) and from COVID-19 supplemental appropriations. Panel B focuses on the top 1%; note that over time the top 1% went from being supported by 8% to over 11% of funds. While this may not seem like much, given that the NIH spends over $21 Billion for funding RPGs and that the average RPG costs $500,000, this difference translates into $660 million (in FY20 dollars) or 1320 grants. Panel C shows changes in funding inequality according to SD-log while Panel D shows changes in the Theil Index.
How might we interpret the findings in Figure 1? Note that all 4 panels include 3 vertical lines, corresponding to 1998, 2003, and 2013. The NIH-doubling occurred from 1998 to 2003, while 2013 was the year of budget sequestration when even the nominal budget of NIH decreased. Beginning in 2014 NIH has seen steady and consistent increases in appropriations. With these in mind:
- Budget increases (1998 to 2003, 2014 and onward) were associated with increases in inequality linked to the highest rungs of funding (top 1% in Panels A and B, Theil Index).
- Budget increases were associated with differing patterns of changes in inequality linked to the lower rungs of funding. After 2014, inequality increased for the lower rungs of funding (Panel A showing declines for the bottom 50% of funded PI’s; Panel C showing rising SD-log). In contrast, between 1998 and 2003 inequality actually declined for the lower rungs (Panel A shows slight increases for the bottom 50%; Panel C shows declines in SD-log).
- Over the most recent years (2017 to 2020) inequality linked to the highest rungs of funding has modestly decreased.
Who are the top 1%? Table 5 shows characteristics of 34,936 principal investigators funded in fiscal year 2020. The top 1% of funded RPG PI’s were more likely to be in later career stages, to be White and male, to hold an MD degree, and to be supported on multiple RPG awards.
Inequalities Between and Within Groups
We previously mentioned that one of the features of the Theil Index is that we can explore between group and within group factors contributing to inequalities. Imagine that instead of studying funding inequalities among RPG PIs we were interested in height inequalities among a population of athletes that only included horse racing jockeys and professional basketball players. We would find much inequality, with much of the inequality occurring between groups: jockeys are rarely taller than 5’7″ while professional basketball players are rarely shorter than 6’. In contrast, if we were interested in height inequality solely among professional basketball players based in East-Coast or West-Coast cities, we would find that nearly all the inequality would be within geographic groups.
With that in mind, Figure 2 shows using box plots the FY 2020 distribution of funding to RPG PIs according to career stage, gender, race, and degree. Late career investigators, men, whites, and those holding MD degrees are better funded. Nonetheless, one notes that there appears to be greater variability within groups than between groups. As described in detail in our paper, Theil Index calculations enabled us to formally confirm the visual impression; most of the RPG PI inequalities are within groups, not between groups.
Organizational Inequalities
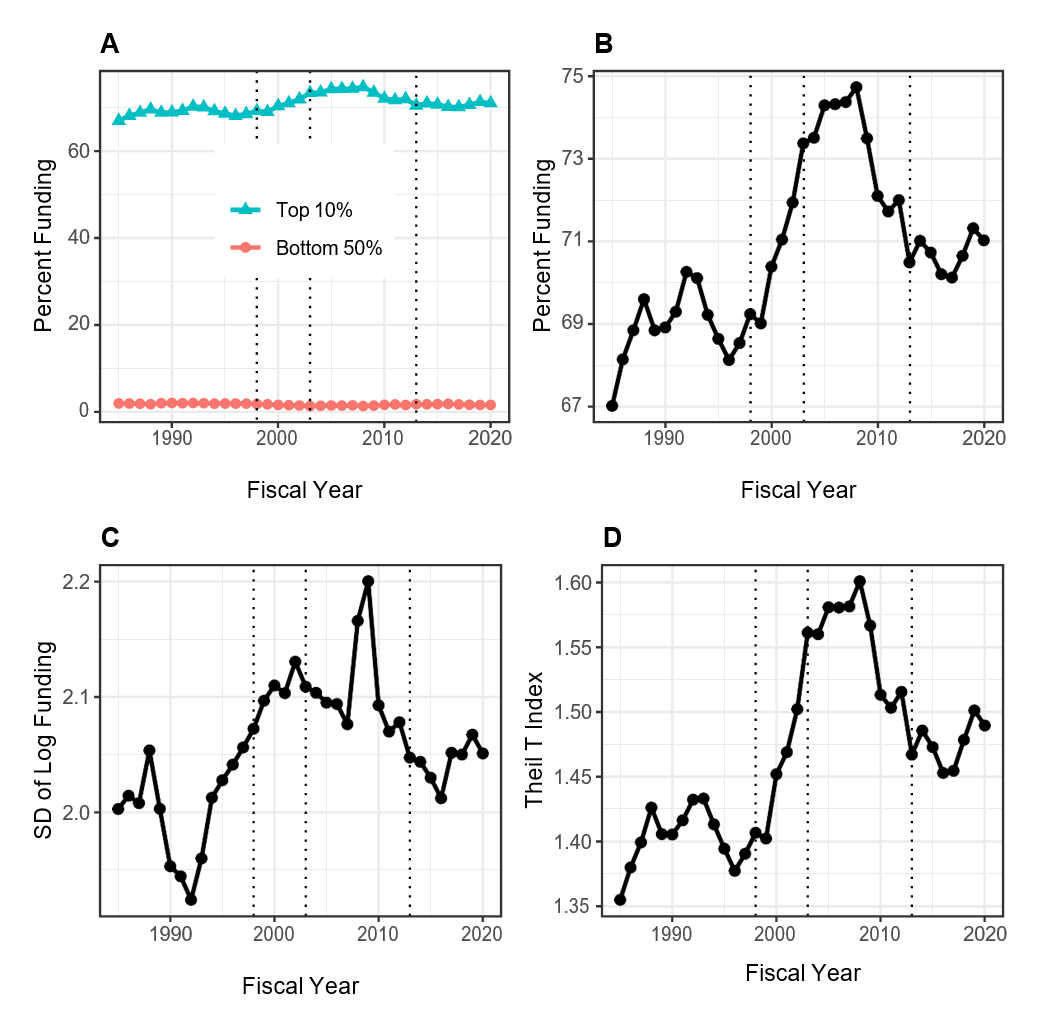
What about RPG funding inequalities among organizations? Figure 3 shows data analogous to those in Figure 1. Because the absolute number of organizations is small (e.g. in 2020 there were 1097 unique organizations receiving RPG funding) we focus on the top decile (10%) rather than the top centile. By all measures, compared to RPG PIs, there are much greater degrees of inequalities among organizations. The top 10% of organizations have been receiving approximately 70% of RPG funding, while the bottom half have received well under 5%. Inequalities increased after the doubling but decreased in the late 2000s (perhaps coincident with the 2008 financial crash).
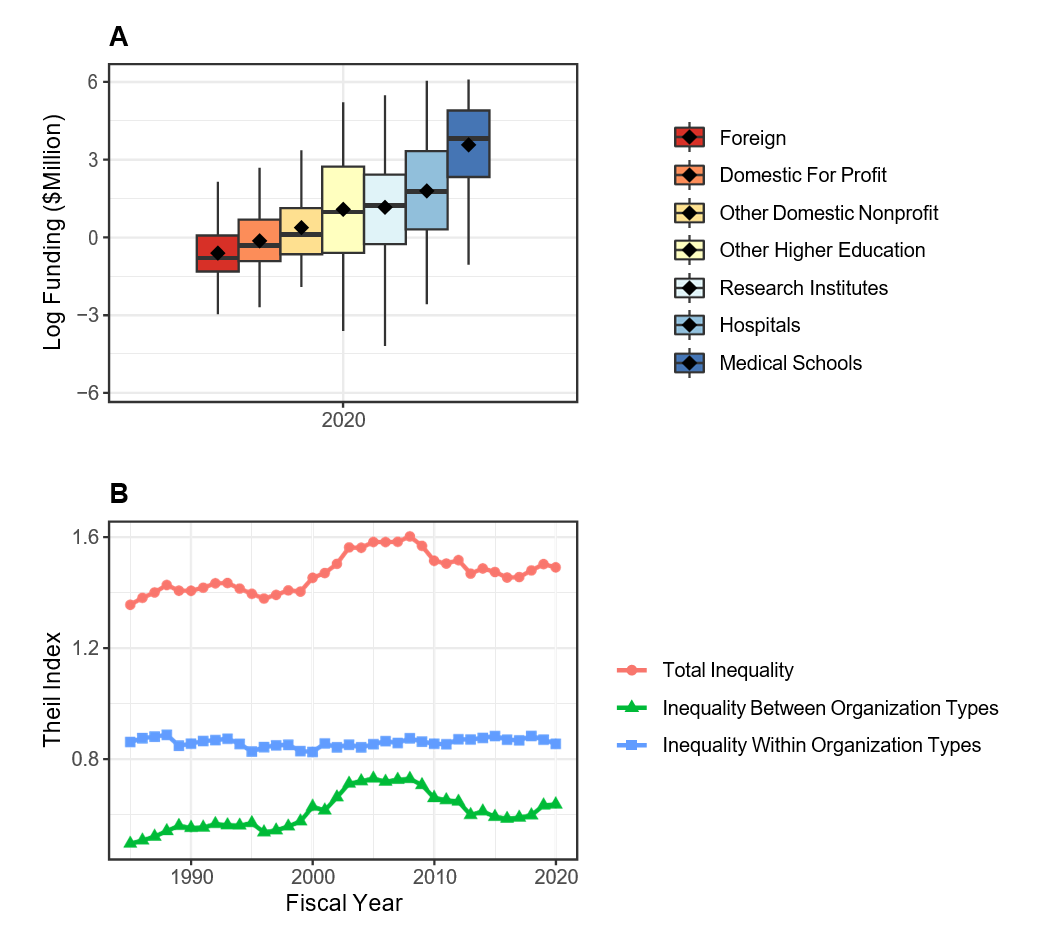
Figure 4 shows distribution of RPG funding in Fiscal Year 2020 according to organization type. There are marked differences between groups – medical schools are receiving higher levels of funding than other institutions. Theil index calculations show that organizational inequalities stem from both between group and within group variability (Panel B).
Summary
Our analyses of PIs and organizations supported by NIH RPG awards from 1998 to 2020 show that:
- Inequalities among PIs have increased since 1998, particularly at the upper rungs and at times of NIH budget increases.
- There may be a modest decline in RPG PI inequalities over the past few years.
- Most of the funding inequalities among RPG PIs are within groups, not between groups.
- Inequalities among organizations are much greater than among PIs. Both between-group and within-group inequalities contribute to overall inequality.
For readers interested in learning more, we refer you to our paper.
Table 1: Simulated table of 10 Principal Investigators (PIs) with minimal degree of funding inequality. In this case, the top one scientist (or top 10%) is supported by 15% of the funding. See text for a detailed description of the columns.
| PI | Funding ($M) | Cumulative Funding ($M) | Cumulative Proportion of Funding (%) |
| A | 30 | 30 | 15 |
| B | 20 | 50 | 25 |
| C | 20 | 70 | 35 |
| D | 20 | 90 | 45 |
| E | 20 | 110 | 55 |
| F | 20 | 130 | 65 |
| G | 20 | 150 | 75 |
| H | 20 | 170 | 85 |
| I | 20 | 190 | 95 |
| J | 10 | 200 | 100 |
Table 2: Simulated table of 10 Principal Investigators (PIs) with maximal degree of funding inequality. In this case, the top one scientist (or top 10%) is supported by 91% of the funding. See text for a detailed description of the columns.
| PI | Funding ($M) | Cumulative Funding ($M) | Cumulative Proportion of Funding (%) |
| A | 182 | 182 | 91 |
| B | 2 | 184 | 92 |
| C | 2 | 186 | 93 |
| D | 2 | 188 | 94 |
| E | 2 | 190 | 95 |
| F | 2 | 192 | 96 |
| G | 2 | 194 | 97 |
| H | 2 | 196 | 98 |
| I | 2 | 198 | 99 |
| J | 2 | 200 | 100 |
Table 3: Simulated table of 10 Principal Investigators (PIs) with an in-between degree of funding inequality. In this case, the top one scientist (or top 10%) is supported by 40% of the funding. See text for a detailed description of the columns.
| PI | Funding ($M) | Cumulative Funding ($M) | Cumulative Proportion of Funding (%) |
| A | 80 | 80 | 40 |
| B | 30 | 110 | 55 |
| C | 20 | 130 | 65 |
| D | 18 | 148 | 74 |
| E | 16 | 164 | 82 |
| F | 12 | 176 | 88 |
| G | 10 | 186 | 93 |
| H | 8 | 194 | 97 |
| I | 4 | 198 | 99 |
| J | 2 | 200 | 100 |
Table 4: Summary of Research Project Grant (RPG) Principal Investigator (PI) funding inequality measures for the 3 simulations shown in Tables 1-3. SD-log is the standard deviation of the log of funding. See text for details.
| RPG PI Funding Scenario | Proportion Top 10% | SD-log | Theil Index |
| Minimal (Table 1) | 15 | 0.27 | 0.03 |
| Between (Table 2) | 40 | 1.03 | 0.43 |
| Maximal (Table 3) | 91 | 1.43 | 1.80 |
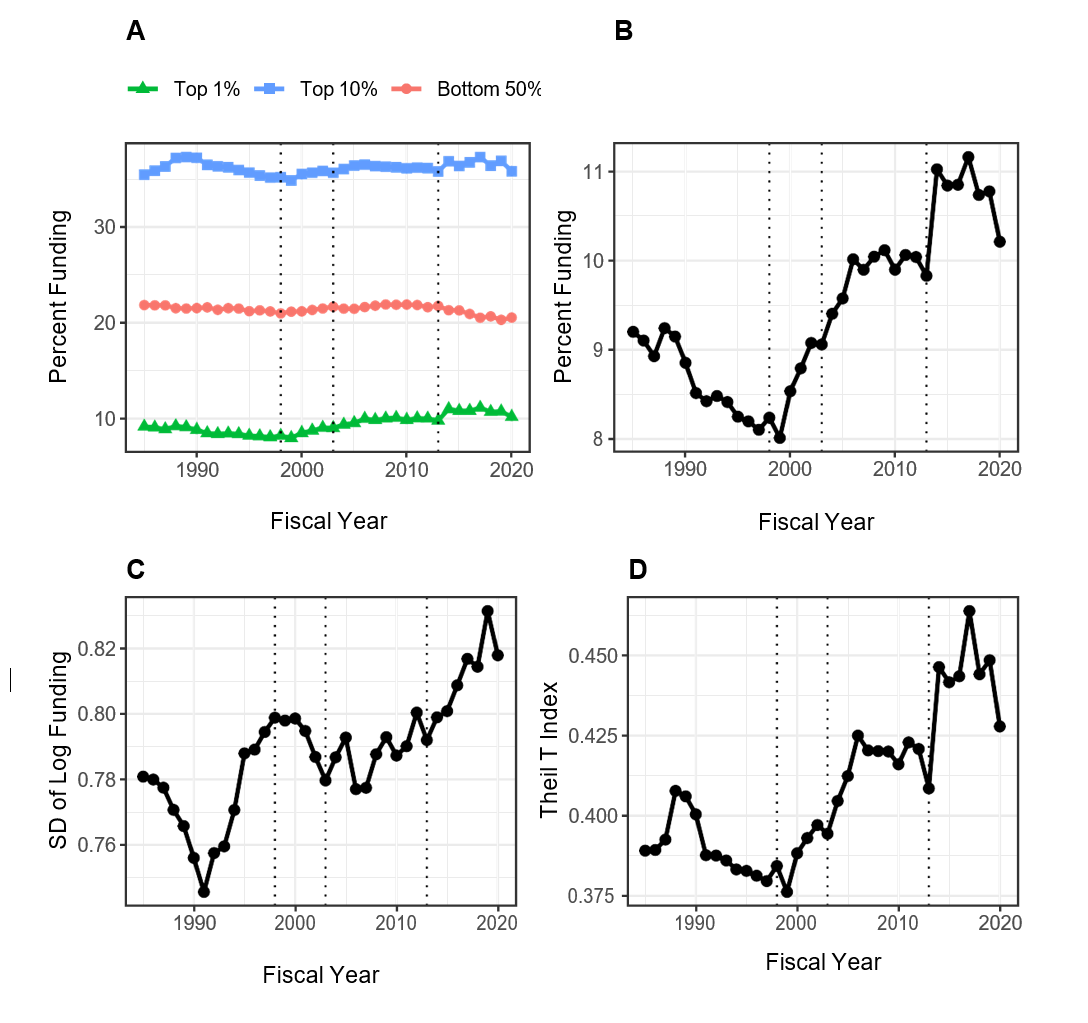
Table 5: Investigator Characteristics According to Centile of Funding in Fiscal Year 2020. Values shown in parentheses are percentages for categorical variables and IQR for continuous variables. IQR = inter-quartile range. ND = not displayed due to small cell size.
| Characteristic | Top 1% | Bottom 99% | |
|---|---|---|---|
| Total N (%) | 349 (1.0) | 34587 (99.0) | |
| Career Stage | Early | 30 (8.6) | 10567 (30.6) |
| Middle | 128 (36.7) | 12936 (37.4) | |
| Late | 162 (46.4) | 8273 (23.9) | |
| Gender | Female | 102 (29.2) | 11858 (34.3) |
| Male | 241 (69.1) | 21695 (62.7) | |
| Race | White | 277 (79.4) | 23264 (67.3) |
| Asian | 42 (12.0) | 7523 (21.8) | |
| Black or African-American | ND | 639 (1.8) | |
| More than One Race | ND | 418 (1.2) | |
| Ethnicity | Hispanic | 12 (3.4) | 1622 (4.7) |
| Not Hispanic | 306 (87.7) | 29513 (85.3) | |
| Degree | PhD | 166 (47.6) | 24620 (71.2) |
| MD | 116 (33.2) | 5238 (15.1) | |
| MD-PhD | 60 (17.2) | 3572 (10.3) | |
| Other | ND | 1157 (3.3) | |
| Funding in $Million | Median (IQR) | 4.8 (4.0 to 6.5) | 0.4 (0.3 to 0.7) |
| Number of RPG Awards | One | 69 (19.8) | 23268 (67.3) |
| Two | 86 (24.6) | 7571 (21.9) | |
| Three | 52 (14.9) | 2540 (7.3) | |
| Four | 60 (17.2) | 847 (2.4) | |
| Five or More | 82 (23.5) | 361 (1.0) |

Outstanding and interesting and important insight. I wish that the general subject/field of the research could have also been evaluated — perhaps this data exists elsewhere
I agree.
I would add inequalities in funding by score. For example, an R21 with score 18 that was not funded.
This is brilliant and true. Have witnessed this play out during my career as a Physician Scientist. Does it also the match time when there were greater numbers of less represented minorities and women joining the scientist/clinical investigator workforce- gaining their MDs, PhDs , joining academic faculty positions and increasing the competition? Made me wonder about that.
So in summary regarding institutions: The rich get richer; the poor get the picture…
Isn’t this really a case of the better scientists get funded. If the funding is based on scientific merit wouldn’t the best merit deserve the most funding? If NIH wants to get more women and nonwhites funded, they should start early in their careers with remedial and tutorial assistance to help them write better applications.
Wow. No replies to this comment? “remedial and tutorial assistance”? I haven’t heard PUBLIC statements like this since the 1980s. I’m speechless.
This comment shows a complete lack of comprehension on what it takes to get funded in today’s environment, particularly as an early stage investigator who is also a gender/racial minority. It’s true, we who are minorities mostly have applications judged on merit. It’s just that the white men we’re competing with are not. They get a leg up because of demographics, not the merit of their science. This inequality is so frequently seen in the peer review process, and it ruins careers of hugely talented and creative scientists before they can even start. What a tone deaf comment.
Quite insightful! This is something we have known for some time but its great to be able to see the numbers. There could be more granular aspect of this work to include institutions granted, states, and of course the demographics.
Excellent work!
It would be interesting to see if % indirect rate (which vary considerably) are associated with the inequality between organizations and between PIs. As those indirects can be used to offset a host of expenses or support different types of research infrastructure.
It is critical to develop indices to measure the quality of the RPGs and perhaps more important is to measure the scientific product in terms of publications and their citation scores. It is likely that the grantees improve their grant applications with experience, and that the best grantees improve more. Do the most successful grantees in terms of funding levels also produce the most papers related to their grants or the most impactful papers etc. These are the kind of data that will open up a new avenue for addressing what currently looks like a problem. Perhaps there is serious bias against junior investigators, women and racial/ethnic subgroups at the level of grant review. Perhaps there are also differences in mentorship and training. The answers to such questions involve dramatically different approaches. This problem looks like it has many causes and the solutions will need to match the range of causes.
I would also be interested to see how efficient differently sized academic labs are. In my experience, there is a lot of waste at the top. Small and moderately sized labs have been better at mentorship and training and may even produce more papers per capita. Sure, big labs tend to publish high impact work, but there is a lot of work that goes unnoticed and many trainees are lost in the system. We need a pro con list of inequity vs. equity in academic science.
Dear Dr. Lauer, thank you for leading this very comprehensive analysis. I noticed that the funding rates for Asian PIs are even lower than African American/Black PIs and both ethnic groups show lower success rates in general. However, Asians are not an “NIH-defined minority” and do not benefit from any of the current diversity initiatives. Are there any thoughts on this inequality that has been ongoing for decades and will continue into the next decade? Thank you.
We’ll be putting out more on this soon, stay tuned!
It is really sad to me that individuals with disabilities don’t even make the list. The NIH claims that including more such PIs is a goal of its diversity initiatives but they don’t really seem to care.
I agree with this. The reality is no one seems to pay attention to this in practice and it’s mostly on paper. Disabilities are real and does affect those who have have it and can dampen productivity putting these PIs at a disadvantage.
Excellent analysis. Is there data showing the distribution by discipline (basic research, engineering/technology-driven, clinical)?
I can appreciate efforts to analyze the distribution of funding data and identifying inequities. What discourages me is that so few meaningful steps have been taken at NIH to redress the issue. There are a number of troubling trends here; but the one which I find somewhat offensive, as a PI that looks to “make ends meet” for my research program, is the multiple RPGs stockpiled by programs/investigators in the upper levels. Consider this (calculated easily from Table 5, re-compiling the 1% and 99% numbers): a full 33% of RPGs are to investigators that hold 2 or more awards; 11% are to investigators with 3 or more awards. Why is that still the case in a funding atmosphere where study sections frequently turn down about 80% (or more) of applications? I think an easy step away from gender/ethnic/racial/geographic inequities would be accomplished by simply funding more “single RPG” investigators.
Here my impression is NSF has done a better job re-dressing the “top 10%” inequities; there seems to be less resistance outside of medical-oriented research.
I am in the vast pool of PI’s who believe that NIH needs to have a cap on amounts of awards (not as extreme or ham-handed as the stated – if not always followed – process at NIGMS), so there is a risk of confirmation bias in wanting to like this analysis. However I have a methodological concern or question (not enough time to do more than skim the linked article). Are these data normalized or processed in a way that deals with the inherent difference between RPGs involving patients / clinical studies – which inherently cost a great deal more and will link to the cited enrichment or over-representation of MD PIs? Otherwise, the comparison builds in a bias – especially by focusing only on the top 1% (and not also including the top 5% or 10%). I don’t have a dog in the hunt, but once an RPG (which includes all sorts of P and U series awards, which also always are way bigger) require sufficient FTEs of clinicians and study nurses, the award size becomes massive. Since NIH has known of and refused to deal with the problems inherent in having the super-funded (most egregiously, in refusing to require a substantial minimum PI effort commitment – say, 20% – in all years of an award), one can only hope that the DEI aspect of the matter would lead to some real change.
Irrespective of the ethnicity or an Institute, If a PI or MPIs get more than 5 R01s or equivalent or larger funding and don’t produce any groundbreaking research within 10 -12years, they should not be funded again.
I have problems with the premise of this research into funding “inequality”. Simply spitting out numbers without a thorough understanding of the variables and productivity metrics linked to the $ awarded is meaningless and a recipe for ill-designed policies. We have long recognized that the peer-review system has its flaws, but is arguably “the best after all the others that we know about”. Granted, savvy proposal writers have long understood how they have to assemble a proposal in order to get it funded. Is that bad? Why should there be equality? Those countries in which social political considerations are behind funding decisions rather than Darwinian ones like in the US suffer from low impact research productivity. China that was nowhere until 40 years ago has adopted a highly competitive funding system based on the US model and are now rapidly catching up with high impact science papers in all fields. Is the mandate of NIH still to fund the best research or to ensure everybody will get a piece of the pie, i.e. a recipe for collective mediocrity?
I seems that posting statistics and white papers doesn’t really change things much. The NIH needs to take a more proactive approach to address bias.
The text draws conclusions based on the data in shown in Table 5 and Figure 2, but these don’t seem to be results of hypothesis tests. Those boxplots overlap a lot. What is the probability that the observed differences are just due to chance? What is the probability of the data given specified models? It’s seems odd that the NIH would put out a report and not present basic statistical tests to support the conclusions it draws. I certainly wouldn’t be funded if I turned in a grant like this!
I definely agree with multiple of the comments above, particularly what actions are taking toward the inequality as well as the specific posting regarding Asian group. Given that the pubished paper is at least make things more transparent, a plan with step by step actions toward a final solution would certainly makes people feel better than just looking at the data and get discouraged for what one has been suspecting is true.
Current study section review procedures allows for much bias on the part of reviewers to creep in. Why not have a two step process that would first allow for “blind review” which would not include the applicant’s name and institution. Based on this first score the application could then be “opened up” to allow for consideration of the experience of the team and institutional resources that would facilitate the proposed work to be accomplished – something that could be rated on a “pass/fail” basis.
These well-funded PI’s play another drama including their names in the publications from research groups in many different countries to increase their publication record and citations. Research groups in other countries use these PI’s names to publish their research in highly ranked journals due to these USA-based PI’s reputation. This habit is also unfair for many regular PI’s who published papers based on their own research. In addition, certain investigators include well-known PI as a co-PI in their grants to get funded. It seems that federally funded research enterprise is heavily corrupted.
The process of reviewing grants (specifically R01’s) would benefit from separating new PI’s from established one and NOT have them compete against each other. This would allow an easier evaluation of progress in equity for all awards. Additionally, resubmitted grants should be reviewed by the same group that rejected it in the first place and not a new one that does not truly evaluate the previous concerns (addressed or not) and comes up with new ones.
The whole system is not conducive to success of new investigators and the established ones know how to play the game perfectly (whether they deserve awards or not).
I guess I missed it, when NIH converted from the priority being to do the best research with public money to solve public medical problems to being absolutely equitable in passing the money to everyone that would like to have it without considering whether the public medical issues were effectively covered. If you had ever been on study section, you would know that it is relatively easy to discard at least half of the grants as not worth funding and maybe not worth trying to fix and then to prioritize the others into an order where the best work in the public interest will get the money.
NIH should give investigators an even try and they do that in many ways, but the real reason for NIH is to get the job done, i.e. solve the public’s medical issues.
Equitable is nice and everyone likes it, but this is spending the public’s money to do a job the best way.
I am sure that the reviewers think they are unbiased, but when the funds are limited, one needs a “champion” at the table to sway the discussion. My experience has been that a negative comment can snowball at a study section. While I agree that most reviewers can distinguish a good application from a poor one, I would question whether there is enough dispassionate expertise around the table to truly prioritize the good grants and predict which will be most effective in improving the health of the public in the future. Having “friends in high places” become really important and can result in some of the inequities described here, without anyone realizing it is happening.
Well, public interest, and a history of doing work that improves patient care, are low on the the scale for ranking grants. Investigators who have mastered the grant application process often regardless of the potential benefit to patient care ( at least in the area I am familiar with ), have consistent priority. As a result, funding often goes to investigators with decades of experience in writing grants, without regard for actual contribution to patient care.
It is also train and support the next generation scientists otherwise who will be left to do science and solve the public’s medical issues?
There are also inequalities in the ability to get work published in the top journals. Until we do blinded review of papers and grants, this will persist. Inequalities in publishing will contribute to inequalities in grant funding. DOD does blinded grant review. NIH should too. While the past record of a PI might reflect on the potential for doing further work, the review should be about the grant at hand. I’ve been on plenty review sections where there is a propensity for wanting to cut well-known PIs slack for issues that other PIs would be penalized for.
This article provided a good compilation of the disparities in funding among groups–years of research would seem to be an important factor in that experience counts in every endeavor. Also, the skewing toward PIs holding medical degrees, some of whom hold PhDs as well, is expected because they have research options beyond basic and pre-clinical research and their clinical expertise is important to bringing new therapies and diagnostics to public health systems. Disparities according to race and gender/ethnicity require a bit more digging. In this context, it is important to identify the characteristics that distinguish the grant-getting qualities of the highly successful vs. not so successful PIs. This might even begin with quality of their kindergarten; once you fall behind, it is difficult to catch up. You enter a less competitive college/university and then the same with MD or PhD training. Even psychological tests might reveal those who have competitive personalities, e.g., how many PIs were former athletes? This, of course is conjecture and a systematic investigation of the competitive vs. non-competitive PI phenotype is needed.
When applying for an NIH grant, why am I required to present far more statistical significance than you have presented here? And when will you present data on the inequity stemming from the actual applicant’s institution themselves? To be specific, how statistically significant is the difference between grants awarded to premier institutions, you know who I am talking about, Harvard, MIT, UC Berkeley, etc. etc. versus smaller operations such as mid-level schools like Bowdoin College or Oklahoma State? I have always believed the institutional address of the applicant has always been the true bias in this process.
The reason to aim at a better distribution of the funds is because we all are aware of the waste of money in those labs that have 2+ NIH R01’s, where the funding is never proportional to the productivity. Besides, we also know that the review process is inherently bias i.e. applicant profiling, ivy league vs other universities, etc. Also, it helps when members of a given study section know the applicant, that helps…a lot! (not necessary COI, but a huge bias), in other words, it depends a lot of who you know to be funded.
With the current system, it is not surprising that white males are the best funded overall, but women and hispanics are less successful.
I am surprised the NIH has yet to sued by Black Americans?
Kudos to Mike Lauer for this wonderful research on race.
The Congressional Black Caucus needs to investigate these study sessions for real.
there should be a limit on how many R01 grants a person can serve as the PI. I heard people manage more than 10 R01s the same time. I cannot image how they can do that.
You have addressed an important, and relevant issue regarding NIH funding “demographics”. However, as others have also commented, there is more to funding inequality than that. Someone commented that “the rich get richer”, referring to institutions, but there is another aspect as well. My observation, after over 36 years as a faculty member at a major research university, is that what NIH often rewards in basic science, is experience, and skill to craft and formulate grant proposals as opposed to specific aims, target outcomes, and an investigator history of contributing to changes and improvements in patient care. There are many researchers who are very productive in obtaining grants because they know how to write a grant, and they know how to target backgrounds and likely biases of members of study sections, with whom they are thoroughly familiar. All such clinical practice changes and improvements I witnessed, contributed to, and implemented in my area, originated from unfunded, or very modestly funded clinical research conducted within the course of clinical practice.
I, and I assume others would welcome a review of the cost benefit of the millions of grant dollars to patient care within the different Institutes of the NIH.
Dr Lauer, I read always with interest your analyses. A way to decrease inequality maybe to have separate study sections sessions for applications coming from different career stages PIs. We cannot continue to have late stage investigators with plenty of resources, work force, publications and experience in grantsmanship compete with early or middle career investigators. As it currently stands, R01 applications are all discussed on the same day(s) independently of career stage of the investigators. Even if recent ESI and NI NIH policies helped tremendously in helping ESI/NI to get their first R01, Reviewers will necessarily be biased towards late stage investigators by selecting the best science. Even if ESI or middle career PIs had the best and innovative ideas, on average, they cannot possibly have the amount of preliminary data and publications of a late stage PI, considering also that “preliminary” data must be almost full papers nowadays, again at the advantage of senior investigators with access to more resources. Have late stage investigators applications compete among themselves and everybody else on a different date or study section roster and establish separate paylines and money pools. This could apply also to minorities. NIH could split the budget and create separate buckets of funding. And of course only the best science will continue to be funded from each bucket.
More than 20 years ago (after I got out of the grant/race, but before my wife got out of it) I had a conversation with NIH grant officers over how poorly the NIH did at supporting young investigators (and got no argument). Specifically, there’s always been a huge emphasis at early stages on the mentor, which is important, but it shouldn’t outweigh the mentee. However, even more disturbing, was the lack of support for women/families. Grants gave my wife no cost extensions for her maternity leave, but extensions are NOT no costs. Even more disturbing, the next set of applications punishes those with families by looking at productivity, without accounting for these real life factors. None of us argue that you shouldn’t be rewarding the best science. But anyone who’s sat on a grant review committee knows that while there may be a few REALLY great applications, the difference between funded and not funded is often small and can lie in the details of the RFA and what it is rewarding. Unless and until the process looks more at the young investigators bigger picture and less at the lab, or the mentor there will continue to be problems. There have always been young investigator awards, but what we really need is more of them, as well as more early career awards and more mid-career awards (with some different requirements) that are aimed much more at widening the pipeline of ideas then supporting a small number of peoples big labs. In the long run a wider range of people coming up with big ideas is going to result in more great research – and that should be the goal.
Do you think it’s a structural problem that leads to inequalities in funding? or is it that different projects ask for or require different levels of funding to achieve their scientific objectives?
Is there data about inequity in proportion to how much grant money was requested?