
4 Comments
In their 2014 report, the Advisory Committee to the Director recommended that NIH sustain support for training of dual-degree (M.D./Ph.D.) physician scientists. As part of our ongoing efforts, we wanted to assess the success of those trainees over time.
In this analysis, we focused on the course of 33,067 predoctoral trainees, including M.D./Ph.D. (or equivalent) who were enrolled in NIH-funded institutional training programs and voluntarily reported their age, gender, race and ethnicity. (There are 11,506 predoctoral trainees who did not report complete demographic data). The cohort consisted of trainees affiliated with either the Medical Scientist Training Program (MSTP supported by the National Institute of General Medical Sciences ) (n=3,265) or other T32 pre-doctoral training programs (n=29,802) who began their training programs (i.e. matriculation year) between 1975 and 1998.
The Table shows characteristics of the trainees and programs according to the type of program (categorical variables are shown as number (%) while continuous variables are shown as 25th percentile/median/75th percentile). MSTP trainees were younger and more likely to be Asian; their programs were younger and more likely to be based at private, well-funded institutions.
| Variable | Category | MSTP Trainees (N=3,265) | Other T32 Trainees (N=29,802) |
|---|---|---|---|
| Year of Matriculation | 1982/1989/1994 | 1983/1990/1994 | |
| Years of Follow-up to Award Since Matriculation (including those who never received an award) | 19/23/30 | 20/25/32 | |
| Age of Trainee at Matriculation | 22/23/24 | 23/25/28 | |
| Gender | Male | 78% (2,563) | 53% (15,896) |
| Female | 22% (702) | 47% (13,906) | |
| Race | White | 80% (2,625) | 88% (26,298) |
| Black or African-American | 2% (77) | 3% (853) | |
| Asian | 14% (469) | 6% (1,675) | |
| American Indian/Alaska Native | 0% (<11) | 0% (73) | |
| More than One Race | 3% (87) | 3% (876) | |
| Native Hawaiian or Other Pacific Islander | 0% (<11) | 0% (27) | |
| Ethnicity | Hispanic | 3% (96) | 3% (952) |
| Non-Hispanic | 97% (3,169) | 97% (28,850) | |
| Age of Training Program | 4/10/16 | 6/13/18 | |
| Total Trainees1 | 105/177/204 | 267/684/1,183 | |
| Organization Type | Public | 26% (845) | 51% (15,317) |
| Private Non-profit | 74% (2,420) | 49% (14,485) | |
| Level of Funding2 | Rank 1 | 58% (1,902) | 43% (12,875) |
| Rank 2 | 32% (1,061) | 37% (11,113) | |
| Rank 3 | 7% (223) | 13% (3,911) | |
| Rank 4 | 0% (0) | 4% (1,092) | |
| Rank 5 | 2% (79) | 3% (811) |
a/b/c represent the lower quartile a, the median b, and the upper quartile c for continuous variables. Numbers after percentages are frequencies.
1Total Trainees is the total number of trainees enrolled between the fiscal year of program inception and fiscal year 1998.
2Level of funding is the ranking of organizations, included in this study, as per ranking of NIH funded organizations based on award amount received on research grants in the last five fiscal years (FYs 2014-2018).
Our primary outcome was time after matriculation to receipt of an NIH research project grant (RPG) in which the former trainee was designated as principal investigator (PI) according to the type of program. Follow-up continued through fiscal year 2018. As potential confounders or interacting variables, we considered each of the variables listed in the Table. We used a machine learning method to assess the relative importance of these candidate predictors.
Of the 3,265 MSTP trainees, 1,211 (37%) received an RPG award. For the other T32 trainees, 7,222 out of 33,067 (24%) received an RPG. For those that received an RPG award, the median time to award was 17 years for MSTP Trainees and 13 years for Other T32 Trainees.
Figure 1 is a Kaplan-Meier plot that shows times to receipt of an RPG award after matriculation according to program type. The figure shows that MSTP trainees begin receiving an RPG award at a faster rate (sooner) than other trainees only after 15 years since matriculation. Before then, there is little difference between the two groups.
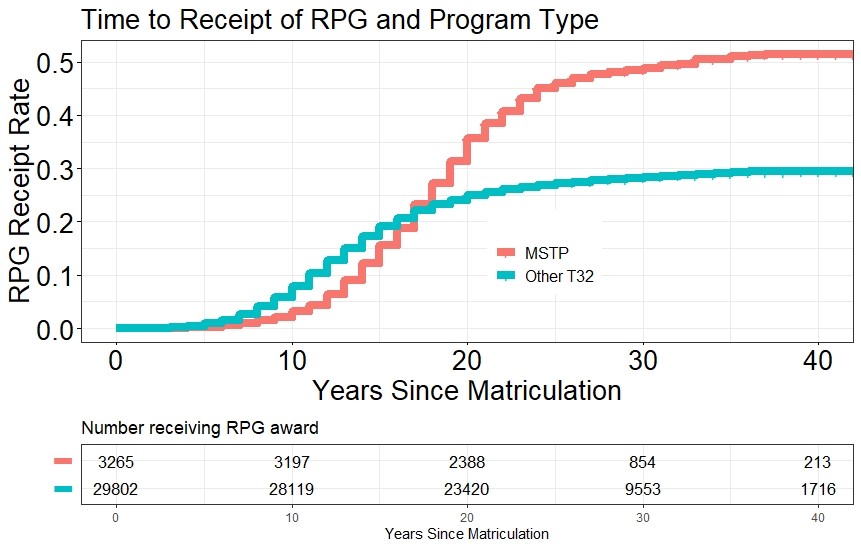
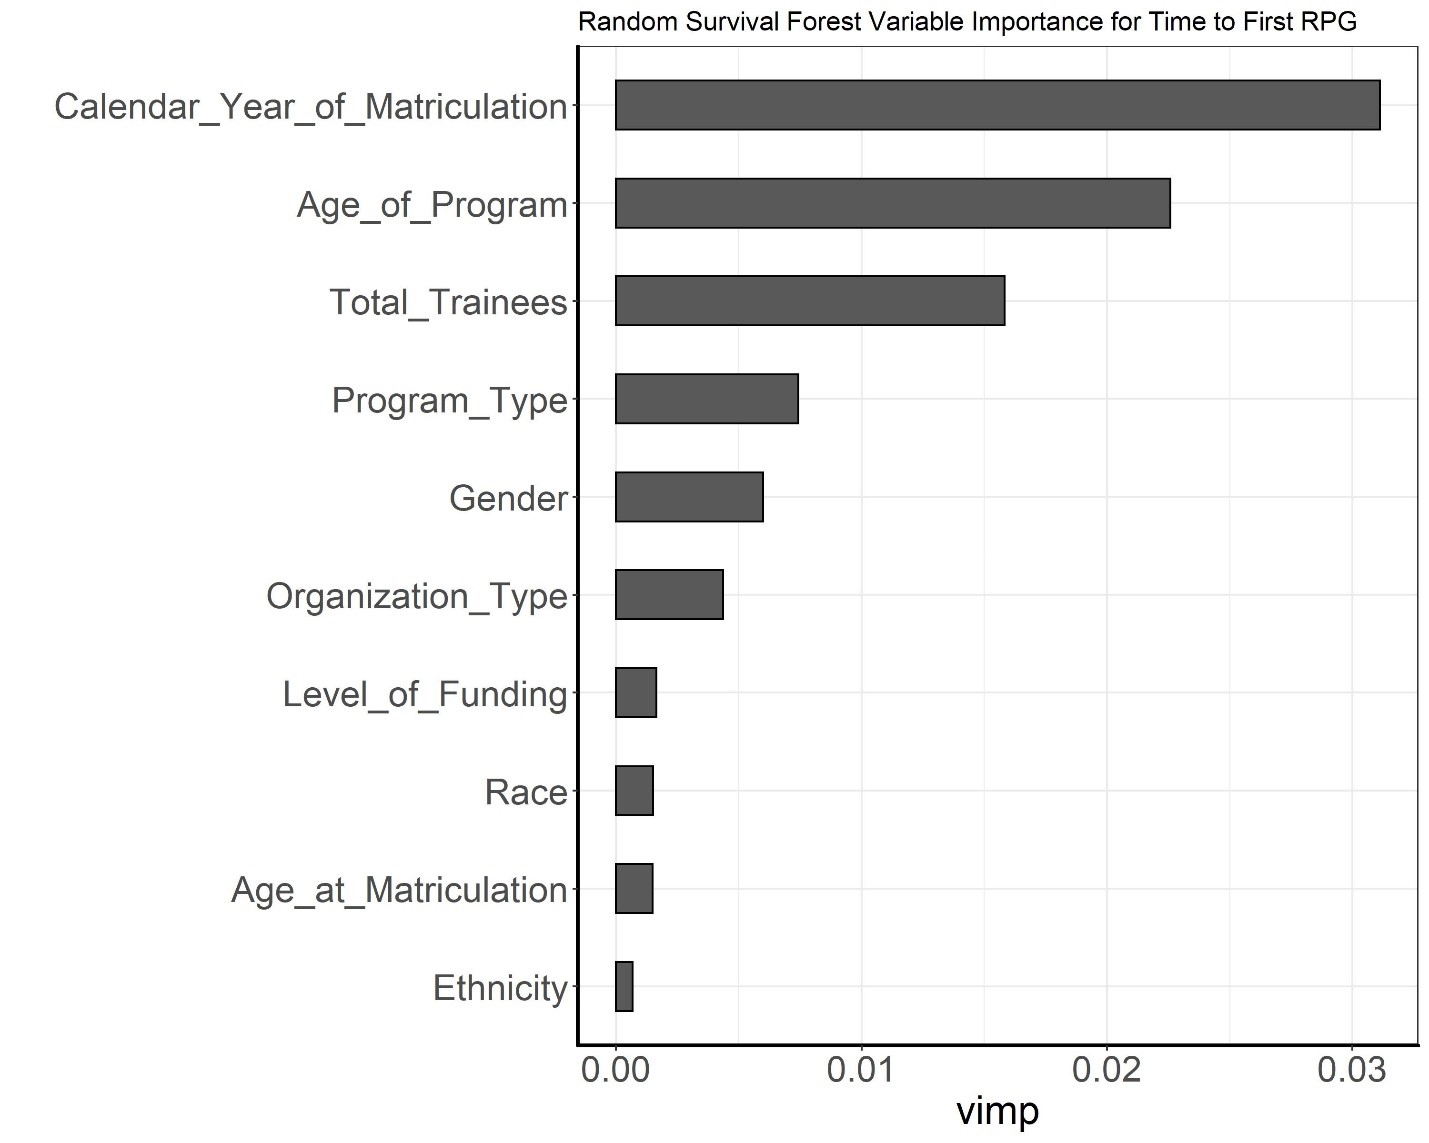
Figure 2 shows the ranking of all variables according to how predictive they were of time to receipt of an RPG award with an error rate of 38 percent. The strongest predictors were matriculation year, age of the training program and the number of trainees in an institution’s program. Predictors such as training program type and gender were less strong.
As shown in Figure 3, following up on the matriculation year, our analysis identified an association between the year a student entered a T32 training program and receipt of an NIH RPG award within 25 years, even after adjusting for all other variables listed in the Table. The proportion of trainees later designated as a PI on an awarded NIH RPG declined sharply for trainees with matriculation year 1985 and onward. After adjusting for possible confounders, trainees who started their training between 1975 and 1985 were more successful in being designated within 25 years as PI’s on an awarded NIH RPG award within 25 years since matriculation than those who started training between 1985 and 1998.
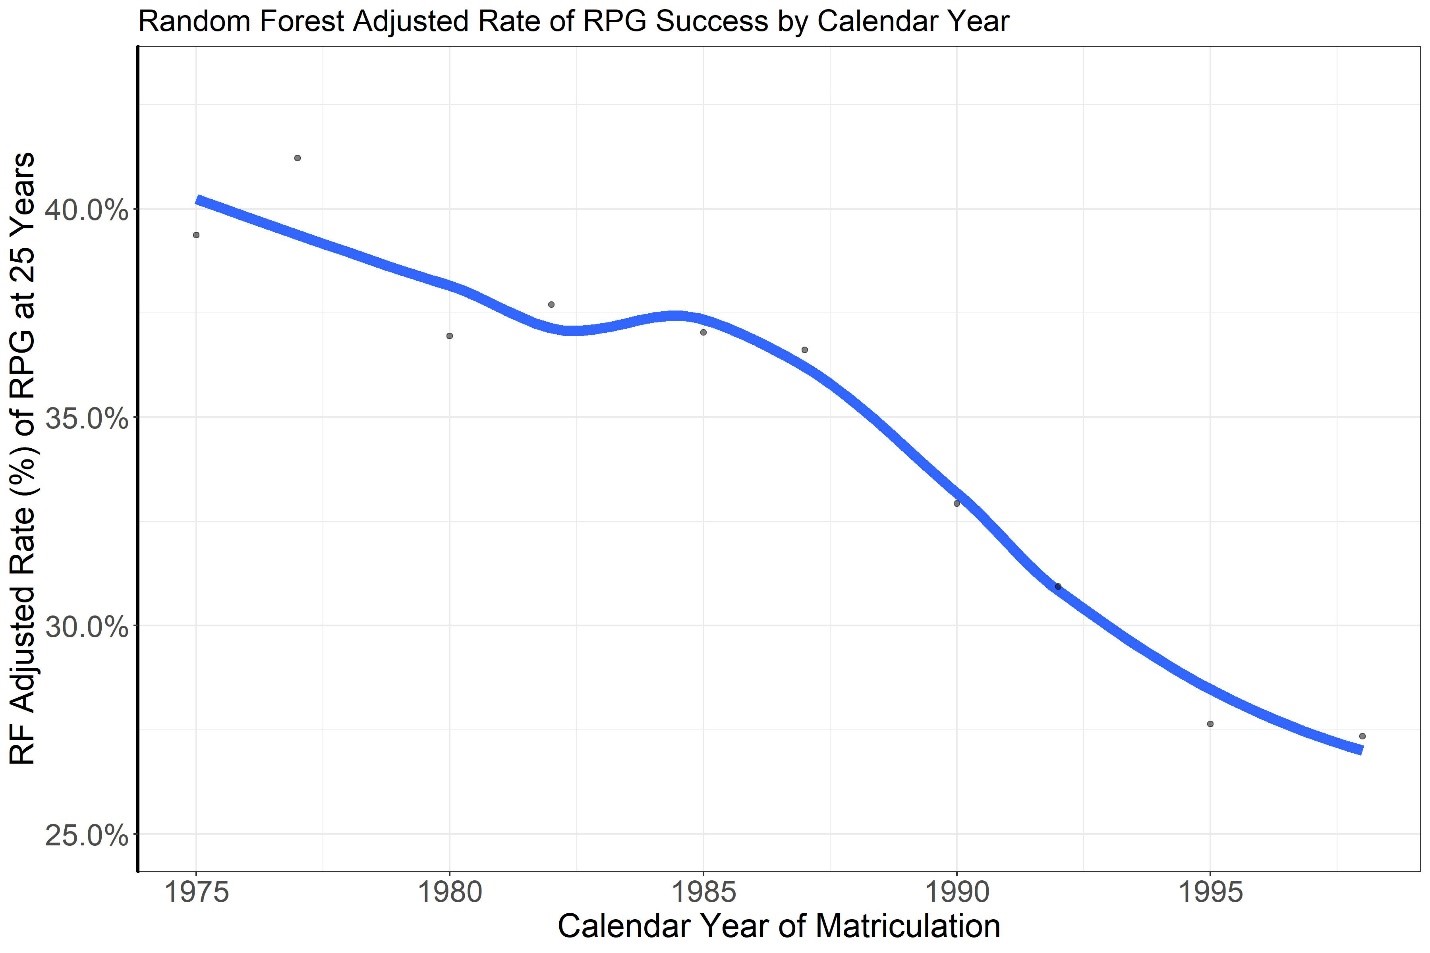
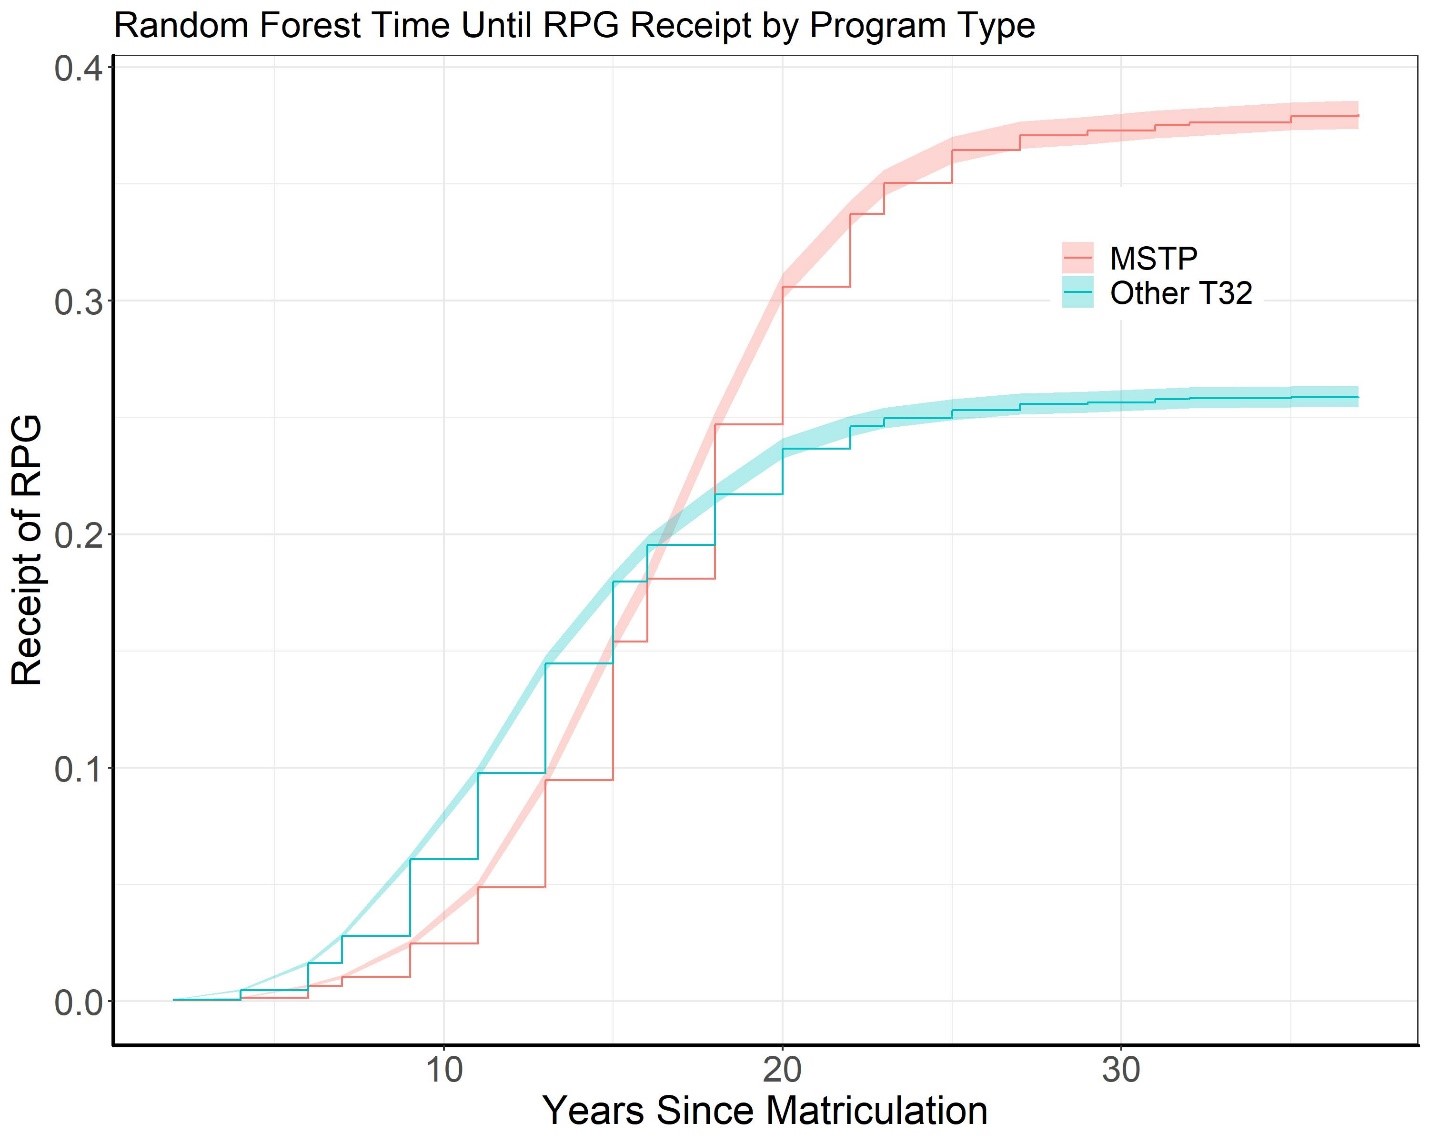
Figure 4 shows time to receipt of an RPG according to program type after adjusting for all the confounders listed in the Table in the machine learning model. Over a period of 15-40 years since entering the program, MSTP trainees (orange line) secured RPGs at a faster rate (sooner) than the other trainees (blue line). The rates of obtaining an RPG were similar for those less than 15 years since matriculation.
In summary, we found that trainees enrolled in MSTP programs were more successful in serving as PIs in subsequent RPG awards, but only after at least 15 years had elapsed. This may reflect, in part, the time needed for clinical training. Furthermore, as noted in a report available from the American Association of Medical Colleges, many M.D./Ph.D. researchers have funding from sources other than NIH (see survey results on p. 33-37 and Figure 19). Among all trainees, those who enrolled before 1985 were more successful, perhaps because they entered the system around the time of the NIH doubling when funds were more flush.
We will continue to assess these and related data to help inform future decisions related to physician scientists as well as strengthening the broader biomedical research workforce. Through analyses such as this and activities like the Next Generation Researchers Initiative, NIH will continue to generate comprehensive data on outcomes, demographics, and career aspirations of biomedical trainees and researchers. We look forward to hearing your thoughts.
I would like to thank Deepshikha Roychowdhury, Katie Patel, and Katrina Pearson from the NIH Office of Extramural Research’s Division of Statistical Analysis and Reporting for their hard work on this study.
The analysis seems to exclude perhaps the most important variable for “success”; the role of the mentor in promoting the work as that of the trainees and not their own, or that of another member of the mentor’s team. Until the analyses include a reliable measure of this variable, Lauer’s interpretations are flawed.
Thank you for this important analysis and discussion. Did you specifically exclude dual-degree individuals in the T32 group? It would be great to see a similar analysis for F30 awardees, which might be a way to look at NIH dual-degree trainee support separate from (i.e., or controlling for) MSTP support (what is the effect of each?). It may also be helpful to disentangle the numerator (RPG successfully awarded) and denominator (RPG submissions) of the outcome variable in this analysis.
What happens if you factor in years for completion of MD, and residency training? Presumably MD/PhD students do not start applying for research Grant’s until after having become Board Eligible or Boarded.
These results could be distilled into the conclusion that MD/PhDs (trained with the support of NIH MSTP funding) are more successful long-term than PhDs (trained with the support of NIH T32 funding). However, before attributing the difference to the inherent value of MSTP funding, we should factor in that those candidates who are accepted into MD/PhD programs (and receive MSTP support) tend to be the cream-of-the-cream-of-the-crop. These candidates are generally the best and brightest, compared to either the corresponding MD or PhD students at any institution. In addition, the marked difference in the type of institutions between the two groups might also be a factor in the observed differences. If one were to plot the scientific success rate of the very top PhD candidates (at the very top institutions), they might very well match that of the MD/PhDs.
I don’t mean to diminish the value of supporting of MD/PhD candidates – they are in fact the cream-of-the-crop, and the dual-degree path creates a unique and highly valuable group of scientists. But it is important to match the credentials (whatever they might be) of the two pools of applicants before attributing the differences to the training mechanism.