2 Comments
In March 2018, we showed data suggesting that, despite still being in a state of hyper-competition (as described in this post), the severity may be lessening. The number of unique applicants for NIH research project grants (RPGs) appeared to stabilize after many years of uninterrupted growth. Furthermore, a person-based metric, called the cumulative investigator rate, started to rise in fiscal year (FY) 2015 for RPGs after declines in previous years.
With FY 2018 grants information now available in the NIH Data Book, we wanted to see if this positive trend continued. As in my March 2018 blog, the FY 2018 cumulative investigator rate data discussed in this post were acquired on all NIH RPGs as well as specifically for R01-equivalent, P01, and R21 grant types for FYs 2003 to 2018.
Investigators designated on awards (referred to as “awardees” in this post) were only counted once per FY. Investigators designated on applications regardless of being funded (referred to as “applicants” here) were counted once in the current FY plus the four preceding FYs. The Cumulative Investigator Rate represents the proportion of these awardees over applicants in a particular FY.
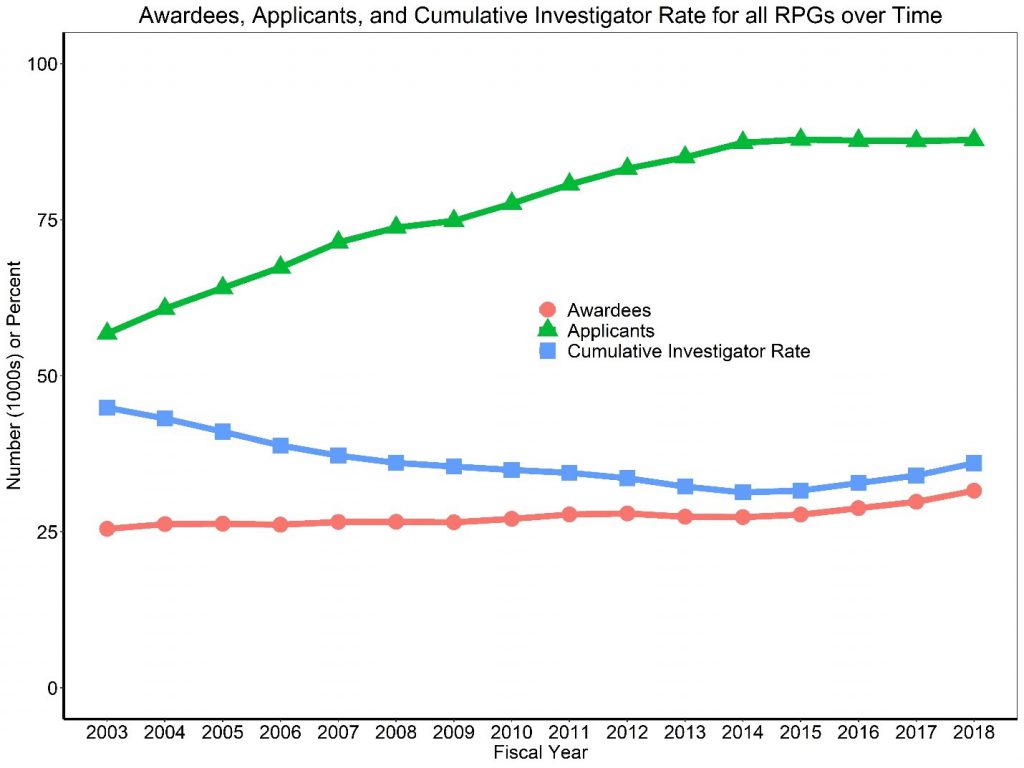
Let’s start by looking at the number of RPG applicants and awardees over time (Figure 1). As noted last year, the number of unique applicants over a 5-year window (line with green triangles) gradually increased between FYs 2003 (the end of the NIH doubling) to 2015 from 56,758 to 87,838. The number of applicants then levels off, with 87,768 in FY 2018. Over the same time, the number of unique RPG awardees (line with red circles) gradually increased from 25,479 in FY 2003 to 31,595 in FY 2018. Similar to the uptick seen in FY 2017, the FY 2018 Cumulative Investigator Rate (line with blue squares) continued to rise to 36.0 percent.

As NIH supports a diverse array of RPGs, let’s focus now on some common grant types to see what happened in FY 2018. Let’s begin with R01-equivalent grants. Please note that the definition of R01-equivalents was expanded in 2018 to include additional grant types as described in our recent FY 2018 By The Numbers (success rate) post.
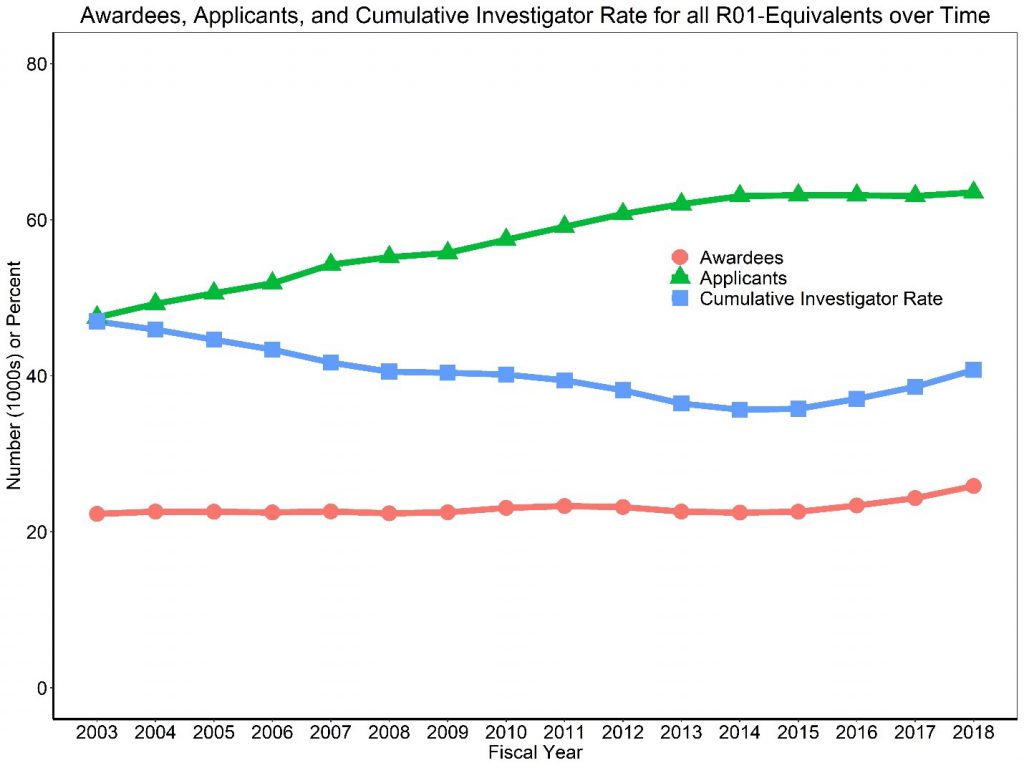
Figure 2 shows the number of applicants over a 5-year window (line with green triangles) rose steadily from 47,480 in FY 2003 to 63,024 in FY 2014, where it again levels off, with 63,490 in FY 2018. For the most part, the number of unique awardees (line with red circles) remained relatively stable over time, with a notable increase in FY 2017 and FY 2018 with 24,320 and 25,868 awardees, respectively. Again, we see an uptick in the Cumulative Investigator Rate (line with blue squares) to 40.7 percent in FY 2018.

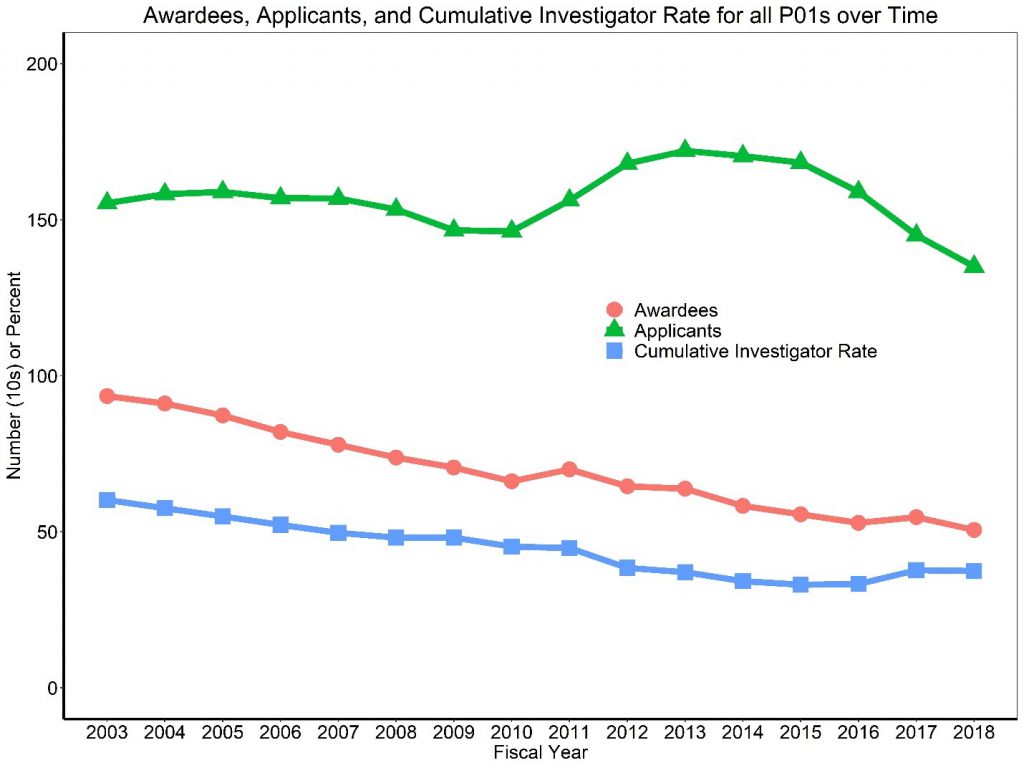
Now, what about P01 program grants? As a reminder, these grants usually support groups involving multiple researchers designed to achieve results that cannot be attained by investigators working independently. We can see the number of applicants over a 5-year window (line with green triangles) for P01s fluctuated, with 1,553 in FY 2003, peaking at 1,721 in FY 2013, and declining to 1,350 in FY 2018 (Figure 3). The number of unique awardees (line with red circles) fell from 935 in FY 2003 to 506 in FY 2018. Despite the drop in the Cumulative Investigator Rate (line with blue squares) generally seen between FYs 2003 to 2016, it does appear to begin rebounding afterwards, to 37.5 percent in FY 2018.

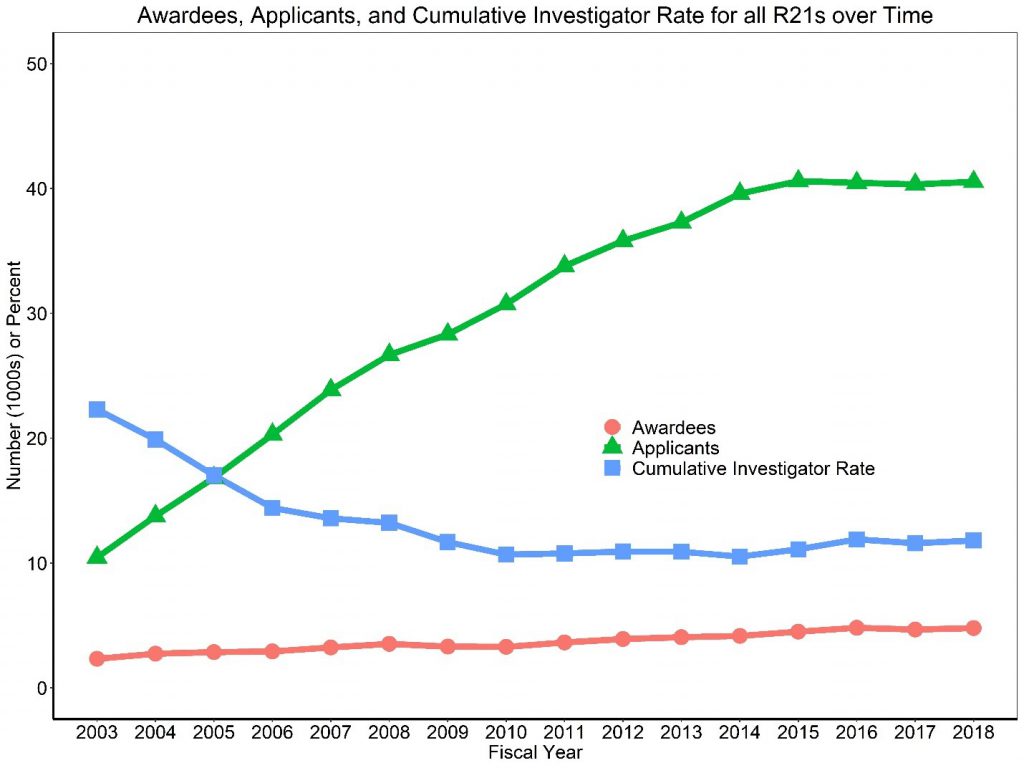
Turning our attention to R21 grants, which support early and conceptual exploratory research, the number of applicants over a 5-year window (line with green triangles) increased steadily from 10,437 in FY 2013 to 40,591 in FY 2015 (Figure 4). Again, the number of applicants levels off, with 40,533 in FY 2018. The number of unique awardees (line with red circles) generally rose over this timeframe, landing at 4,786 in FY 2018. As with other grant types, the Cumulative Investigator Rate (line with blue squares) also rose in FY 2018 to 11.8 percent, from a low of 10.5 percent in FY 2014.

In summary, the number of unique RPG, R01-equivalent, and R21 (but not P01) awardees rose again in FY 2018. The Cumulative Investigator Rate also rose for all RPGs, R01-equivalents, R21s, and P01s in FY 2018, due in part to the leveling-off or declines in the number of unique applicants. This suggests that the early trends observed last year in the numbers of scientists NIH supported continued into FY 2018.
I would like to thank my colleagues in the Office of Extramural Research Division of Statistical Analysis and Reporting for their work on these analyses.


While the fraction of funded investigators is rising, this is only a measure of “Survivors”. I was unable to maintain sufficient funding to keep my lab operating about 8 years ago, and moved into teaching role. Glad to have it but not by choice. The rise does not accurately reflect a lessening of cruelty or a rise in confidence that one has a stable career.
Dear Mike,
In response to an earlier blog (“NIH Annual Snapshot – FY 2018 By the Numbers” from March 13) I raised the point that “RO1 equivalent” no longer capture the relevant statistics monitoring our scinetific apparatus as they lump together investigator-initiated applications with other funding mechanism. It is hard to interpret the trends you discuss here without this brake-down. In case you missed my earlier post, I re-posted it below.
Respectfully,
Rafi Kopan
Dear Mike,
Attracting a new generation to academic science is our collective challenge, and the allure of working on projects initiated by others is unlikely to do it. My concern is that the funding for investigator-initiated projects is declining, and as a result, so does the fraction of trainees remaining interested in a career as a PI. The decision to “include the DP1, DP2, DP5, R01, R37, R56, RF1, RL1, U01” in your statistical analysis is unfortunate as it obscures the fraction of funding dedicate to investigator-initiated grants vs. the fraction dedicated to mechanisms initiated by the various institutes (e.g., UO1). It will be important to add a table reflecting the $$ amounts directed into each category, or at least separate the investigator initiated (RO1, R35, etc’) from the rest, so that we can track funding for investigator initiated awards across the NIH.