
4 Comments
For the New Year, we resolve to make NIH data, reports, and analyses more accessible, interactive, and easy to use. For over a decade, the NIH Data Book has served as a helpful resource for describing funding trends on grants and contract awards, success rates, small business programs, peer review, as well as the scientific workforce. These data, presented as graphics and tables, have allowed you to get a better understanding of decisions made here at NIH. We are proud to announce a new edition is available for your 2019 reading list.
Not only are the data you are familiar with still available and updated with Fiscal Year 2018 details, but now you will experience interactive visualizations and more configuration options to make it easier for you to find the information you need. Let’s look at some data stories you can uncover.
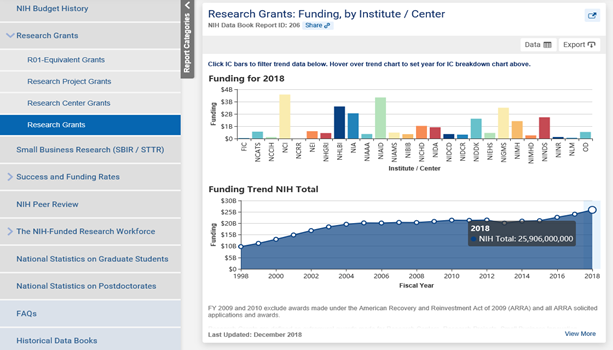
The dashboard displays multiple slides from a category at the same time for easy browsing, so all charts and tables are now one click away. For example, several charts are available on the Research Grants section at a glance. When hovering over individual data points on the “Research Grants: Funding, by Institute / Center” chart, we see that NIH awarded over $25 billion in Research Grants in FY 2018 (Figure 1). You can click on the individual IC bars at the top of the chart and see corresponding IC-specific trends appear on the bottom. Try it!
If you look immediately to the left, you will see a plot of the distribution of research grant funds across different mechanisms (Figure 2). Try hovering over the red line – you will see that in 1998 the percentage of research grant funds going to Research Project Grants (RPGs) was 78%. That value fell to 74% in 2009, but increased back up to 77% in 2018.
![New dashboard displaying a chart of the distribution of research grant funds over time across different mechanisms (Research Project Grants [RPGs], Research Centers, Other Research, Research Career, and SBIR/STTR).](https://nexus.od.nih.gov/all/wp-content/uploads/2019/01/image-4.png)
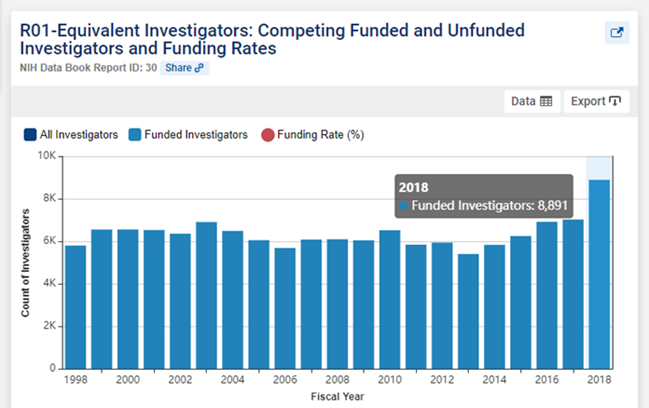
The dashboard clicks allow for seamless interaction with data visualizations and chart configuration. If you want to know more about the scientific workforce, as we definitely do at NIH, this chart view is helpful. It shows that there were 8,891 unique funded investigators receiving R01-equivalent grants in FY 2018 (Figure 3), a substantial increase over the previous year. Funded investigators, all investigators submitting applications, and funding rates may also be viewed on the same chart, where data can be singled out, and then easily exported as an Excel file or image.
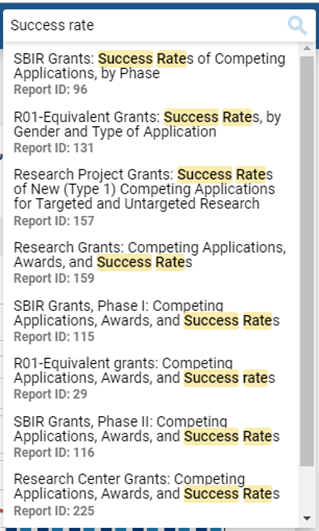
Overwhelmed by data and not sure where to start? Updated search capabilities streamline the search process to help you find what you are looking for. Perhaps you want to look up success rates of R01-equivalent grants, as in the example below. Improved search functionality previews the results with “success rate” highlighted, where you can quickly scan and find the charts on R01-equivalent grants in seconds (Figure 4). Feeling nostalgic? Prior versions are available as archives.
As always, every slide can easily be shared or viewed on its own page using links in the header, and the slides can be exported as images or with the underlying data for you to explore.
We invite you to curl up with the NIH Data Book and explore its new, modernized chapter. The update makes our data on the NIH biomedical research enterprise easier to browse, search, and share. Tell us your story – your experience with the new interface – in the comments below, so we can continue working to improve the NIH Data Book for your reading pleasure.
Many editions of the NIH data book have been digitized and put online for researchers and easier access for those who cannot travel to Bethesda. Check them out at https://archive.org/details/nihdatabookba19851986nati/page/n7. More of the data books are being added. If your office or lab may have any left around please check with James King at the NIH to see if any gaps are missing. Digitized materials make research online important for easier research!
For the new Data Book, when will 2018 data be added to the chart, “R01-Equivalent grants: Competing Applications, Awards, and Success rates”?
https://report.nih.gov/nihdatabook/category/10
The chart currently posted only has data up to 2017.
Thank you;
Jaime Rubin
The FY2018 data for ‘R01-Equivalent grants: Competing Applications, Awards, and Success rates’ have been posted at
https://report.nih.gov/nihdatabook/report/29.
I’m trying to find a funding by LR13478 does this exist?