14 Comments
Measuring the impact of NIH grants is an important input in our stewardship of research funding. One metric we can use to look at impact, discussed previously on this blog, is the relative citation ratio (or RCR). This measure – which NIH has made freely available through the iCite tool – aims to go further than just raw numbers of published research findings or citations, by quantifying the impact and influence of a research article both within the context of its research field and benchmarked against publications resulting from NIH R01 awards.
In light of our more recent posts on applications and resubmissions, we’d like to go a step further by looking at long-term bibliometric outcomes as a function of submission number. In other words, are there any observable trends in the impact of publications resulting from an NIH grant funded as an A0, versus those funded as an A1 or A2? And does that answer change when we take into account how much funding each grant received?
First, let’s briefly review long-term historical data on R01-equivalent applications and resubmissions.
Figure 1 shows the proportions of over 82,000 Type 1 R01-equivalent awards by resubmission status. We see dramatic shifts: 20 years ago, and during the doubling, the majority of awards came from A0 applications. By the time of the payline crash (~2006), most awards came from A1 and A2 applications. In 2016, several years after A2s were eliminated, half of awards came from A0 applications and half from A1 applications.
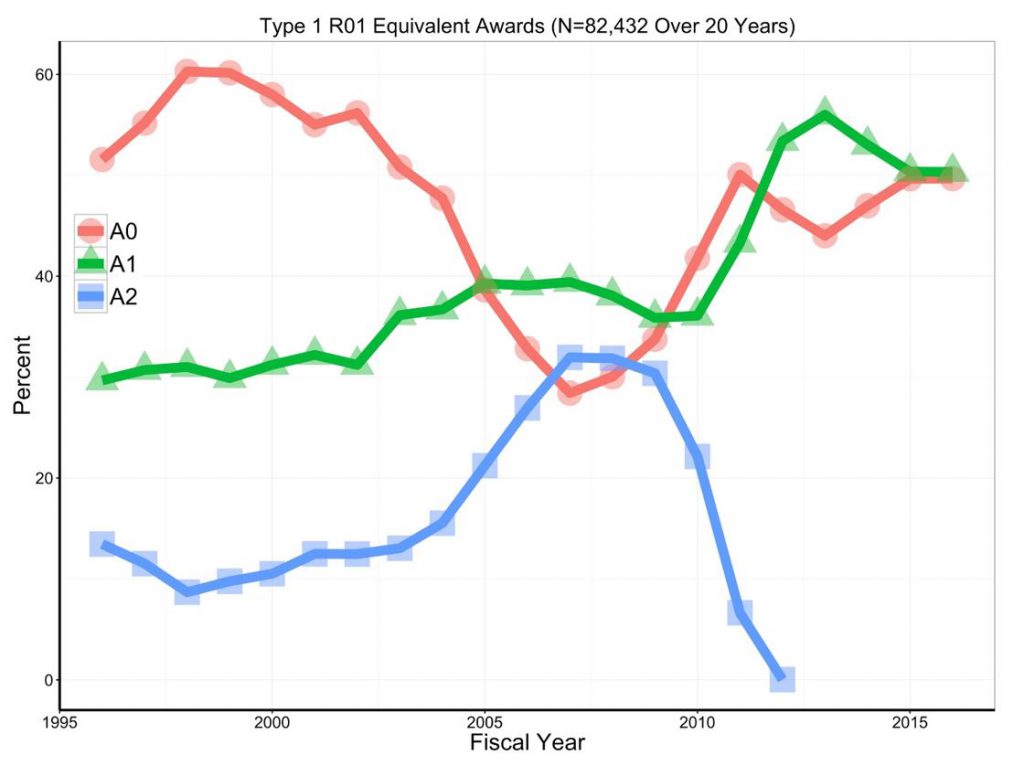
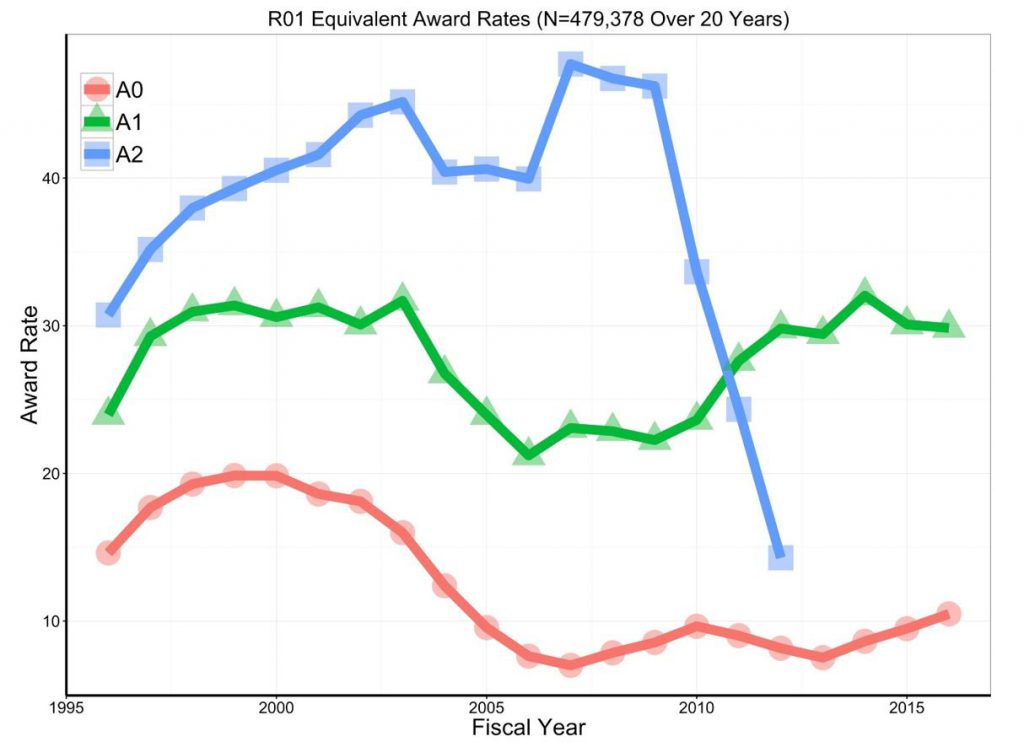
Figure 2 shows award rates. Over the years, resubmissions consistently do better; in 2016, A1 submissions were three times more likely to be funded than A0s.
Now we’ll “switch gears,” and look at long-term grant bibliometric productivity as associated with resubmission status. We’ll focus on 22,312 Type 1 R01-equivalent awards first issued between 1998-2003: this was a time when funds were flush (due to the NIH budget doubling) and substantial numbers of awards were given as A0s (N=11,466, or 51%), A1s (N=8,014, or 36%), and A2s (N=2,832, or 13%). By looking at grants that were first awarded over 14 years ago, we’ve allowed all projects plenty of time to generate papers that then had time to receive citations.
Table 1 shows grant characteristics according to resubmission status at the time of award. Characteristics were generally similar except that a smaller proportion of A0 awards involved human subjects.
| Table 1 | A0
(N=11,466) |
A1
(N=8,014) |
A2
(N=2,832) |
| Percentile | 15 (7-21) | 14 (8-21) | 14 (8-20) |
| Human study | 34% | 42% | 42% |
| Animal study | 50% | 50% | 51% |
| Total costs ($B-M) | 2.2 (1.4-3.7) | 2.0 (1.4-3.4) | 1.9 (1.4-3.1) |
| Duration (years) | 5 (4-10) | 5 (4-9) | 5 (4-6) |
Continuous variables are shown as median (25th-percentile – 75th percentile) while categorical variables are shown as percent.
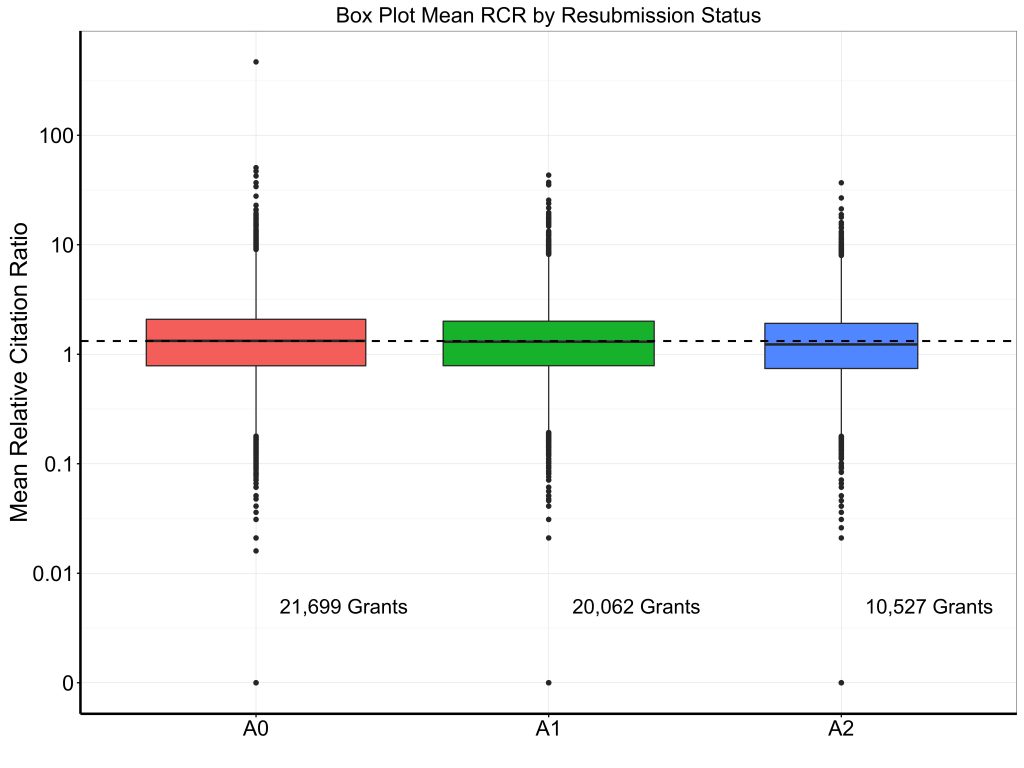
Table 2 shows selected bibliometric outcomes – total number of publications, number of publications adjusted for acknowledgement of multiple grants (as described before), weighted relative citation ratio (RCR), weighted relative citation ratio per million dollars of funding, and mean relative citation ratio. Figures 3, 4, and 5 show box plots for weighted RCR, weighted RCR per million dollars of funding, and mean RCR, with Y-axes log-transformed given highly skewed distributions. We see a modest gradient by which productivity is slightly higher for grants awarded at the A0 stage than for grants awarded on A1 or A2 resubmissions.
| Table 2 | A0
(N=11,466) |
A1
(N=8,014) |
A2
(N=2,832) |
| Papers | 10 (4-21) | 9 (4-19) | 9 (4-17) |
| Papers adjusted* | 5.1 (2.1-11.5) | 4.9 (2.0-10.5) | 4.8 (2.0-9.9) |
| Weighted RCR* | 6.3 (1.8-17.3) | 5.7 (1.7-15.2) | 5.2 (1.5-13.6) |
| Weighted RCR*/$Million | 2.93 (1.00-6.55) | 2.66 (0.92-6.09) | 2.60 (0.88-5.94) |
| Mean RCR | 1.29 (0.76-2.04) | 1.22 (0.74-1.91) | 1.16 (0.68-1.83) |
*Accounting for papers that acknowledge multiple grants
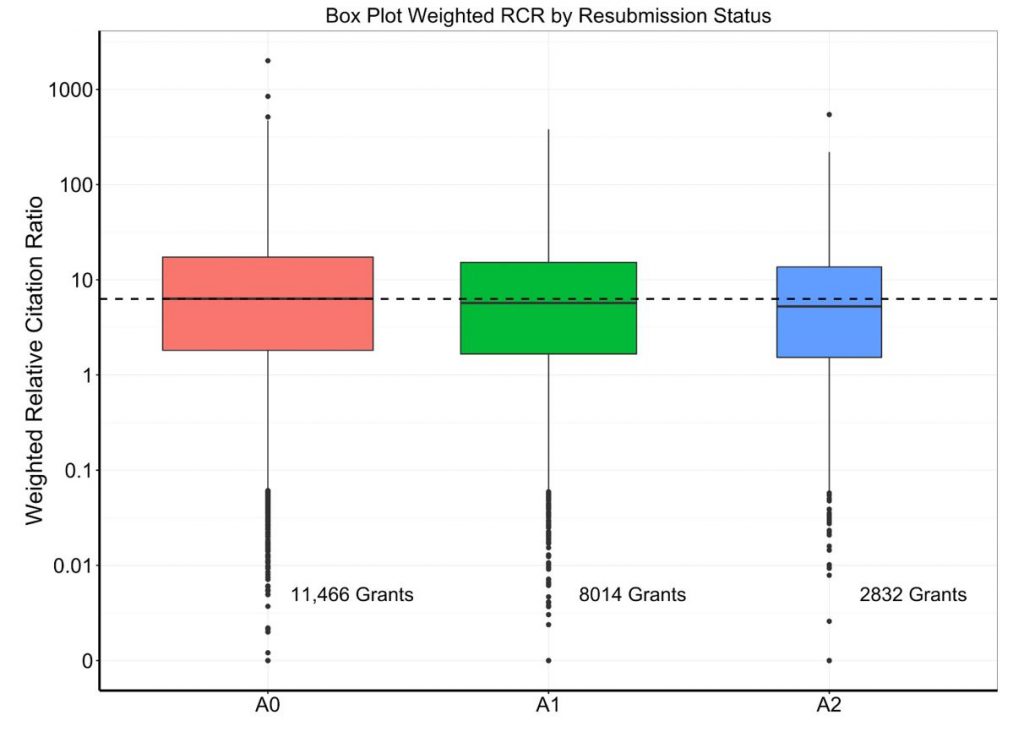
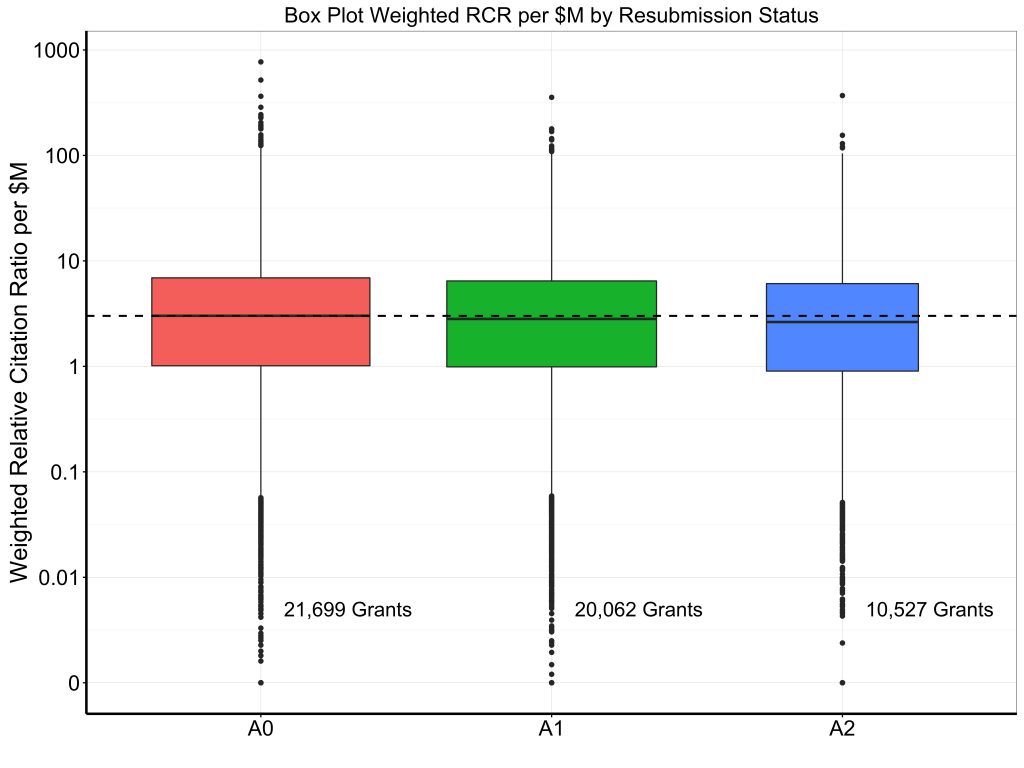
In summary, over the past 20 years we have seen marked oscillations in application and resubmission status, reflecting changes in policy (e.g. end of A3’s in 1997, end of A2’s in 2011, permission for “virtual A2s” in 2014) and changes in budget (e.g. doubling from 1998-2003, stagnation in the years following, increase in 2016). In 2016, about three-quarters of applications are A0 and one-quarter are A1s; half of awards stem from A0 applications, while half stem from A1 applications. We see no evidence of improvements in bibliometric productivity among grants that were awarded after resubmission; if anything, there’s a modest gradient of higher productivity for grants that were funded on the first try.


Very interesting analysis. How did the RCR trends change over time along with the rise in A1 funding? And how did things shake out per IC? Those are important questions.
How is the median duration of R01s 5 years when 5 years is the maximum? Does this include renewals?
Yes, 5 years is the maximum and it’s quite rare for anyone to ask for fewer than 5 years, so it’s not surprising that 5 years is the maximum and the median. Even when reviewers ding a grant for being too limited and “this work should not take more than three years”, the applicant usually responds with a revision that includes more work and/or an increase in scope, still for five years; not with the same application with a request for three years.
I find this information fascinating and timely. Is it possible to get this data broken out by awardee institution? I would love to see how our investigators are doing with their RCR versus the many last minute proposals that are “thrown together,” some of which are funded and some not. But what is the long term impact and what is our research enterprise working toward? Fast funding or lasting research impact.
There’s another consideration. I remember but cannot find now a paper looking at the pathology literature and the impact factor from papers that listed funding support and papers that listed no funding support. Guess which ones had a higher impact on the field? Yes it was the ones that had no funding at all. Perhaps these reflected research that arose from compelling curiosity rather than a need to keep publishing.
The critical metric is how much money an investigator has been awarded from all sources divided by the published output. Someone barely scraping by with minimal funding might actually prove to be more productive than would otherwise be appreciated. This could be especially true of that vanishing species of clinician investigators. The fact is that the number of people who actually see and treat patients with disease and do hypothesis directed bench research into disease has become vanishingly small. No one cares about this in the US because the majority of those who sit on study section are either PhDs or those with MDs who never go near a sick patient. MD/PhDs tend to honor one degree or the other, but not both. The PhD class look at the MD class as the beneficiaries of inflated salaries and practitioners of inferior science. While I cannot comment on the latter, the difference in pay scale has dramatically narrowed or disappeared in the last couple of decades depending on the clinical specialty involved.
This proposal mixes apples (administrative leadership) and oranges (project-oriented funding), to no one’s benefit. As someone who relatively recently assumed directorship of a CTSA-funded translational science institute (U54), I worry that the proposed methodology will discourage the top people from taking important administrative roles. Here is the thinking: the CTSA U grants are focused on improving research process, not doing the science. My role here is not to generate publications for MYSELF (=productivity), but rather to facilitating success for the institution, the network, and for others. That is great, as I can maintin productivity through my other grants. If I had to reduce my commitment to do science by taking on the administrative role, I likely would not have done it. Thus, the new policy may force leadership positions to go to folks with less successful scientific careers. I don’t think this is the way to increase the success of mid-level scientists.
Mike, I think this is a step backwards. The NIH mission statement describes the application of knowledge to enhance health. We should be explicit: papers are not impact. They are not innovation. And they do not enhance health. School teachers are the only ones who care about the number of essays you write and where you publish them. The rest of us care about tangible results. When I review grants, I remind fellow reviewers that we should never reduce the measure of clinical impact to bibliometrics; we have an obligation to perform the difficult work of analyzing the quality and capability of applicants. The revised NIH Biosketches are an encouraging step in that direction. I wrote one of the Transformative Research Awards funded in the first round of the award (then called Transformative-R01s). At the time, TRAs embraced creative approaches to break away from the types of fundable grants that we all loath: ‘incremental’ extensions that are already 85% complete. This was a step forward. Citation metrics are a step backwards, and I implore you to treat them with distrust. They fuel the bland, routine work of the professorate. That said, there are ways to creatively explore citations. A recent Nature commentary (Nature 544, 411–412 (27 April 2017) doi:10.1038/544411a) presented an approach to identify risk and novelty by determining “whether a paper cites new combinations of journals in its reference list, taking into account the likelihood of such combinations.” This may identify innovative essays. But they are still just essays–and it is dangerous to confuse them with impact.
I completely agree with what you say, about papers being just essays. I am always suspicious of ‘most cited” authors who have 50 or more papers in a year. How can one possibly read and edit properly even one paper a week? Obviously, these authors frequently have lots of co-authors, but this can also lead to problems. Further, the contents are likely to be restatements, or individual clinical studies. In the aggregate the work makes sense, but how does one decide where to find something quickly in such a disseminated body of work? Further, if you only cite one paper of yours in each of those 50 papers, you automatically have a lot of cites quickly.
However, the fact remains that certain “essays” have more of an effect than others, in any field. The most cited papers (excepting those that are written in some area that has caught the public attention and are cited hundreds of time within a couple of years, then fade) are ones that describe methods that transform an area over a long period of time. These may have unassuming (read “non-sexy”) titles: e.g.
Nature. 1970 Aug 15;227(5259):680-5.
Laemmli UK. Cleavage of structural proteins during the assembly of the head of bacteriophage T4.
cited thousands of times for the PAGE methods described
or
Marion Bradford on measuring protein concentration with coomassie blue or
Calculation of protein conformations by proton-proton distance constraints: A new efficient algorithm W Braun, N Gō Journal of molecular biology 186 (3), 611-626
and so on.
so cites do matter! I think it is unpredictable where such “classics” will arise, but they usually mark breakthroughs in methodology or thinking.
It may be obvious that first try (A0) funded grants may be a bit better on average than those needing to wait til second try, and may score better from that bias.
My other comment is that individual judgement about quality of work is great, but without actual measures of some type we’d have no data to analyze. My usual impulse is to have as many quantitative quality measures as possible. I’ve never seen a quality control panel that was too long.
Perhaps the entire approach should be inverted, at least in terms of learning how to optimally allocate funding? If we identified top breakthroughs in fields, perhaps we can work backgrounds to see how these advances were achieved? This could include the papers and the grants that contributed most to the advances. This approach might prove to be a narrative, rather than a readily defined metric; nonetheless, it might give us clues about what really matters. If nothing else, it could complement the “hard data”.
How did the RCR trends change over time along with the rise in A1 funding?
Perhaps the entire approach should be inverted, at least in terms of learning how to optimally allocate funding? If we identified top breakthroughs in fields, perhaps we can work backgrounds to see how these advances were achieved? This could include the papers and the grants that contributed most to the advances. This approach might prove to be a narrative, rather than a readily defined metric; nonetheless, it might give us clues about what really matters. If nothing else, it could complement the “hard data”.
whether a paper cites new combinations of journals in its reference list, taking into account the likelihood of such combinations.” This may identify innovative essays. But they are still just essays–and it is dangerous to confuse them with impact.