
2 Comments
“My first submission got an overall impact score of 30. Is that good enough? What’s the likelihood I’ll eventually get this funded?”, or, “My first submission was not even discussed. Now what? Does anyone with an undiscussed grant bother to resubmit? And what’s the likelihood I’ll eventually get this funded?”
In a past blog we provided some general advice and data to help you consider these types of questions, and obviously the answers depend on specifics — but even so, based on your feedback and comments we thought it would be informative to offer high-level descriptive data on resubmission and award rates according to the first-time score, that is, the overall impact score on the A0 submission.
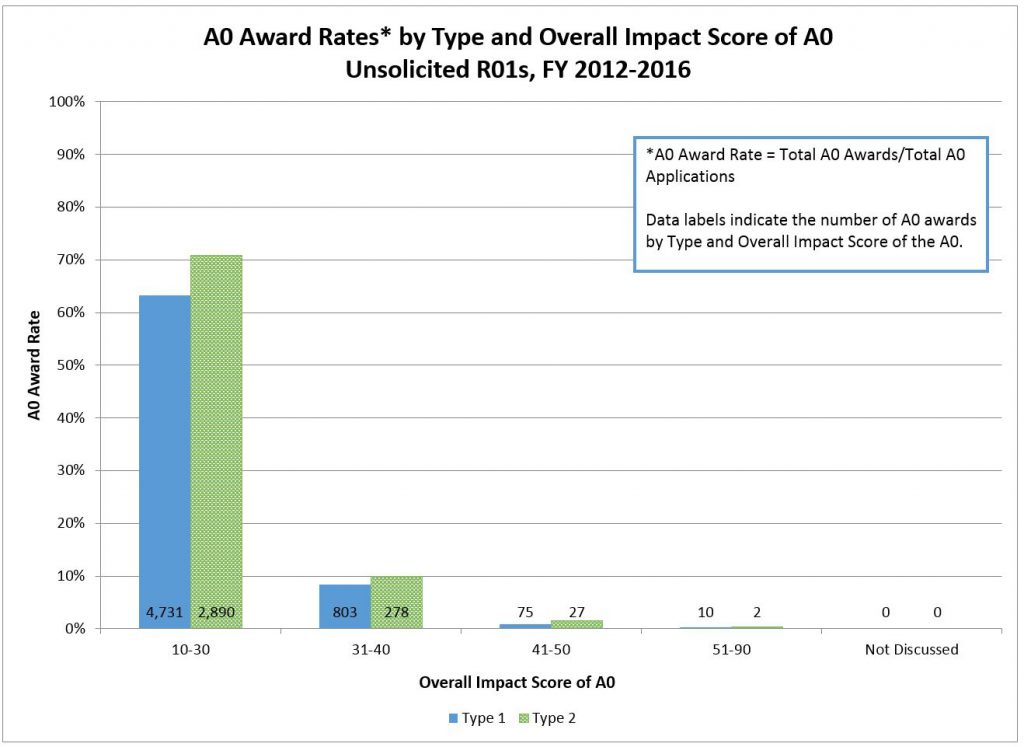
Here we describe the outcomes of 83,722 unsolicited A0 R01 applications submitted in fiscal years 2012 through 2016. Of these, 69,714 (or 83%) were “Type 1” (de novo) applications, while 14,008 (or 17%) were “Type 2” (or competing renewal) applications.
Let’s begin with looking at award rates: as a reminder, award rates are the total number of awards divided by the total number of applications. Figure 1 shows the award rate of these A0 applications broken out by type 1 (de novo) vs type 2 (competing renewals). (If you’re interested in looking at new and competing renewals in aggregate, for this and the following figures, these are shown in the Excel file we’ve posted to the RePORT website.)
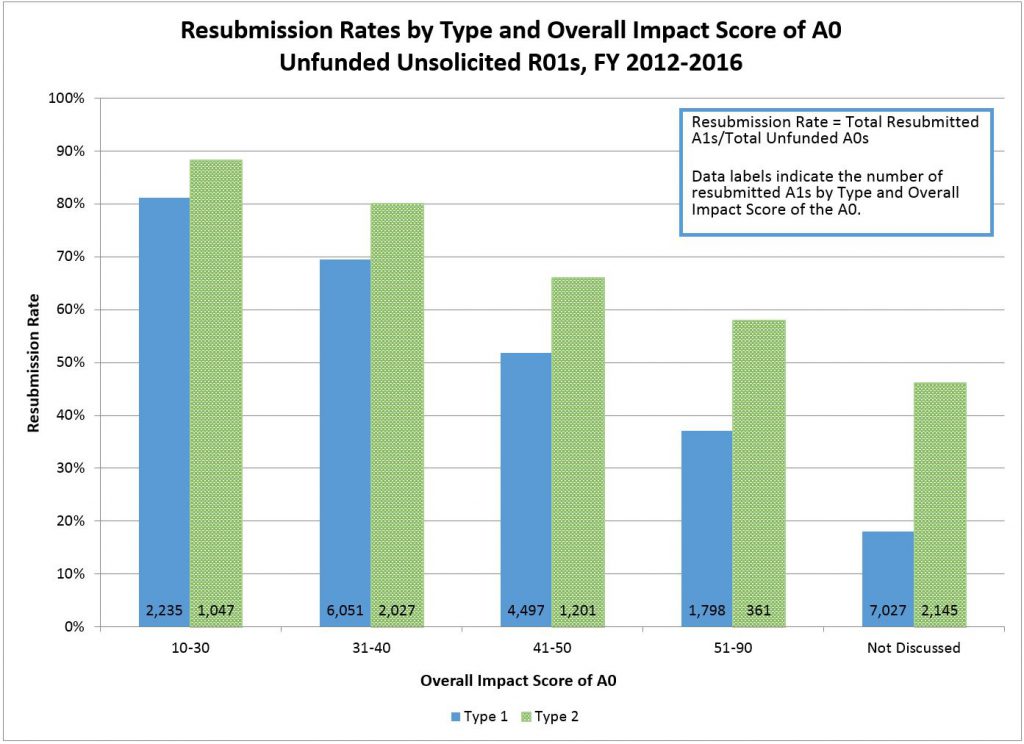
Now, let’s look at the resubmission rates for the unfunded A0 applications, binned by overall impact score and broken out by de novo or competing renewal (type 1 versus type 2). As might be expected, we see a strong gradient: applicants were much more likely to resubmit the better their overall impact score. Resubmission rates declined from 80-90% for applications with overall impact scores of 10-30 to just under 20% for Type 1 applications which were not discussed, and just under 50% for Type 2 application which were not discussed For any given A0 overall impact score, we were more likely to see resubmissions with Type 2 applications, the difference between Type 1 and Type 2 resubmission rates being most striking for non-discussed A0s.
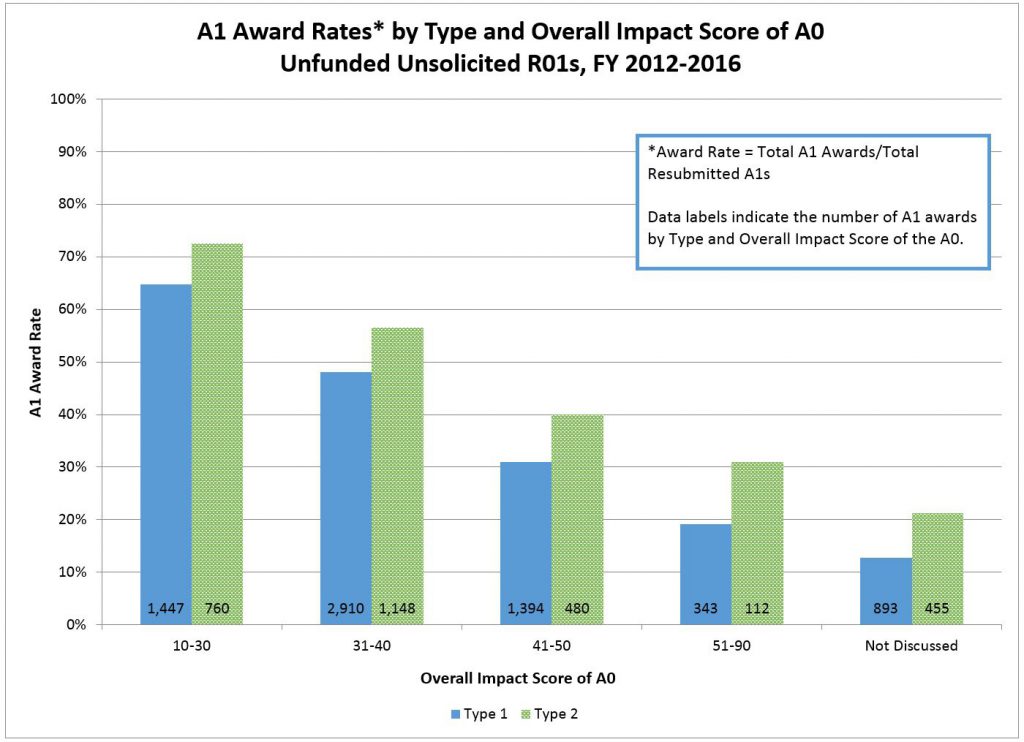
Now let’s look at the outcomes of the unfunded applications on their first resubmission (A1). Figure 3 shows the award rates for A1s according to the A0 overall impact score. Not surprisingly we see a similar gradient – the better the A0 overall impact score, the more likely the revision was awarded. For A0 applications that were not discussed, the A1 award rate was between 12% and 22% — quite low, but not zero. For any given A0 overall impact score, A1 award rates are higher for Type 2 applications.
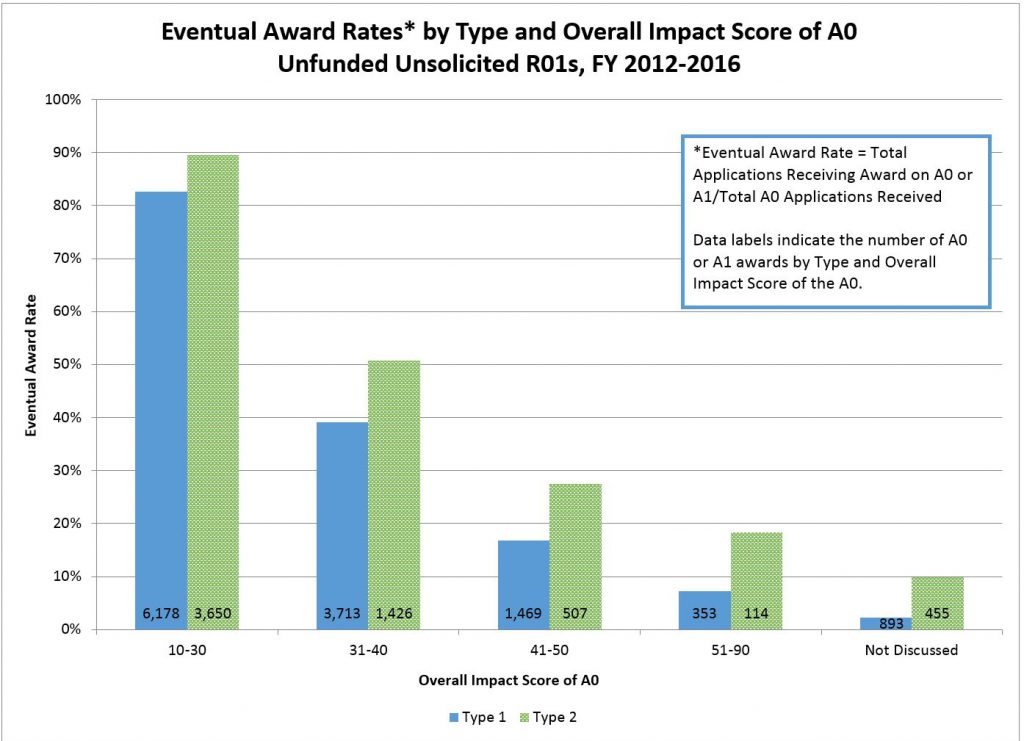
Finally in Figure 4 we move to eventual award rates – taking into account awards at the A0 or A1 stage. Applications with an A0 overall impact score of 10-30 have an 80-90% chance of eventually being funded. In contrast, applications not discussed at the A0 stage have less than a 10% chance of being funded.
We present these outcomes to show a high-level picture of applicant behavior and award outcomes. Nonetheless, as we have discussed before, we urge you to take advantage of extensive available information on our web pages and to feel free to contact your program officials for individual-level advice.
I am most grateful to my colleagues in the OER Statistical Analysis and Reporting Branch for helping put these data together.
Is the underlying table #8-17 drawn from a publication or a series of tables that one might access more completely? A specific question: is there a stat breakdown of award rates by dynamics of IS between A0 and A1? PI’s are often surprised and disappointed (some even rant and rave) when after responding to comments in the A1, their IS declines from the A0. What is the distribution of categorical A0 scores (10-30, 31-40 etc.) by A1 scores (or byA0-to-A1 differences, in intervals like …-5 to -1, 0, +1 to +5…) and what is the success rate for each of those cells?
Also, can you explain why the IS a better measure in these analyses than the percentile?
Finally: thank you for all your posts!
The data is not completely capture submission behavior. NIH changed its submission policy in 2014. The updated policy allows an investigator to submit a new (A0) application following an unsuccessful A0 submission. It may be that some percent of the individuals that had higher inpact scores did resubmit their applications, but as a A0 submissions.