
4 Comments
We were pleased to see the interest in our recent blog on the unique number of investigators applying for and receiving NIH research project grants (RPGs). Some of you (through the blog page or through other media) have asked about whether we have similar data for our Small Business Innovation Research (SBIR) and Small Business Technology Transfer (STTR) program. We have generated analogous figures for SBIR and STTR grants, and today’s post shares this investigation of the question, “How many unique researchers are seeking SBIR/STTR funding?”
As described in my prior post, we use a multi-year window to determine this “cumulative investigator rate” since most Phase II projects span more than one year and most applicants submit applications over a period of time that may overlap with their periods of funding, if they are funded. Given the short-term cyclical nature of these awards, (for example, Phase II awards generally do not exceed two years), we used a 2-year window instead of using a 5-year window as in our previous analysis.
Figure 1 shows data for unique awardees and applicants for all SBIR and STTR research project grants over the fiscal years (FY) 2001-2015:
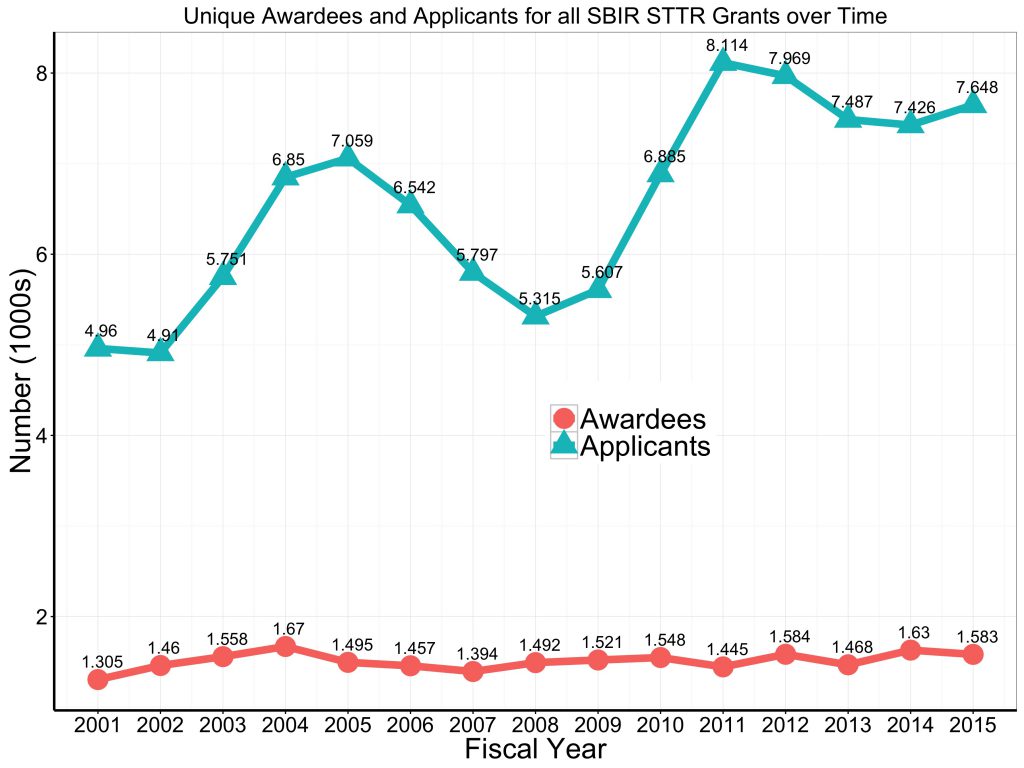
Over time, we have seen increases in the numbers of unique applicants and awardees. We also note oscillations that parallel the business cycle. When credit became tight with the 2008 financial crisis, we saw an accompanying increase in the number of unique applicants. The number peaked in 2011 and has since declined.
In Figure 2 we add the cumulative investigator rate (which takes into account a 2-year application window):
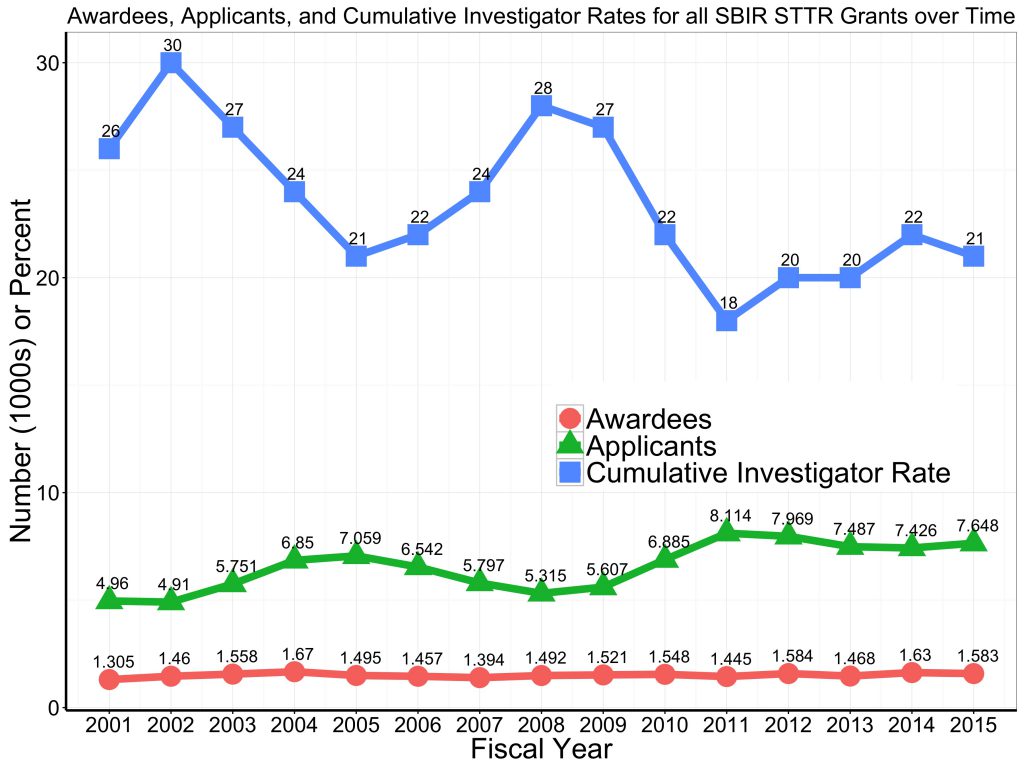
Cumulative investigator rates have also oscillated, but we see an overall decline over time.
Figure 3 shows analogous findings for the most common type of SBIR award, the Phase I R43 grant:
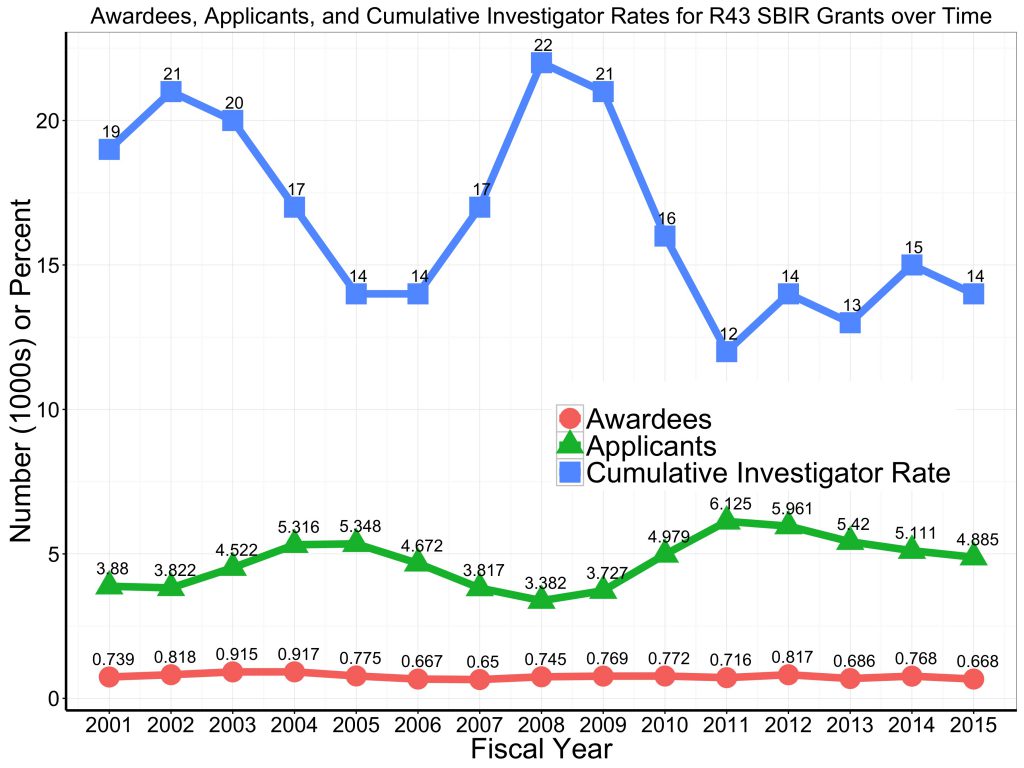
Figure 4 shows the number of unique applicants and awardees for R41 Phase I STTR awards:
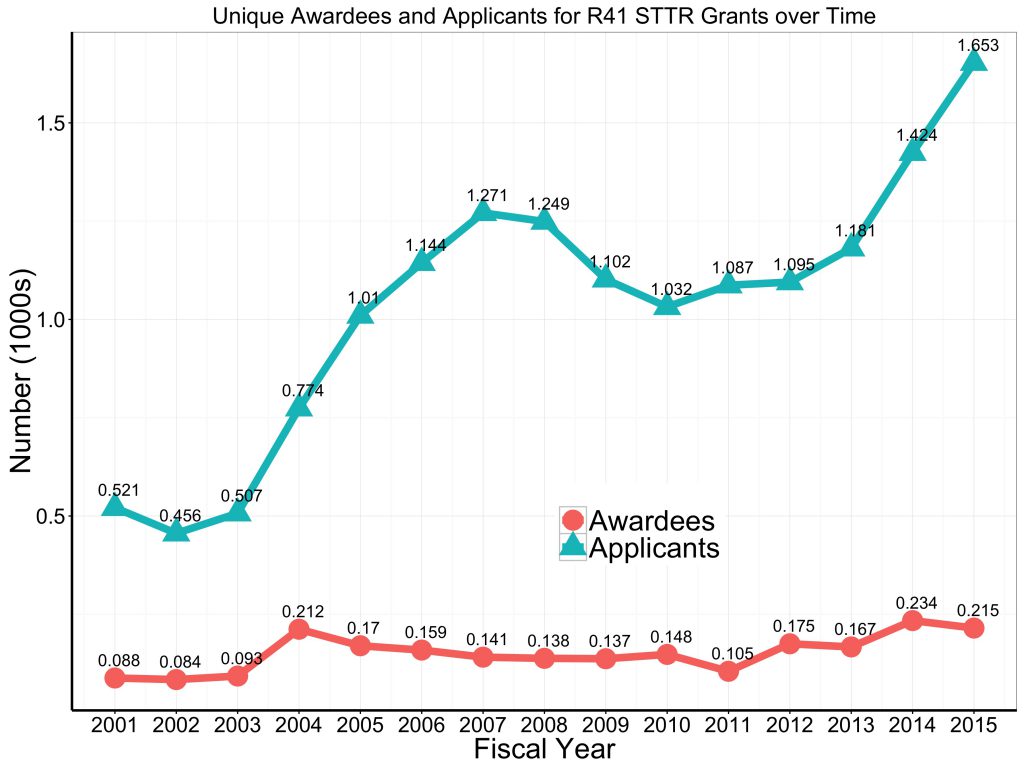
While we still see oscillations, we also see long-term increasing numbers of applicants and awardees.
Finally Figure 5 adds in the cumulative funding rates for R41 Phase I STTR awards:
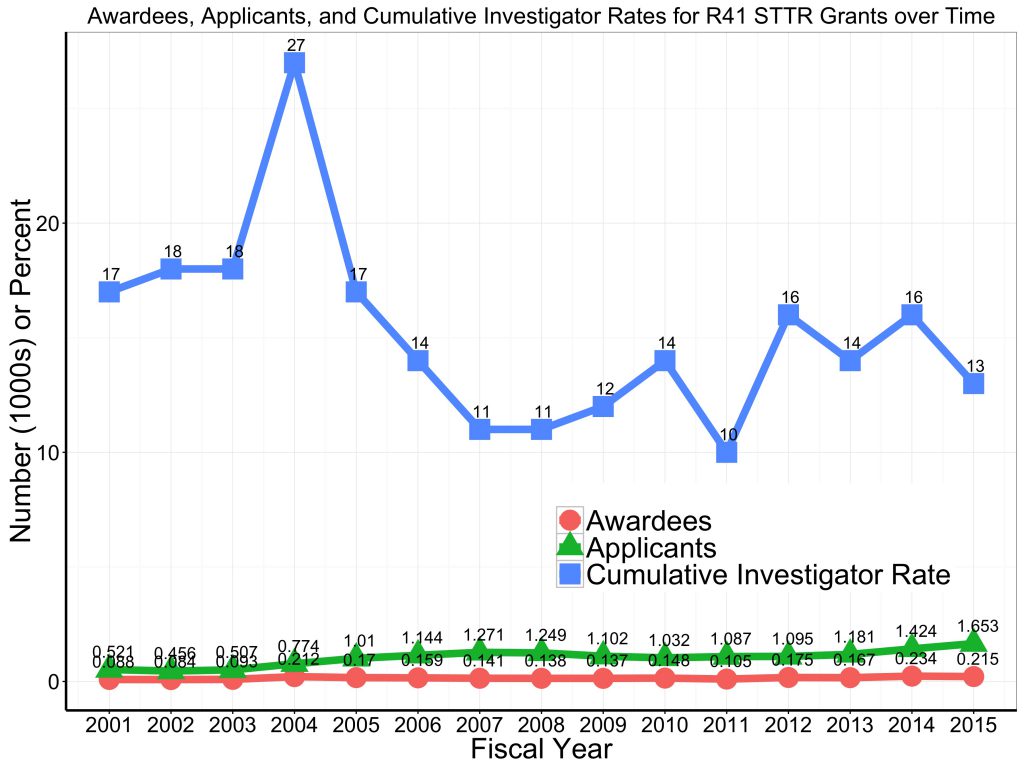
In summary, we see that for SBIR-STTR awards there have been long-term declines in cumulative investigator rates, though the numbers of unique applicants have oscillated in concert with the business cycle (especially for Phase I SBIR R43 awards). The absolute cumulative investigator rates may appear to be lower than what we saw for Research Program Grants, but the values are not directly comparable since they reflect different time windows (5 years for RPG awards, 2 years for SBIR/STTR awards).
I would like to thank the OER Statistical Analysis and Reporting Branch for their work with me on this analysis.
What do SBIR success rates look like across PI characteristics of sex and ethnicity?
Please explain more clearly what Cumulative Investigator Rate refers to–I’m not clear how a 2-year window factors in.
You might find this previous blog that looks at a cumulative investigator rate helpful. There, to determine how many unique researchers want to be funded via R01s, we identified unique applicants within a five-year window: 1) since most research grants last for more than one year and, 2) most applicants submit applications over a period of time measured in years, not just 12 months, that may overlap with their periods of funding, if they are funded. In this post, the window was adjusted to two years to account for the shorter length of SBIR/STTR grants.
This analysis also differs from our published success rate data on SBIR/STTR applications (see the NIH RePORT and SBIR/STTR sites) since award rates & success rates take into account numbers of applications/projects that get funded, whereas funding rate is a person-based calculation, looking at how many primary investigators have NIH funding.
Thanks for posting this.
Are these rates available broken down by Phase I vs. Fast Track?