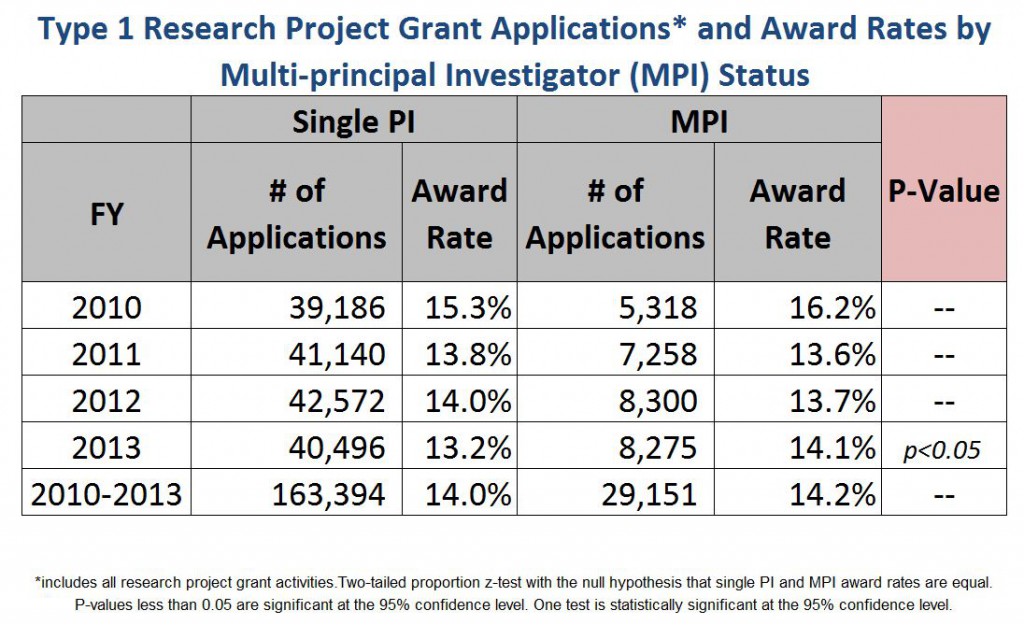
Table #333-14-1
Tests for Differences in Award Rate,
by Multi-Principal Investigator (MPI) Status
Type 1 Research Project Grant (RPG) Applications
Fiscal Years 2010 – 2013
—–
http://nexus.od.nih.gov/all/2014/07/11/how-do-multi-pi-applications-fare
—-
| FY | Single PI # of Applications | Single PI Award Rate | MPI # of Applications | MPI Award Rate | P-Value |
|---|---|---|---|---|---|
| 2010 | 39,186 | 15.30% | 5,318 | 16.20% | — |
| 2011 | 41,140 | 13.80% | 7,258 | 13.60% | — |
| 2012 | 42,572 | 14.00% | 8,300 | 13.70% | — |
| 2013 | 40,496 | 13.20% | 8,275 | 14.10% | p<0.05 |
| 2010-2013 | 163,394 | 14.00% | 29,151 | 14.20% | — |


