
12 Comments
Last April we posted a blog on the measurement of citation metrics as a function of grant funding. We focused on a group of R01 grants and described the association of a “citation percentile” measure with funding. We noted evidence of “diminishing returns” – that is increased levels of funding were associated with decreasing increments of productivity – an observation that has been noted by others as well.
We were gratified by the many comments we received, through the blog and elsewhere. Furthermore, as I noted in a blog last month, our Office of Portfolio Analysis has released data on the “Relative Citation Ratio,” (or RCR) a robust field-normalized measure of citation influence of a single grant (and as I mentioned, a measure that is available to you for free).
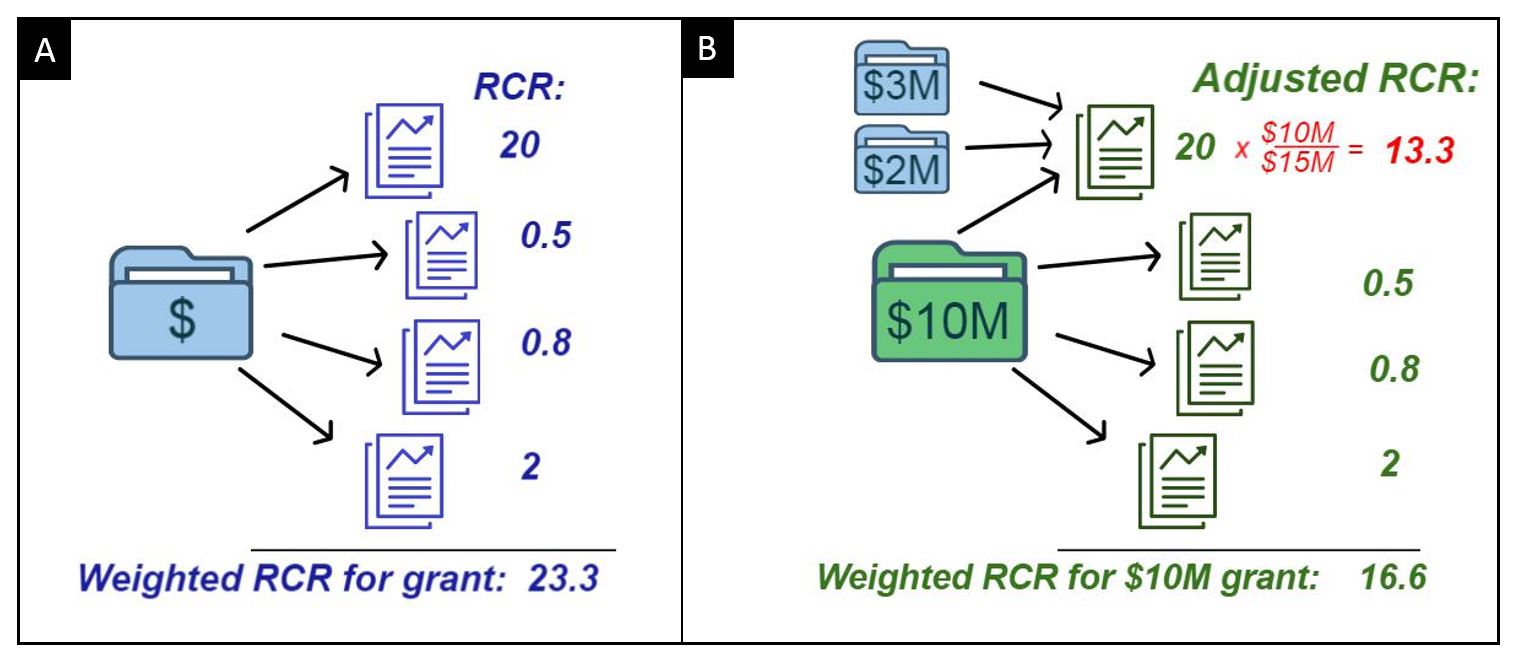
In the follow-up analysis I’d like to share with you today, we focus on a cohort of 60,447 P01 and R01-equivalent grants (R01, R29, and R37) which were first funded between 1995 and 2009. Through the end of 2014, these grants yielded at least 654,607 papers. We calculated a “weighted RCR” value for each grant, essentially the sum of the RCR values for each paper. Hence, if a grant yielded 4 papers with RCR values of 20, 0.5, 0.8, and 2.0, the weighted RCR for the grant would be 20+0.5+0.8+20= 23.3 (see Figure 1, panel A for an illustration).
However, there is an important twist, which a number of you noted, and which we had to some degree correct for in our previous publications. What if a paper acknowledges support from more than one grant? It would not be appropriate to count the paper multiple times without somehow accounting for the multiple-grant acknowledgement. Table 1 and Figure 1, panel B shows the approach we took: we calculated a weight for each grant according to the proportion of money that grant accounted for. Thus (as shown in Table 1 and the first paper in Fig. 1, panel B) if a paper cited 3 grants, and one grant accounted for 2/3 of the total dollars of the 3 grants, the first grant received 2/3 of the credit. If that paper had an RCR of 20, the first grant would be credited with weighted RCR from that paper of 20 * 2/3, or 13.3. The remaining “0.666” of RCR would be distributed to the other two grants according to their respective budgets.

Before delving into the data, we should note two other important methodological points. All budgets were inflation-adjusted for the Biomedical Research and Development Price Index (or BRDPI) with 2015 as the reference year, and the project duration included all years the grant was active, including no-cost extension years.
Now, let’s look at the data. Table 2 shows selected characteristics for P01 or R01 (or equivalent) awards. As would be expected, P01 budgets were much higher. P01 grants also had longer grant durations and were more likely to include human or animal subjects. They yielded more publications (median 30 vs. 6) but the number of publications per $ million was a bit lower (median values of 2.9 vs. 3.2).
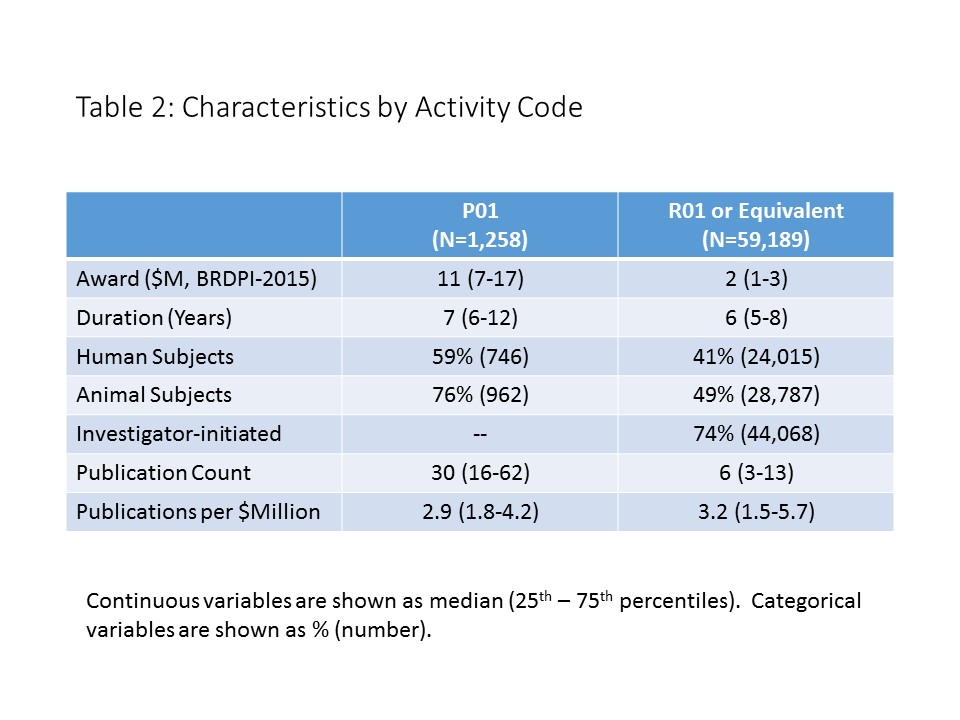
Figure 2 shows box and violin plots of the weighted RCR for P01s and R01-equivalents. Note that the Y-axis is logarithmically transformed given the highly skewed distribution. The P01 grants had higher weighted RCR values; also the R01 grants had a substantially larger of RCR values of zero, meaning no publications yielding any substantive number of citations.
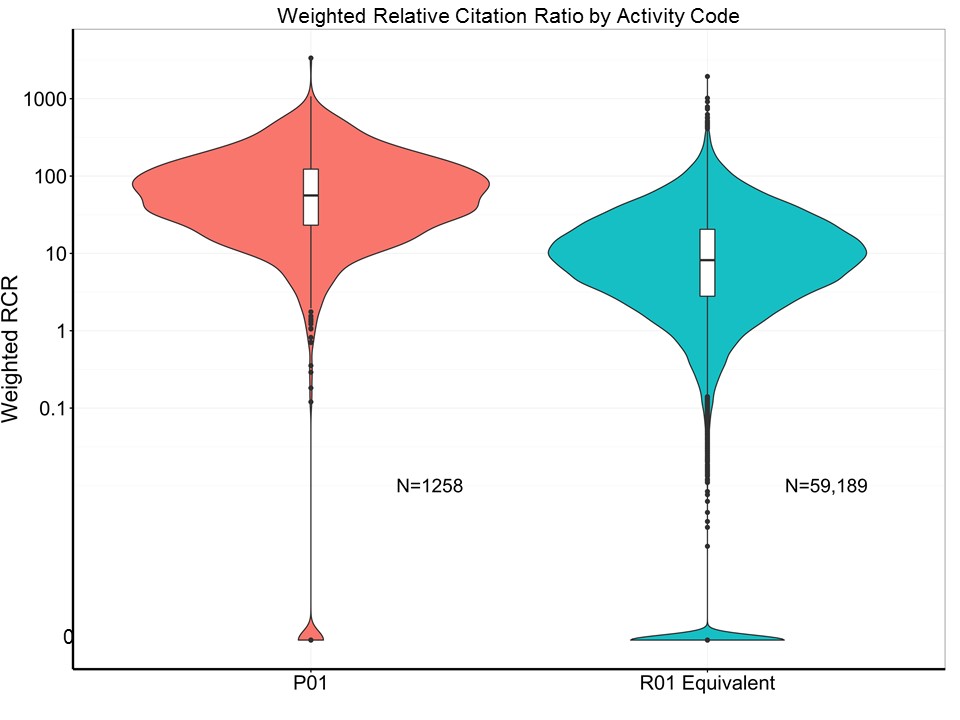
Figure 3 shows weighted RCR per $ million for P01s and R01-equivalents. Now the differences are much less. For convenience, the dashed lines correspond to the median, 25th, and 75th percentile values for P01 grants.

Figure 4 shows the mean RCR per grant (that is mean RCR for all papers associated with each grant) for P01s and R01-equivalents. The mean RCR values are somewhat higher for the P01 grants.
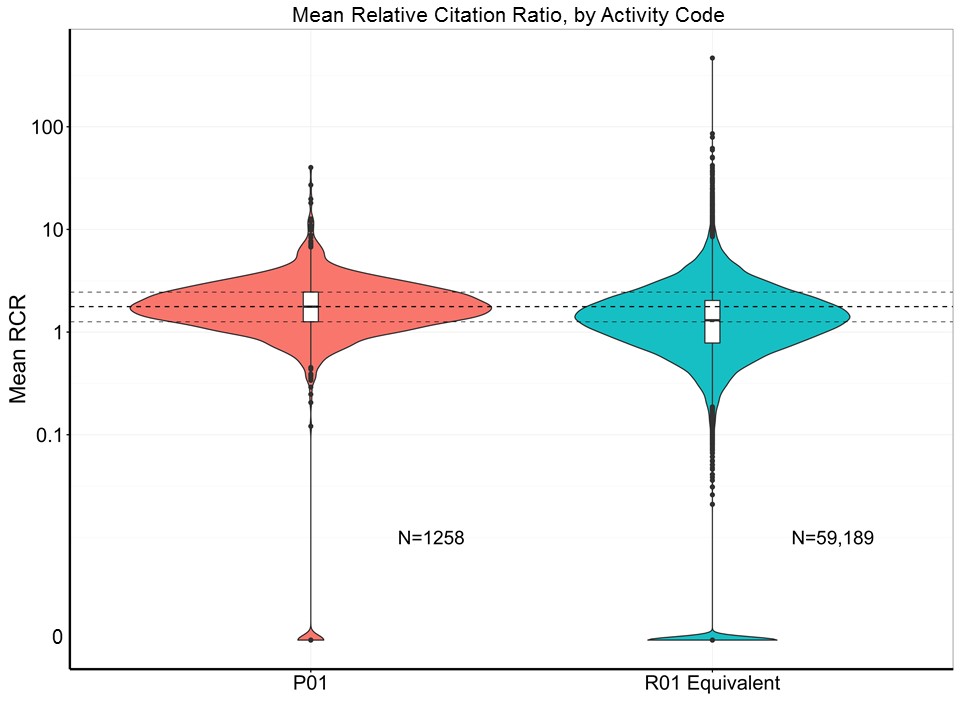
Figure 5 shows scatter plots with cubic spline smoothers for weighted RCR according to total award, activity code, and project duration. Both axes are logarithmically transformed as both budgets and output were highly skewed. The dotted lines correspond to the slope of short-duration lower-budget R01 grants. As expected, weighted RCR values are higher for longer-duration grants. Weighted RCR also increases with budget, but with diminishing returns. P01 grants have higher RCR, particularly with higher budgets; however, these differences should be interpreted with caution given that P01 grants are multi-component projects.
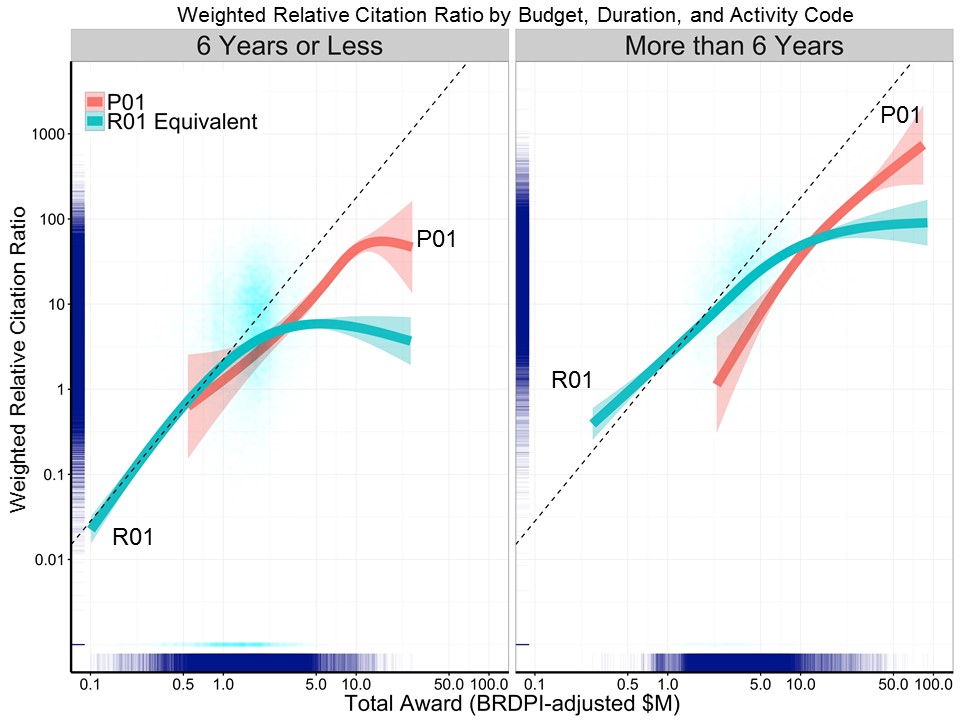
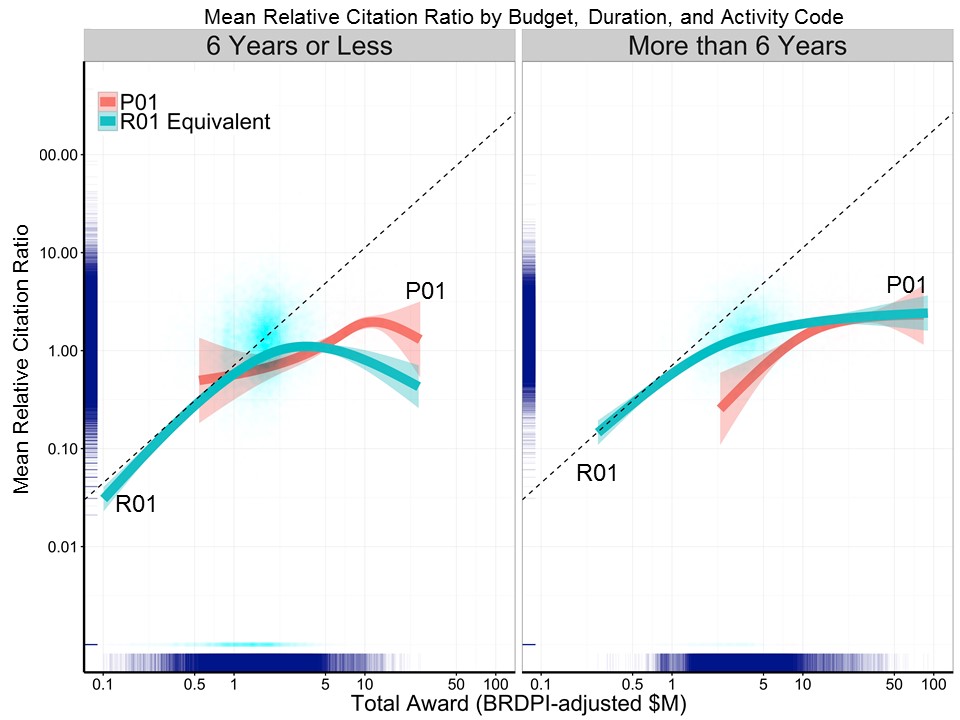
Figure 6 shows corresponding scatter plots for mean RCR according to total award, activity code, and project duration. Now the differences between P01 and R01 grants are less pronounced, but the evidence diminishing returns are evident.
Because there are a number of variables that might be associated with grant productivity, we next performed a multi-variable regression (using a random forest machine learning algorithm). Figure 7 shows the main results – the most important predictors of weighted RCR for each grant were total award and project duration. Whether the grant is an R01 equivalent or P01, and other candidate predictors were less important.
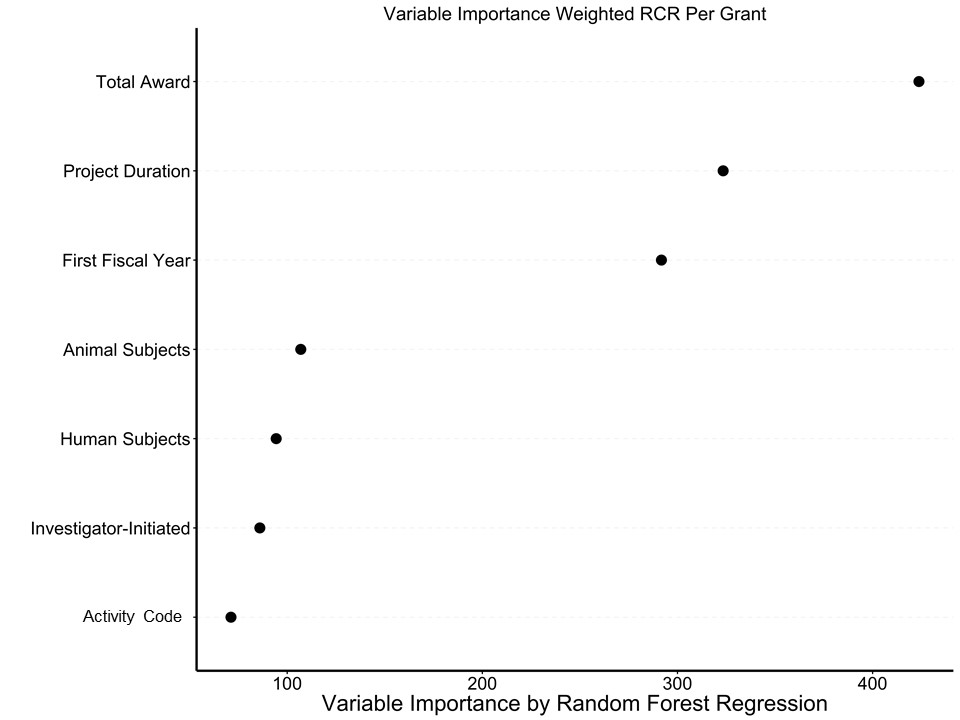
Figure 8 shows an important output of the multi-variable regression – the adjusted association of weighted RCR with award. The two vertical lines show the 5th and 95th percentiles. The dotted line labeled “Proportionate Returns” corresponds to a state in which a 10% increase in award would be associated with a 10% increase in productivity. The lesser slope of the curve implies diminishing returns – that is, after accounting for other variables, a 10% increase in budget would be expected to yield less than a 10% in productivity.
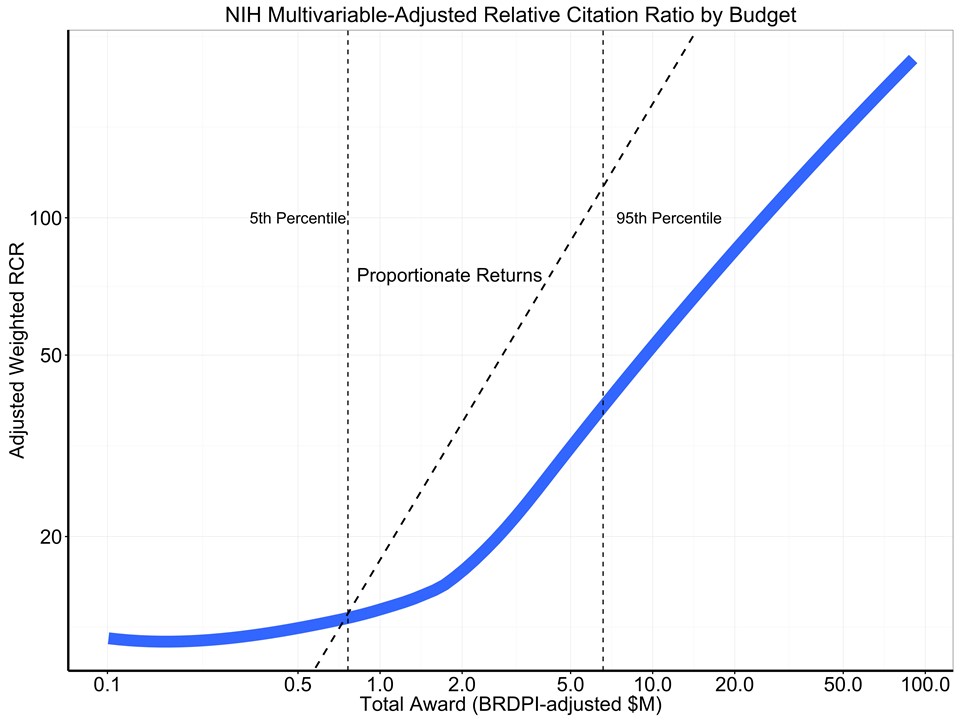
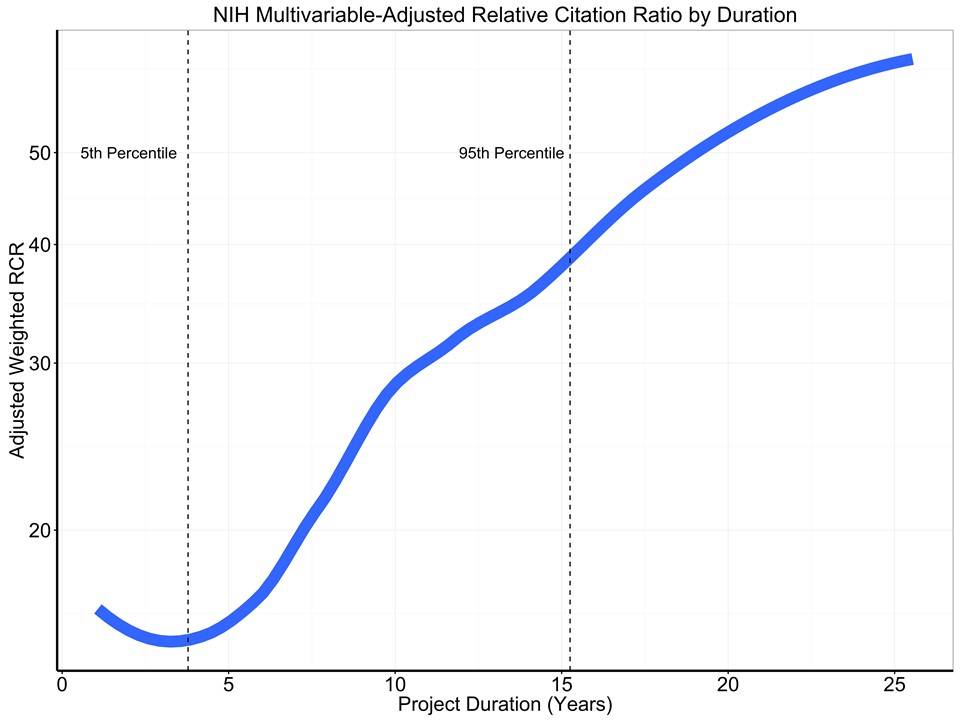
Figure 9 shows the multi-variable adjusted association of weighted RCR with project duration. Not surprisingly, longer duration remained associated with higher productivity.
In summary, we find that in a larger cohort of grants and using the robust method of Relative Citation Ratio, we again see evidence of diminishing returns. Higher budgets and longer duration of funding are associated with greater productivity, but not to a proportionate degree.
What are the policy implications of these findings? First, we must emphasize that citation impact is not the ultimate goal of funded research – it is only one of a number of valid measures of research impact. Nonetheless, our findings are consonant with the statement by Alberts, et al. who, while warning about the dangers of the current hypercompetitive environment, wrote, “Agencies should also be sensitive to the total numbers of dollars granted to individual laboratories, recognizing that—although different research activities have different costs—at some point, returns per dollar diminish. For that reason, we applaud the recent decision by the NIH to examine grant portfolios carefully before increasing direct research support for a laboratory beyond one million dollars per year.”
We greatly appreciate your feedback, and look forward to more. In future analyses, we hope to consider a variety of metrics to enable us to better understand the biomedical research ecosystem and the possible associations of our policies on its productivity – ultimately its strength to lead to greater knowledge and better public health.
Very interesting. When selecting R01 equivalent awards did you take into account the possibility that some R01s are renewals using the same base grant number and thus while the specific award might only be around 4-6 years the papers generated could be based on multiple competing renewals.
I know my IC is interested in a similar question between other award mechanisms where time and dollar amount are quite different. I would enjoy a class, workbook, or 1 on 1 that could teach others the specific steps used to do this analysis type of analysis.
Any differences apparent by Institute?
I think direct comparison between P01 and R01 grants is tricky as many P01 provide infrastructure funding that is used in many research settings and inappropriately skews the data towards benefiting these grants because of the multi-grant algorithm you are using. For example, a P01 grant that supports the administration of a Center (Cancer, Immunology, Genomics, etc) will be referenced on all the publications from that center. In reality, very little of the P01 funding would have gone towards a specific manuscript (most of the funding will have come from the investigator’s independent R01), but the P01 will get the majority of the credit due to it’s larger budget. Thus, I question whether the P01 grants results are inflated due to this issue. Perhaps it may be beneficial when comparing the P01 and R01 to also examine the ratio of P01 publications that also cite an R01 to identify and exclude these Center grants that may bias the data.
This is very interesting. However, I am not sure if your approach to assign credit to all grants linked to a publication proportionally takes into account the fact that contribution of co-authors of a paper is not proportional. First and last authors usually make the biggest contribution while those in the middle the smallest. It would be unfair to assign bigest credit to an investigator in the middle who has the largest grant.
I think these type of questions are great and worth evaluating. However, the old adage garbage-in-garbage-out must be remembered. As a long standing member of NIH grant review panels, it is fairly common to see publications credited to grants but that really have nothing to do with the actual grant aims. Also reviews can get credited to grants. So an important aspect of this type of analysis would be to validate that the manuscripts credited to the grant really are a direct outcome of that grant. This would, of course, be a laborious effort; however, evaluation of a subset just to see how prevalent this issue is would help provide a window into this.
I have a comment similar to Kirsten’s about the rule that “if a paper cited 3 grants, and one grant accounted for 2/3 of the total dollars of the 3 grants, the first grant received 2/3 of the credit.” WHOA. I’m thinking of recent papers from my lab that cite an R01 or R21 grant that provided most of the money for that project, but also cite a CTSA grant that provided some of the infrastructure. Obviously the CTSA grant will hugely outnumber the dollars of the individual R grant, but most of the publication credit should go to the R grant. I understand that in this analysis you did not include CTSA and similar grants, but this concern should be reflected somewhere in any publication or software sharing, so that others account for it.
Hi,
Great to see the data.
Do you give weight to the journal where the work was published or how well the work is cited ? Does one Lancet and New England J Med article count the same as minor publications? What about the press picking up on the reseach?
Best regards
Paper counting is a good start. However, I think the CSR could be doing more to eliminate new applicants from participation and faith in the federal funding stream.
This seems like a dangerous way to carry out an analysis. Instead of looking at all possible origins of variation, a ‘favorite’ model is raised. This focuses discussion on that factor (diminishing productivity with increased funding per lab) rather than inviting consideration of all possible models and factors. Just for example, what if there are fewer papers in longer-standing grants as the problems get deeper and more complex, and so maybe there’s more progress and fewer papers. That’s just one idea, and I have no reason to favor or disfavor it, but I do worry about an over-reliance on statistical outcomes from funding (which are blind to many factors and nuances) and followed incomplete consideration of those factors and possible models. I tend to believe that too much funding per lab is bad for productivity and training, in general, but a belief is different than evidence.
Is there any effect of the number of grants per PI? My impression is that the second or third R01 (or equivalent) held by a PI has far less impact in terms of cited papers than does the first R01. Richer labs produce far fewer papers per dollar of funding. This effect is obscured in your analysis.
Diminishing Marginal Returns on Investments in Biomedical Research
A senior NIH official, Jon Lorsch, provided a striking answer to this question (Mol Biol Cell. 2015; 26:1578-1582). According to his calculations, funding allocated for a first R01 grant to an investigator ($200,000 annual direct costs) would produce, on average, about five publications during the funding period. Remarkably, the same amount of funding for a third R01 grant would yield only about one additional publication.
Lorsch’s values for return on investments, like those from Mike Lauer (this blog) and the published literature, provide a compelling call to action. The current NIH practice of allocating funding disproportionately to a minority of investigators, institutions and states is counterproductive and wasteful. (For context, about half of all NIH RPG funding goes to about 3% of RPG-funded organizations.)
The most effective way to eliminate the deleterious impacts of diminishing marginal returns would be through funding caps–as proposed by Bruce Alberts three decades ago (Cell 1985; 41:337-338). The available data provide an evidence-based, logical set-point: cap funding at a level that is close to the point at which diminishing marginal returns become evident. According to the data and Lorsch’s example (above), a reasonable funding cap per investigator would be about 2 R01-equivalents (roughly $400,000 annual direct costs)*.
Alberts also pointed out an additional benefit of capping total funding per investigator: “Such a plan would of course save funds and thereby allow more scientists to be funded.” This would increase the diversity of tools, perspectives and creative ideas that could be harnessed.
—
*BTW Mike: Please consider presenting your RCR and similar data normalized to annual total costs (rather than total award over multiple years, which varies between grants). This would help readers to see more clearly the point at which diminishing marginal returns actually kick in–which is far, far below the arbitrary “million dollar annual direct cost cap” that was suggested before there were solid data for returns on investents.
The relative citation ratio assigned to a paper is likely to be highly sensitive to the field in which it is classified. For works that span multiple fields or are near field boundaries, the results are likely to be highly unstable and unfair.