Find NIH Funding Information More Quickly and Easily with RCDC’s New Look and Feel

Posted

NIH recently launched several enhancements to allow the public to more easily and quickly find funding information for various NIH research areas. The new look and feel of the NIH Research, Condition, and Disease Categorization (RCDC) Categorical Spending webpage adds to NIH’s long-standing efforts to enhance transparency and accountability into NIH funding decisions and the research areas NIH supports.

RCDC launched in 2008 as a tool within NIH’s Research Portfolio Online Reporting Tools (RePORT) suite. It provides estimates of annual support level for more than 300 research, condition, and disease categories based on grants, contracts, and other funding mechanisms used across the NIH, as well as disease burden data published by the CDC National Center for Health Statistics. More on the RCDC process is available on this post from 2018.

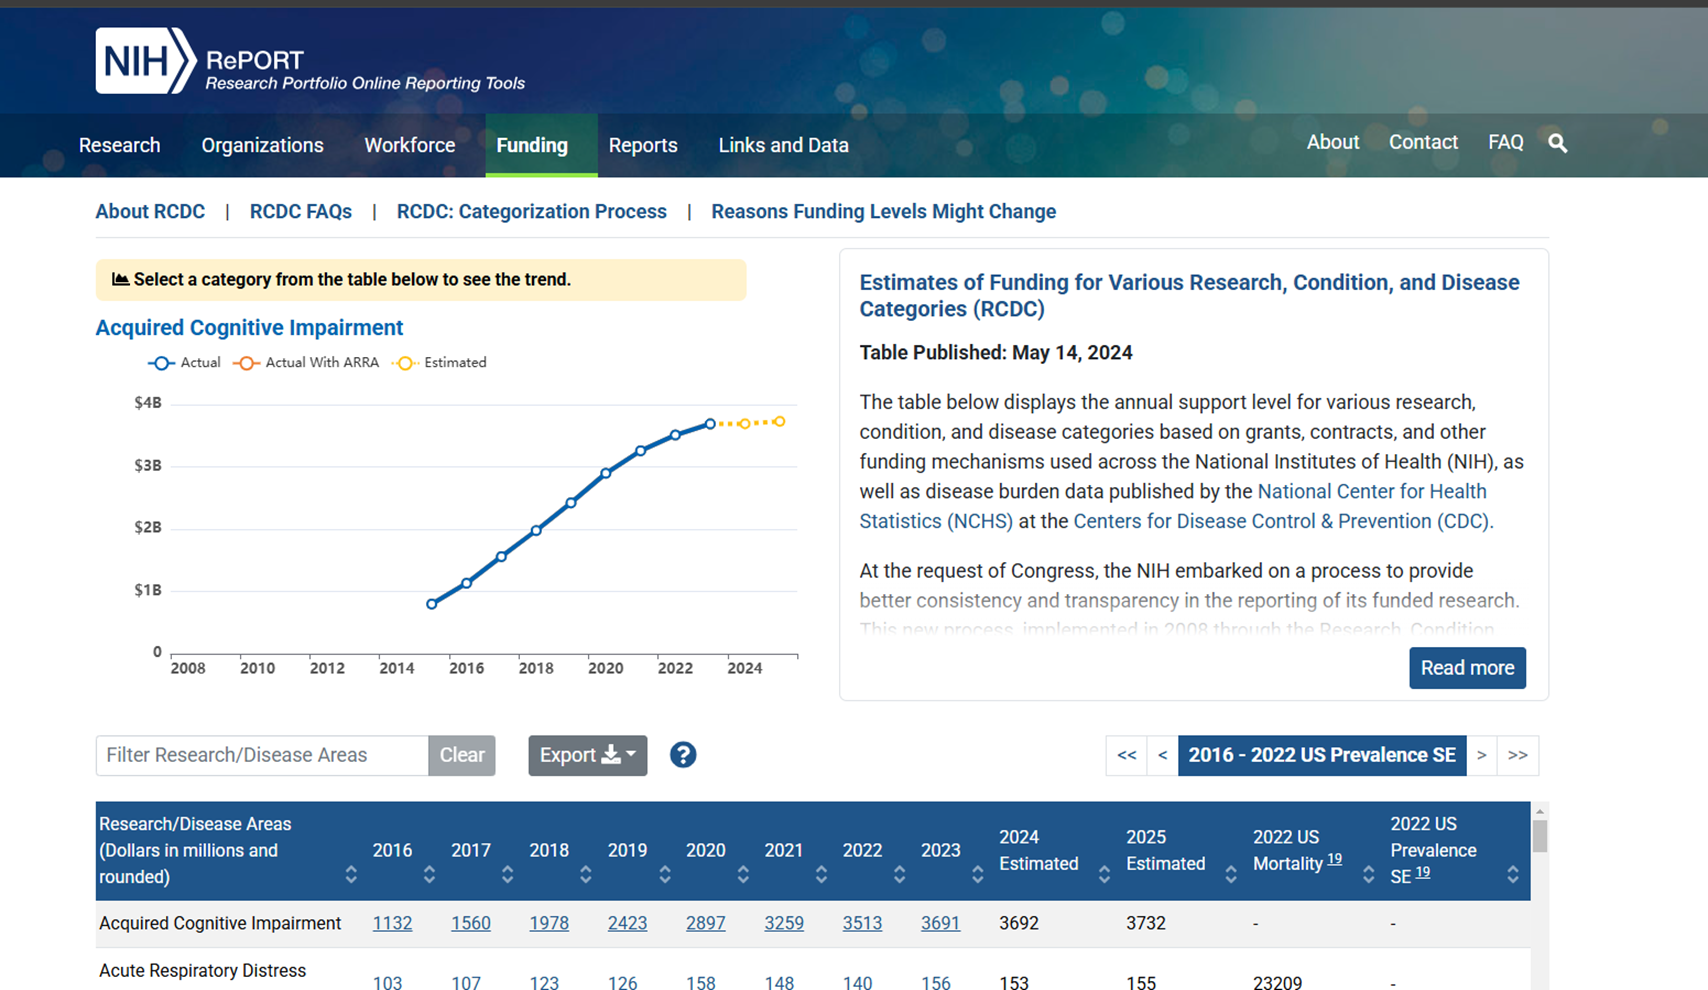
The new visual and contextual changes aim to improved usability and understanding of the RCDC categorization process. In particular, the categorical spending page was reorganized so data are more prominent and easier to navigate.

Navigation improvements simplify finding information on FAQs, the Categorization Process, and the biomedical thesaurus. The information in the data tables are more visible due to collapsed textual information  and frozen table headers (Figure 1).

Figure 1 is a screenshot of the NIH RePORT RCDC home page. At the top are links to the About RCDC page, RCDC FAQs, RCDC: Categorization Process page, and Reasons Funding Levels Might Change page. At the left center of the page is a line graph showing the annual support level for Acquired Cognitive Impairment in billions of dollars (on the Y-axis) for fiscal years 2008-2024 (on the X-axis). To the right is a box titled “Estimates of Funding for Various Research, Condition, and Disease Categories (RCDC).” That box provides an explanation of a below table displaying the annual support level in millions of dollars for various research, condition, and disease categories based on grants, contracts, and other funding mechanisms. The description can be expanded using a button titled “Read More”. At the bottom of the page are the first two rows of a table providing research/disease area support in millions of dollars 2016-2025. The disease areas “Acquired Cognitive Impairment” and “Acute Respiratory Distress” research/disease areas are shown.
Figure 1

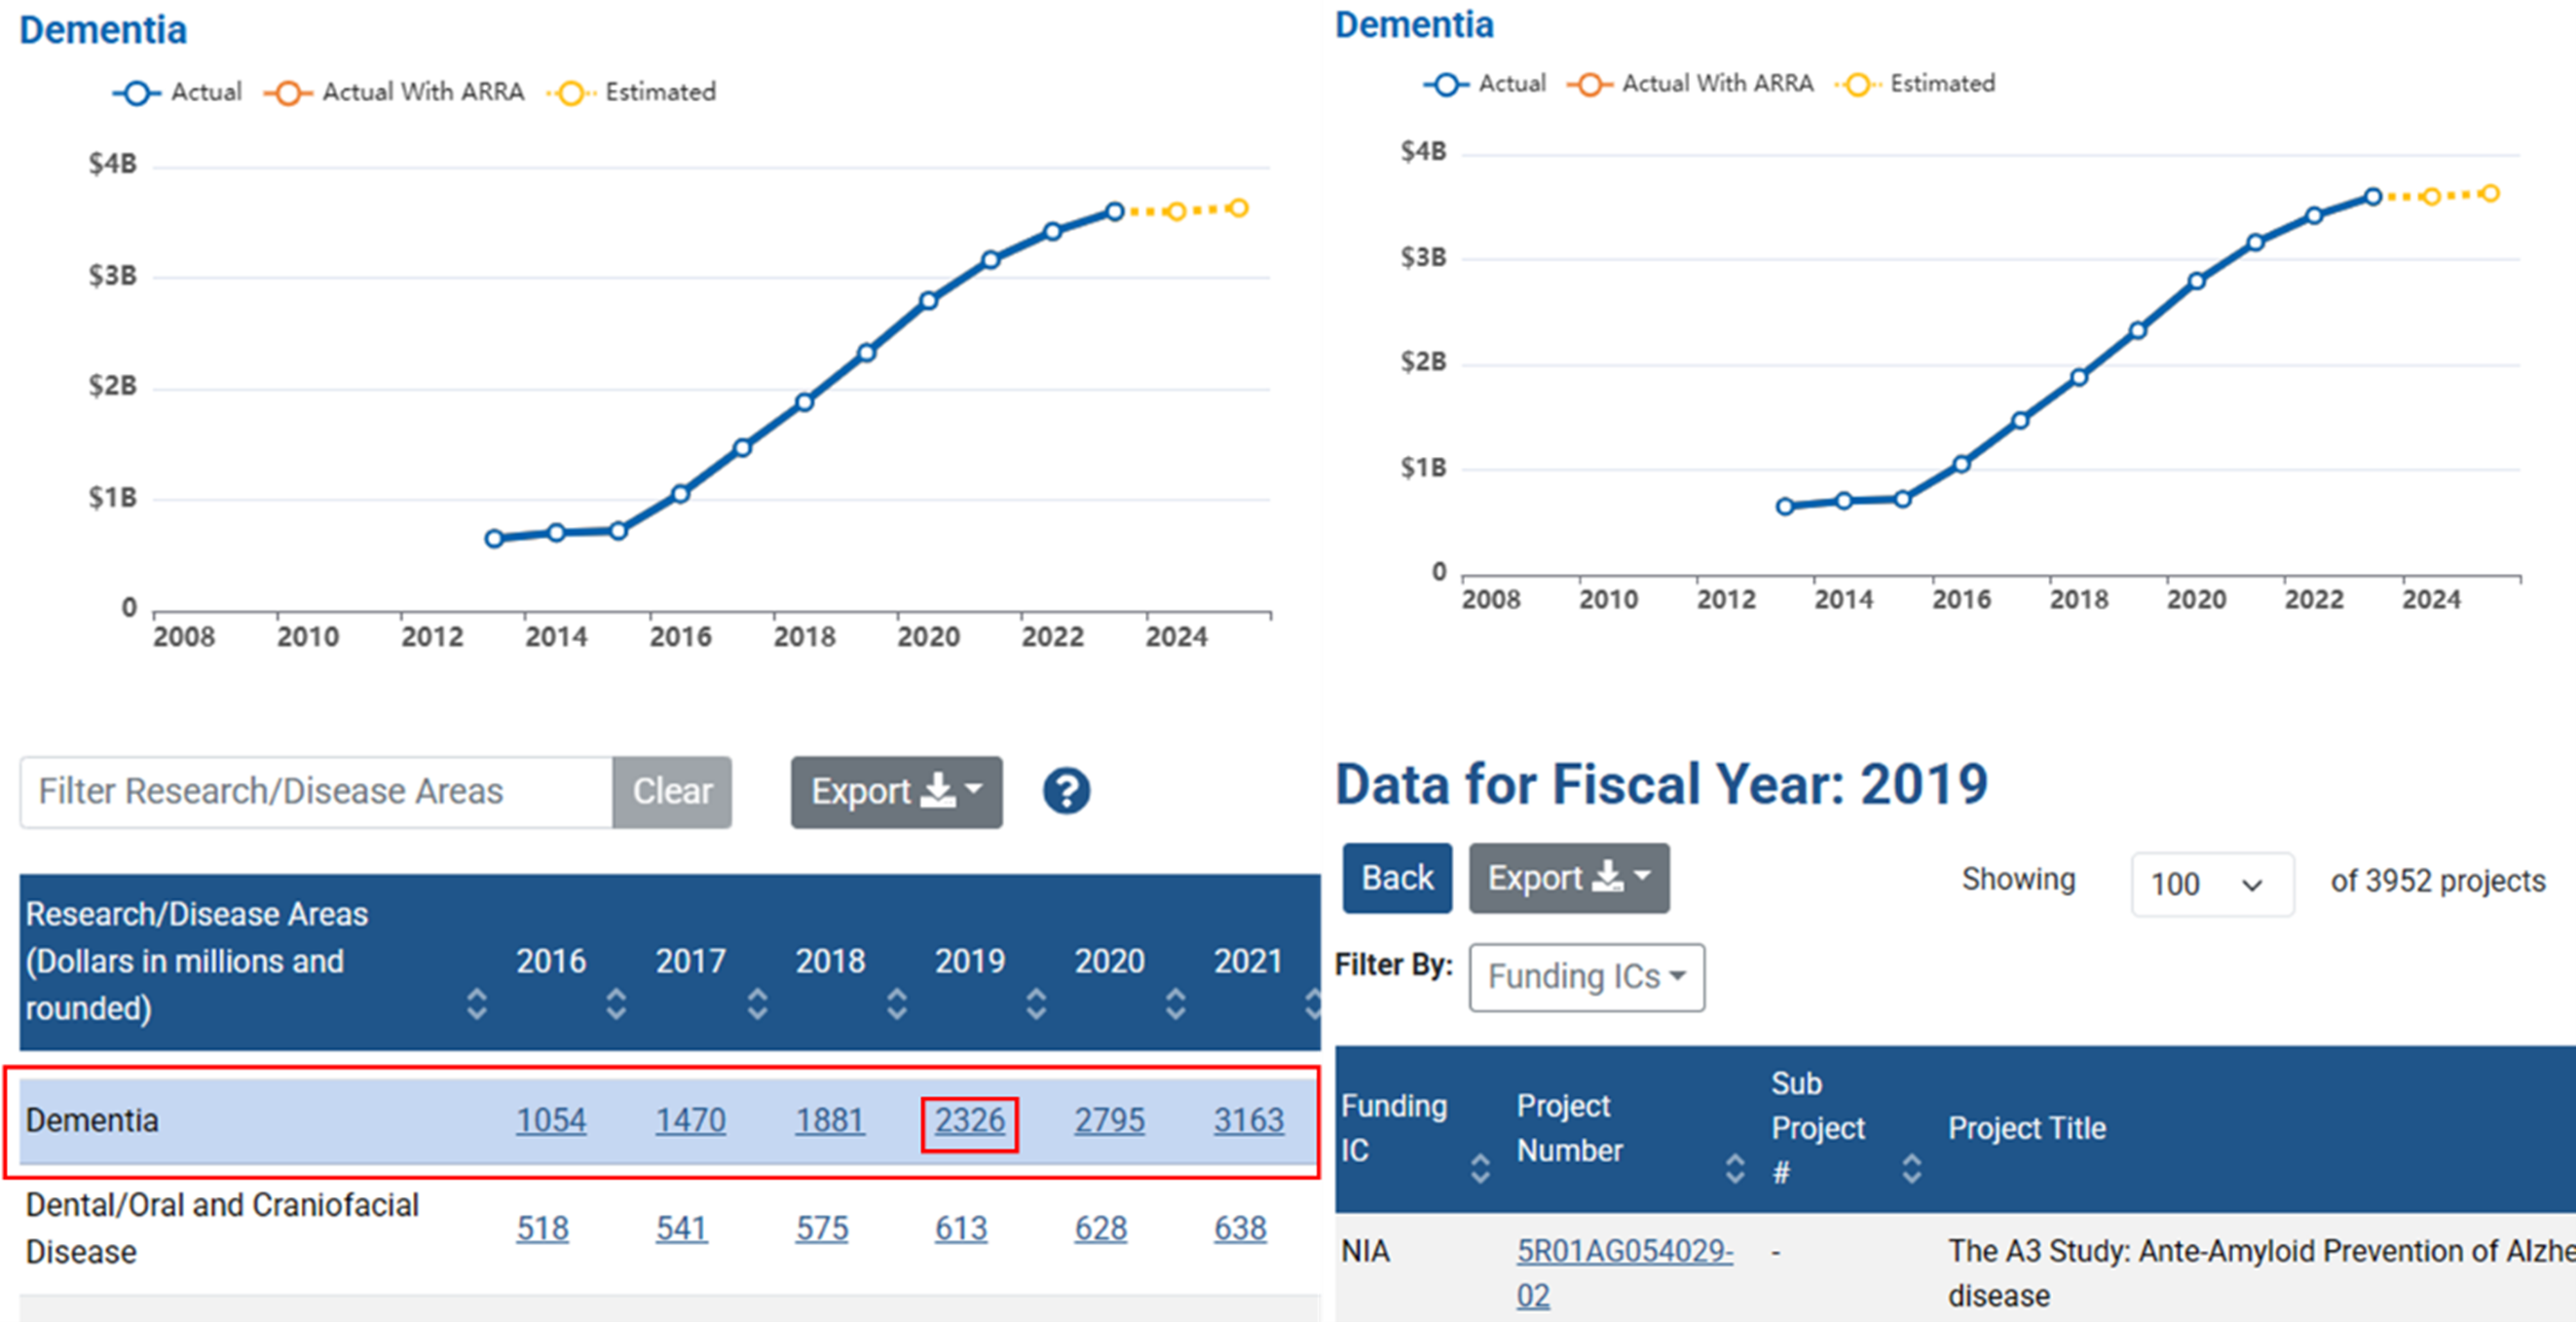
When selecting a particular category, the line graph on the top left of the page will  automatically adjust to reflect funding amounts over time for that topic area (Figure 2, left image). Selecting support data for a given fiscal year will also reveal information about specific projects (Figure 2, right image).

Figure 2 shows two side-by-side screenshots of data for the Dementia RCDC category. The left screenshot shows a line graph providing the annual support level for the Dementia disease area in billions of dollars (Y-axis) for 2008-2024 (X-axis). Below the graph is a table showing the support level in millions of dollars for the “Dementia” disease area 2016-2021, which is highlighted blue. There is a red box around the row and within it a smaller, red box around the support level for 2019. The right screenshot shows the same graph as on the left. Below the graph is the title “Data for Fiscal Year: 2019.” Below the title are options to go back, export, and filter by funding IC. The table header row now reads Funding IC, Project Number, Sub Project #, and Project title. The visible row lists the NIA project 5R01AG054029-02 titled “The A3 Study: Ante-Amyloid Prevention of Alzheimer’s disease”
Figure 2

Results can be narrowed further if interested in a particular NIH Institute or Center (Figure 3). To sort in this way, a user would need to click on the dollar amount for a given disease/research area and a given fiscal year in the main table.

Figure 2 shows two side-by-side screenshots of data for the Dementia RCDC category. The left screenshot shows a line graph providing the annual support level for the Dementia disease area in billions of dollars (Y-axis) for 2008-2024 (X-axis). Below the graph is a table showing the support level in millions of dollars for the “Dementia” disease area 2016-2021, which is highlighted blue. There is a red box around the row and within it a smaller, red box around the support level for 2019. The right screenshot shows the same graph as on the left. Below the graph is the title “Data for Fiscal Year: 2019.” Below the title are options to go back, export, and filter by funding IC. The table header row now reads Funding IC, Project Number, Sub Project #, and Project title. The visible row lists the NIA project 5R01AG054029-02 titled “The A3 Study: Ante-Amyloid Prevention of Alzheimer’s disease”
Figure 3

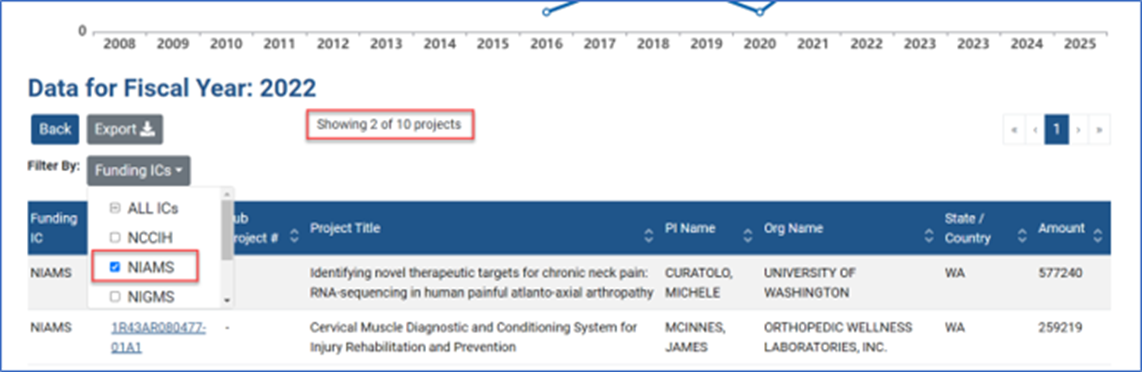
Application identification numbers can now be exported for funded awards for any fiscal year in any given category. Previously RCDC only reported the project number for an award. Because application IDs are unique to an individual fiscal year, it is easier to now connect results from RCDC with those obtained in other RePORT tools.

Before submitting your comment, please review our blog comment policies.

Leave a Reply

Your email address will not be published. Required fields are marked *