
21 Comments
Understanding NIH’s system of percentiling can be a challenge. My posts on how percentiles relate to paylines and success rates continue to get a lot of hits. A recent presentation by NIH’s Center for Scientific Review provided an example that I thought might be helpful to people trying to understand more about how a percentile is calculated for some grant applications.
A percentile, defined in its broadest sense, is a relative ranking of an application within a set of applications. In many cases a percentile rank is based on impact scores, and calculated against the set of all applications reviewed in the current and the preceding two review rounds. But this isn’t always the case. For example, applications reviewed by an ad hoc study section might use a different percentile base. (When percentiling is used, the summary statement you receive will identify the base that was used.)
NIH uses percentile calculations to improve our ability to compare applications across different application cycles and across different study sections. Percentiling allows NIH institutes to compare applications even when different study sections have different scoring behaviors. It’s natural for reviewers to judge an application in comparison to those immediately around it. Additionally, some study sections may have a relatively small sample of applications; combining review rounds in these cases can reduce noise and variability.
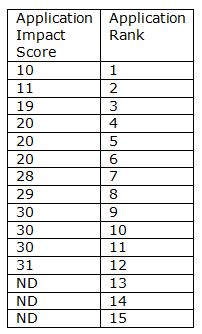
Let’s look at an example so you can see how this works. Say we have 15 applications, with impact scores ranging from a high of 10 to those that are Not Discussed (ND). These applications would be ranked in order, like so:
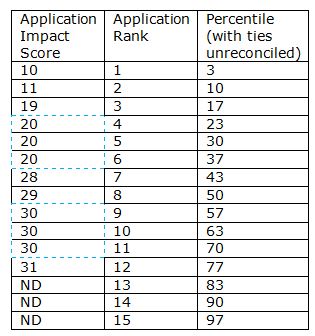
To calculate the percentile, we use the formula: ![]() ,where N is the total number of applications in the set. So for this example, N=15, resulting in the following:
,where N is the total number of applications in the set. So for this example, N=15, resulting in the following:
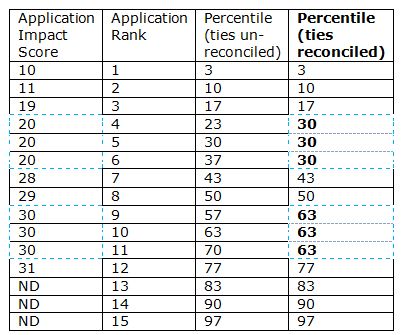
However, as you can see, this formula doesn’t work as is for applications with tied scores (see the highlighted cells above) so the tied application are all assigned their respective average percentile:
Not all applications are percentiled. Whether an application is percentiled depends on the grant mechanism, the institute, and the funding opportunity. For example, applications submitted in response to a request for applications (RFA) are never percentiled.
I hope this example – along with my earlier posts – helps shed more light on how peer review works at NIH.
This example nicely demonstrates the terrible effect of score compression!
Just got RFA scores. And guess what I had a percentile score!
So… Never say never!
It is really frightening to realize what a huge difference in percentile rank a good score like a 2.0 might have depending on number of ties, the cultural willingness of the study section to use the “1” and the placement of just one application before or after ones own. Particularly when the reviewers are given score calibration information that is supposed to be universal and absolute, not anchored by way of reference to the current pile.
Is there a minimum size of any percentile base?
I think what is also not appreciated is the incredible effect voting out-of-range has. If the reviewers are closely tied, and even one reviewer votes out of range, the out-of-range vote can move the grant quite a few percentile points.
This is an insane way to do this. The difference between a 19 and a 20 in this example is 13 percentile points!
How about showing the distribution of priority scores under the new scheme? NIAID (IIRC) posted something early in the transition to illustrate the clustering of scores at the even integer marks dictated by post discussion scores that lack range. Has this held up across all study sections?
The main problem seems to be that percentile scoring ranks application in a way that the study sections don’t intend to. Clearly, a 19 and 20 are indistinguishable, hence they should have about the same likelihood of being picked up. That’s not the case for 17 and 30 percentiles. So turning scores into percentiles distorts them in a way that study sections don’t intend to. I suggest that the impact score be z-scored instead. Then minor differences will remain minor and visible to the POs and the institutes.
If the NIH intends to use ranks then the study section should discuss rankings. Moreover, none of these scores include any measure of error. Nobody thinks that study sections are precise to 1 part in 100, probably barely at 1 in 10. So why not quantify this?
Score compression is in part a problem created by the new scoring system, and my understanding at the time was that this was exactly the goal: To have more programmatic leverage to decide what to fund and what not to fund.
Before, a reviewer could give a score using decimal points. That was also arbitrary, but I think that less so than the current system, where one is restricted to a “2” vs. a “3”, when one feels that the right score is a “2.5”.
The result of the current system is a huge difference in percentile for a tinny difference in score and perhaps the NIH could revise what system introduced less randomness.
I totally agree. I can’t believe that the current scoring system got through “peer review.”
This is a completely unrealistic example, and does not provide any insight into issues with actual scoring patterns in real study sections. So all of you up in arms over how unfair it is that, e.g., “the difference between a 19 and a 20 in this example is 13 percentile points” don’t need to get so upset.
First, percentile bases always have a *ton* more than 15 applications. Second, the absurd score compression in this example–with 11/15 applications (73%) receiving impact scores of 30 or better–is never, ever, ever going to happen in a real study section. Rather, impact scores of 30 generally are centered around 15%ile, at least in properly functioning study sections. (This is anecdotal, and also fits with the data published by some ICs on scoring patterns.)
The only point of this example is to explain how percentiles are calculated, not to provide a realistic example of how scoring patterns and percentiles intersect. At least I sure hope that is the only point of this example! Because otherwise it is grossly misleading.
This example was made to illustrate how percentiles are calculated, so we limited it to 15 applications. Typically, there are 100-200 applications in a regular study section’s percentile table and a much lower percent of applications would have tied scores. Several rounds of review are combined calculate the percentile base.
Almost assuredly, the distribution of scores on the 1-9 scale is not normal (statistically speaking). The conversion to %ile is an attempt to create a rank sum list of sorts, which is at least the right test to do. If pooled over multiple rounds of review and assuming all the reviewers stay the same in their scoring over time (likely a false assumption), then this should produce a proxy for a rank list with the best applications at the top. However, like any non-parametric measure, insignificant differences might well lead to big changes in your placement on the %ile ranks. The CI for any given score is likely 5%ile, which is huge when funding lines are near the 10-12%iles. This is especially maddening because these small differences are amplified at the funding line, where scores are the tightest. If the system adheres strictly to the #’s, then there is a bit of a crapshoot as to whether grant X with a score of 20 gets funded over grant Y with a score of 21, as the difference here is effectively arbitrary.
However, I believe that the council reviews the 10-20 grants that are at or near the acutal payline and decides which of these to fund based on “programatic considerations” and which grants they view as the best. Although this means that a council is deciding your fate, at least it is a room of smart people who have decided that your grant is subjectively better or worse than a direct competitor. It aint perfect, but it is what we have.
The major problem is the dwindling pool of money. In earlier days, perhaps 25-35% of discussed proposals were funded: sometimes more. As the funds disappear, it gets more and more difficult to decide what is important and what only looks important. The NIH people are making the best of a very bad situation.
So, why not use real study section data?
On a separate but related issue, one of the issues I am becoming aware in the whole medical research grant universe (NIH, CMMI, PCORI, CDC, AHRQ, Foundations, etc ) is the enormous amount of time, effort, and money that is spent by Investigators, research teams, adminisistrators, etc in writing and resubmitting applications that go nowhere. I have not seen a philosophical discussion about not some the Darwinian aspects of medical research funding, but the sheer inefficiency of this part of the research cycle. Is there no better system we could create? One idea is to create fast-moving prescreen committees similar to that available for IRB protocols in Institutions with a less adversarial model.
If only one grant gets funded per study section, then there isn’t much point in having a competition for funding.
No matter how grants are percentiled from impact scores, and compression notwithstanding. When NIH is taking the brunt of sequestration in terms of domestic discretionary spending, the system, whatever is in place, is more likely to reflect human “noise”. That is study sections are going to respond differently than they did eleven years ago. Consequently so are program officials, institute policies, and so forth. The bottom line is this, researchers need to press Congress to relax the financial straightjacket in which we find ourselves. Under current plans until 2020, no matter how NIH policy officials try, things will become unimaginably worse,
Another problem emerges when CSR periodically attempts to decompress scores by emphasizing that reviewers should use the full 1-9 range. This has an immediate effect on study sections such that their scores tend to rise. This would not be a problem if percentiling were based on only the current study section meeting. But because it also includes the previous two rounds, the current grant applicants are placed at a disadvantage.
A very important point is made here. It is astonishing that section members have to be reminded at every turn about the matter of score distribution. One wonders why a mean and distribution of scores for each section member is not made available to all committee members in order to highlight the matter and to inform other section members prior to score voting. Not only does the periodic emphasis to decompress have the impact mentioned above in disadvantaging current applicants, but I have participated in meetings where the decompression admonishments came in the middle of the “stack”, and I’d be willing to bet that the major determinant of scores in that case was whether the committee scored the grant before or after the admonishment.
In terms of scoring applications in review, nobody has commented on reviewer-effects. There can be large differences among the distributions of scores assigned by individual reviewers. This is particularly troubling since it can affect whether a proposal gets scored (because of easy reviewers) or not discussed (because of hard reviewers). Since NIH tries to use ranks to buffer the effects of different study sections, why does NIH not also adjust individual reviewers’ scores to adjust for individual reviewer effects? This could be done trivially either within a review cycle, or even cumulatively over review cycles, as data accumulate.
There is an apparent discrepancy here that I do not understand. The procedures described here for generating percentiles treat NDs quite differently than the description of this issue in the September Peer Review Notes.
http://public.csr.nih.gov/aboutcsr/NewsAndPublications/PeerReviewNotes/Pages/Peer-Review-Notes-Sep2013part3.aspx
Specifically Peer Review Notes says: ” Not Discussed applications are included with an impact score equivalent to 91, putting them at the bottom of the table.”
Which is correct? And why would CSR toss out the Impact scores of the reviewers and assign them the unrealistically harsh and off-scale 91? What is the effect of the increasing proportion of ND applications?
All of this manipulation of scores and percentiles is meant to make up for more fundamental problems with reviewer behavior. CSR in recasting the way study sections operate, the reinvention of peer review (churning memberships, phone reviews, “cut-to-the-chase short sessions and asynchronous chatroom reviews), has substantially degraded the reviewing process. It is sad to see and read so many “cameo” reviews in which sometimes it is clear that fellow study section members have not engaged in the science of the proposed work. The decrease in the face to face review time has nearly eliminated the process of developing and establishing personal credibility of reviewers on any given panel. The result is cursory review with bullets but often little evidence of the smoking guns supporting identified faults. The human behavior aspect of peer review has been ignored for perceived efficiency. The casualty here can be the deep sixing of work with substance and lasting value upon which the science of health is founded. Sad.
Both are correct. To clarify: Not Discussed (ND) applications, as described above, do not receive impact scores from reviewers. So, in order to include and group them together at the bottom of the table, they are assigned an impact score of 91. Hope this helps clarify this!