
By looking to the past we may be able to better understand the flow of scientific knowledge going forward, and possibly even predict translational research outcomes. In their October PLOS Biology paper, Drs. Ian Hutchins and George Santangelo from the NIH’s Office of Portfolio Analysis devised a machine-learning strategy that taps into the trajectory of science by tracking knowledge flow from bench to bedside.
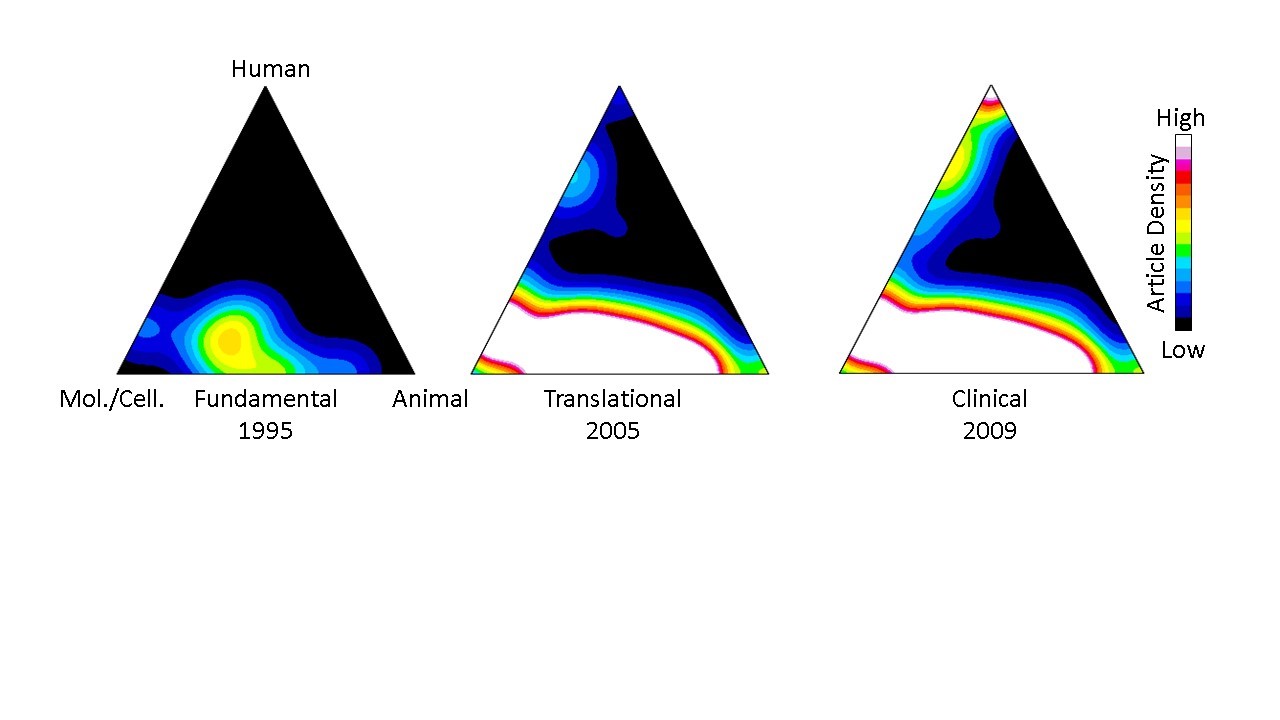
Their approach stems from a computational process, first described in 2013, that uses each paper’s Medical Subject Heading (MeSH) keywords to classify and quantify publications in PubMed according to three domains: human, animal, and/or molecular/cellular. Once classified, groups of papers can be visualized on a “triangle of biomedicine” with three vertices representing these three domains (Figure 1). Fundamental research papers are characterized by a heavy focus on molecular/cellular biology and animal research and appear toward the bottom of the triangle, while translational work is characterized by a stronger human focus and appear toward the top.
Figure 1 displays a representative example of knowledge flow from fundamental to translational research for immunotherapy papers that led to Nobel prize-winning cancer treatments. The “hotter” colors relate to higher densities of publications. The resulting density map depicts, in the authors’ words, “the translational potential of publications across the entire biomedical research landscape.” The earliest work was fundamental, primarily centered between the molecular cellular/animal vertices of the triangle of biomedicine (left). Ten years later, translational studies were beginning to populate the region just below the human vertex (middle), and research culminated in clinical studies several years later at the top (right).
Citation metrics historically focused primarily on the quantity of citations, which are easy to count. However, we can glean more information – including translational potential — by not only counting citations but also by assessing the nature of citing papers. Fundamental papers with a pattern of being cited by more human-focused articles might be more predictive of being cited by a future clinical article. This may be because those fundamental research papers cited by progressively more human-oriented papers are beginning to find a use among clinical researchers.
To test this hypothesis, the authors used machine learning to gain insight into the trajectory of knowledge flow from cited articles to citing articles. The machine learning algorithm considers papers published within the last 20 years available in the NIH’s Open Citation Collection (see here for more) and the features of the papers citing them to determine which papers are more likely to be cited by a clinical trial or guideline, which is an early indicator of translation. The machine was trained on a dataset of 100,000 papers with a binary indicator of whether each paper had ever received a citation by a clinical trial or guideline.
Figure 2 shows how the training data were assembled with MeSH terms for the article of interest and citing papers, as well as the overall citation rate for the article of interest.
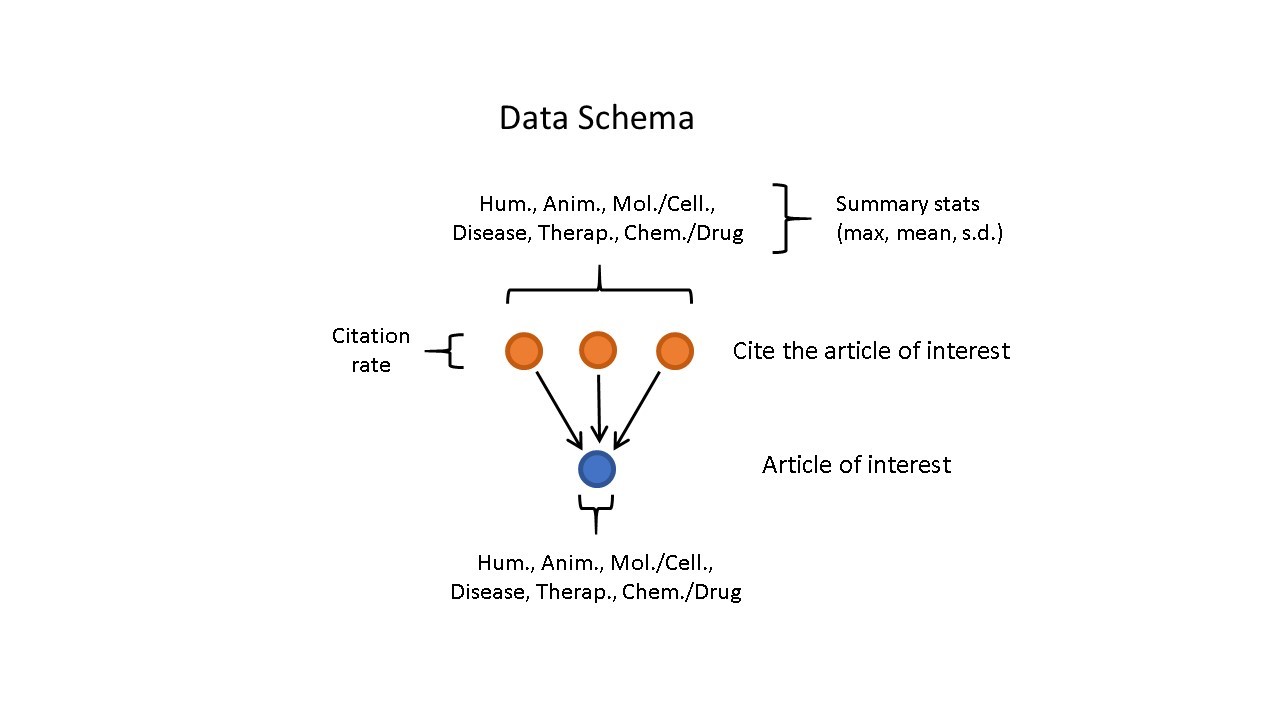
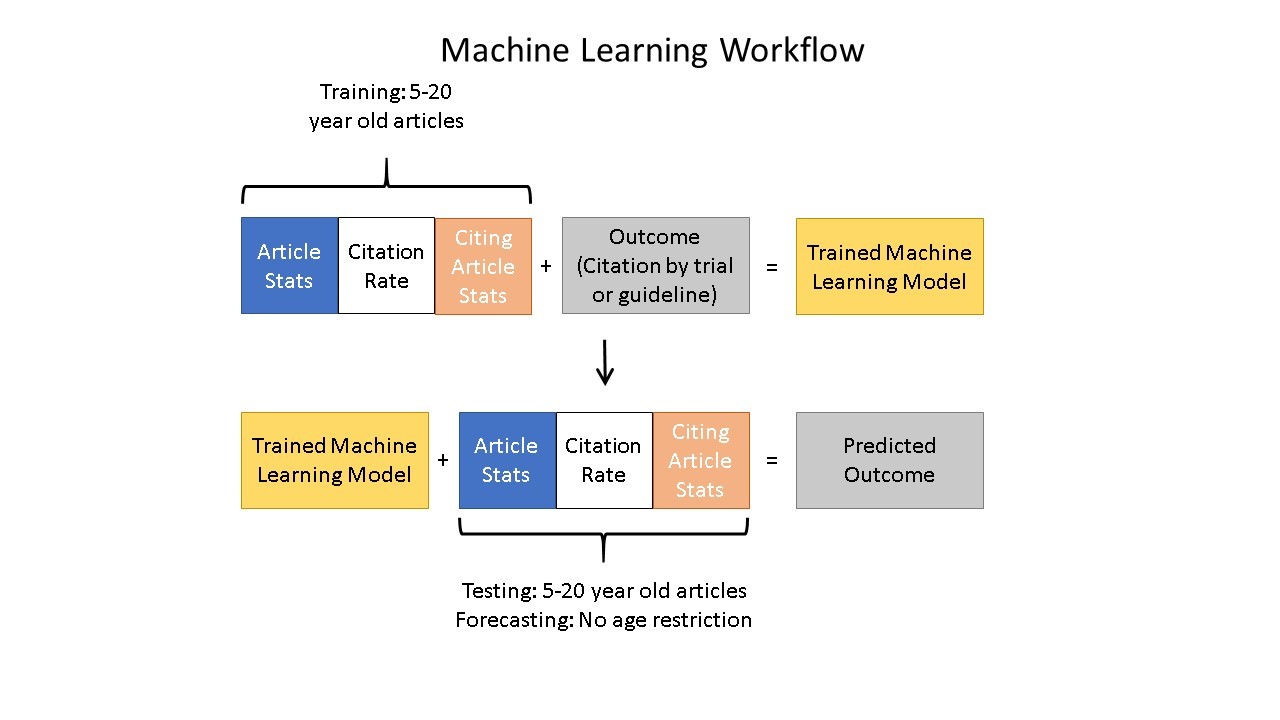
Figure 3 shows the machine learning training process and how it leads to generating predictions.
Their machine-learning process worked. The algorithm could detect patterns in citation dynamics between studies that were eventually cited by a clinical trial or guideline compared to those that were not. Papers with high prediction scores were more likely to be cited by a clinical trial. That trial was found to be more likely to report statistically significant results and to progress onward to the next clinical trial phase. The prediction scores from the algorithm were termed the Approximate Potential to Translate, and are available in the Translation module of iCite 2.0.
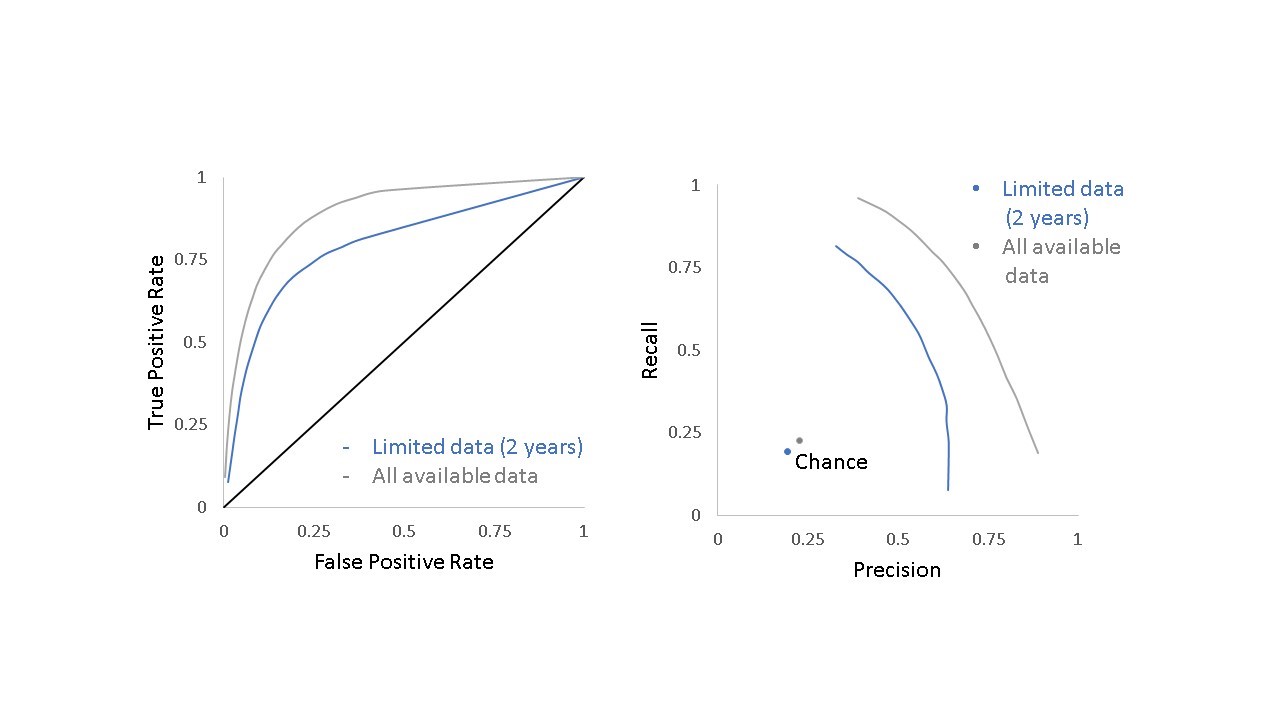
The algorithm further revealed that two years of post-publication citation data were sufficient to predict whether a paper would be cited by a future clinical trial or guideline (F1 score of 0.56 compared to 0.19 for chance). Figure 4 shows the relative performance for the model including only the data available two years after publication (blue line) and the model that includes all data available at the time of the analysis (gray line) compared to chance alone.
The approach proved slightly more accurate than human peer reviewers at predicting clinical citations. Even with that said though, this does not necessarily mean that the algorithm will be replacing people any time soon.
This study suggests that predictions of translational research activity can be made within a relatively short period of time after publication. Such predictions could be considered as part of a holistic approach to decision-making (such as the development of new funding opportunities), alongside expert opinion and other metrics.
0 Comments