
12 Comments
By the 21st Century Cures Act, the Next Generation Researchers’ Initiative calls on the NIH to develop policies to increase funding opportunities for new researchers seeking to secure early independence. To put the Initiative in perspective and to extend on previous blogs we’ve posted on changing demographics in NIH-funded researchers, we thought it would be useful to explore trends according to career stage.
First, some definitions. We define “Early Stage Investigators” (ESI) as those who are within 10 years of completing their terminal degree or post-graduate clinical training and who have not yet secured independence as a PI of a substantial NIH research award. We define “New Investigators (Not ESI)” as those who have not yet secured independence as a PI of a substantial NIH research award but are more than 10 years from completing their terminal degree or clinical training. We define “Early Established Investigators” as those who are within 10 years of receiving their first substantial NIH award and who received their first substantial NIH award as an ESI. Finally, we define “Established Investigators” as all others.
Second, for the most part we will focus on competing R01-equivalent applications and awards – these include R01, R23, R29, R37 and RF1 activity codes.
In 2016, NIH received competing R01-equivalent applications from 24,498 unique applicants: these included 3,729 Early Stage Investigators (15%), 4,813 New Investigators who were not ESIs (20%), 3,461 Early Established Investigators (14%), and 12,495 Established Investigators (51%). Figure 1 shows box plots for age distribution by career stage. Age increases as we move from Early Stage Investigators to Early Established Investigators to New Investigators (Not ESI) to Established Investigators. The age distributions are not particularly skewed, as the means approximate medians in all groups.
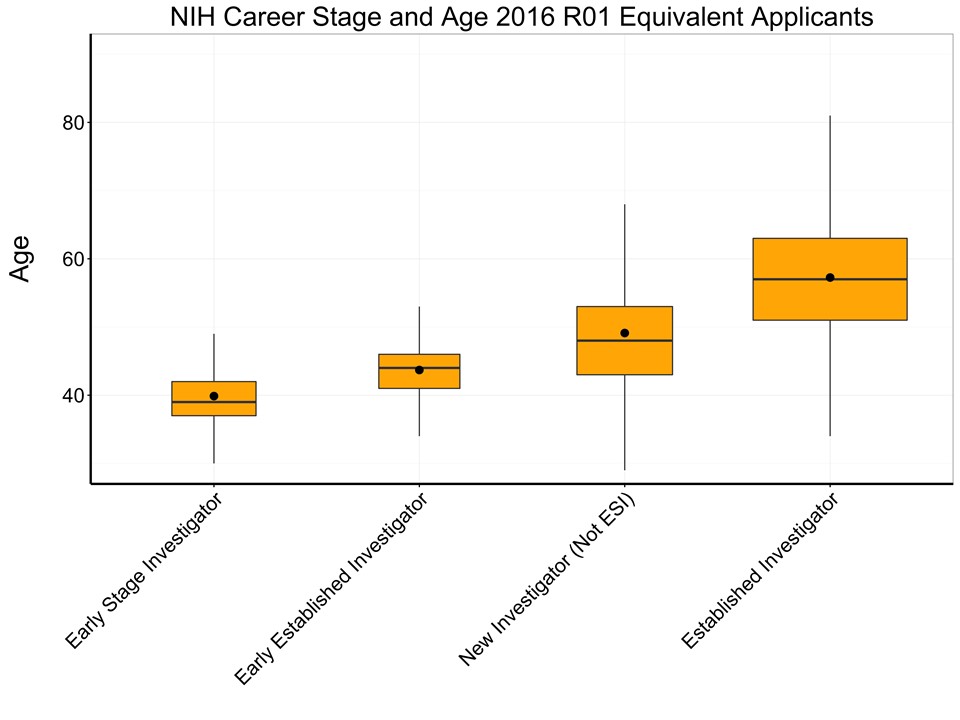
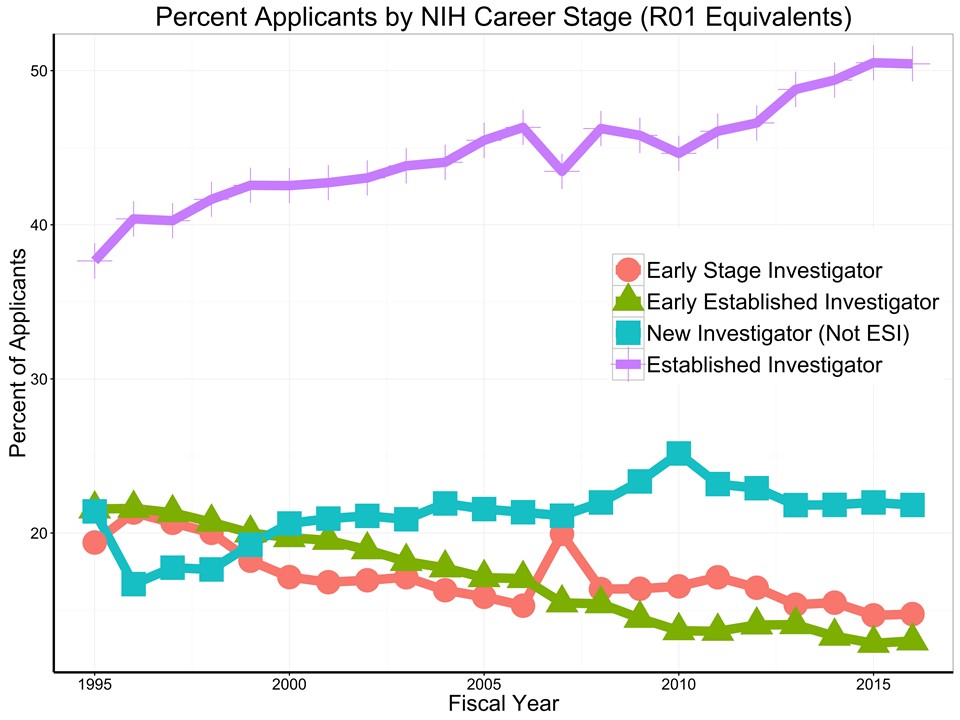
Figure 2 shows the number of unique R01-equivalent applicants each year by career stage for each fiscal year since 1995; Figure 3 shows the same data by proportions. Over time, the proportions of older investigators (New Investigators who were not ESIs and Established Investigators) increased, while the proportions of younger investigators (ESIs and Early Established Investigators) declined. (Note: in 2007, NIH introduced the “New Innovator” DP2 awards, and DP2s were not considered part of the R01-equivalent definition for considering ESI status until 2008. For this reason, there is a notable spike in the number and percent of ESI applicants in 2007, and a proportional decrease in the percentage of established investigators applying for R01-equivalents in 2007.)

Figures 4 and 5 show analogous data for awardees. The proportion of awardees who were Established Investigators climbed, while there was a marked decrease in the proportion of awardees who were Early Established Investigators.
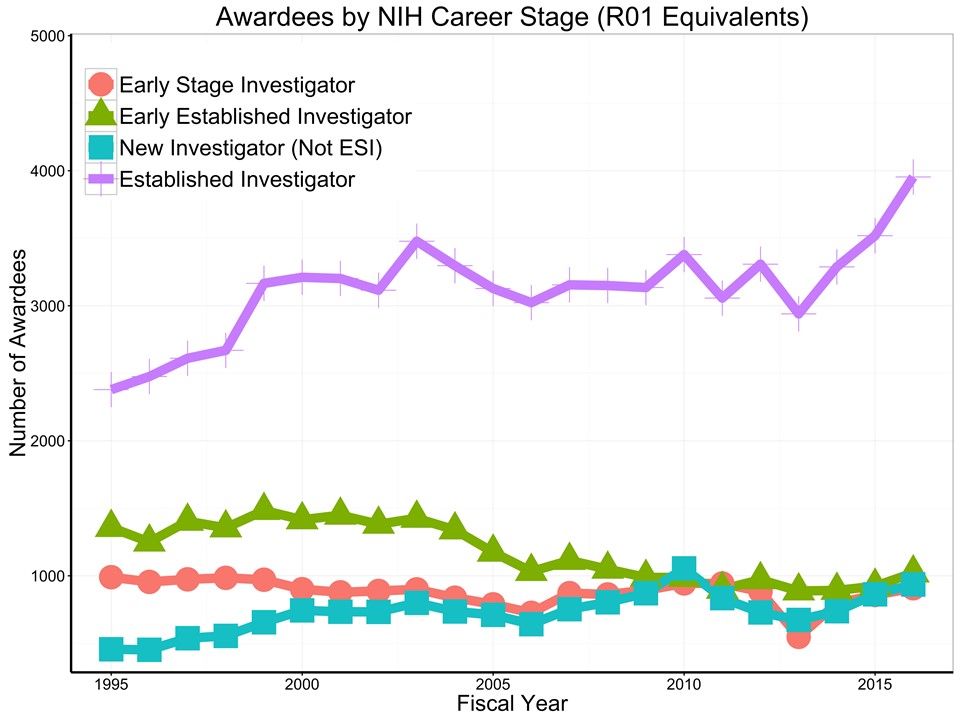
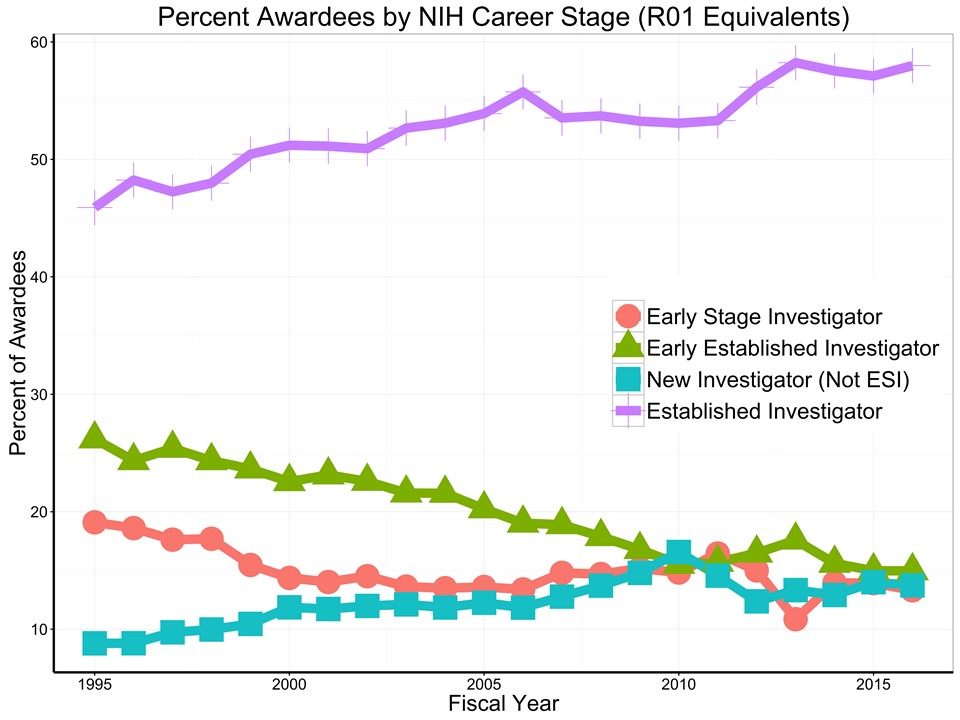
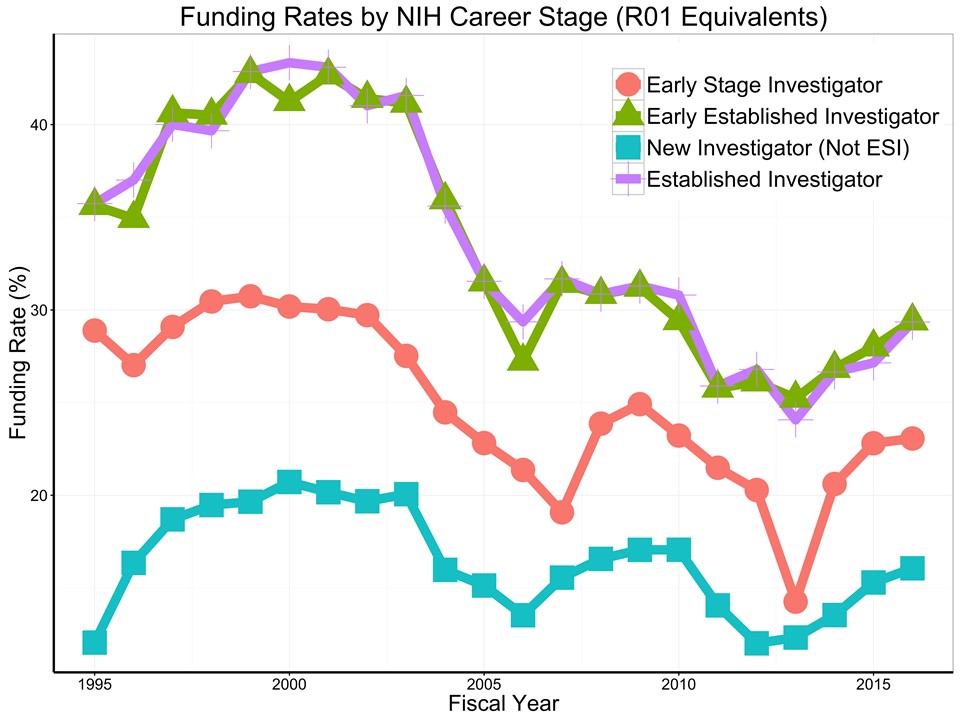
Figure 6 shows funding rates by career stage. The funding rate in any given fiscal year is the ratio of unique awardees to unique applicants. Funding rates increased substantially during the doubling (1998-2003) for all career stages, but less so for Early Stage Investigators. Funding rates for all career stages decreased dramatically after the NIH doubling ended in 2003. There were declines in 2013 – the year of sequestration – which were particularly severe for Early Stage Investigators.
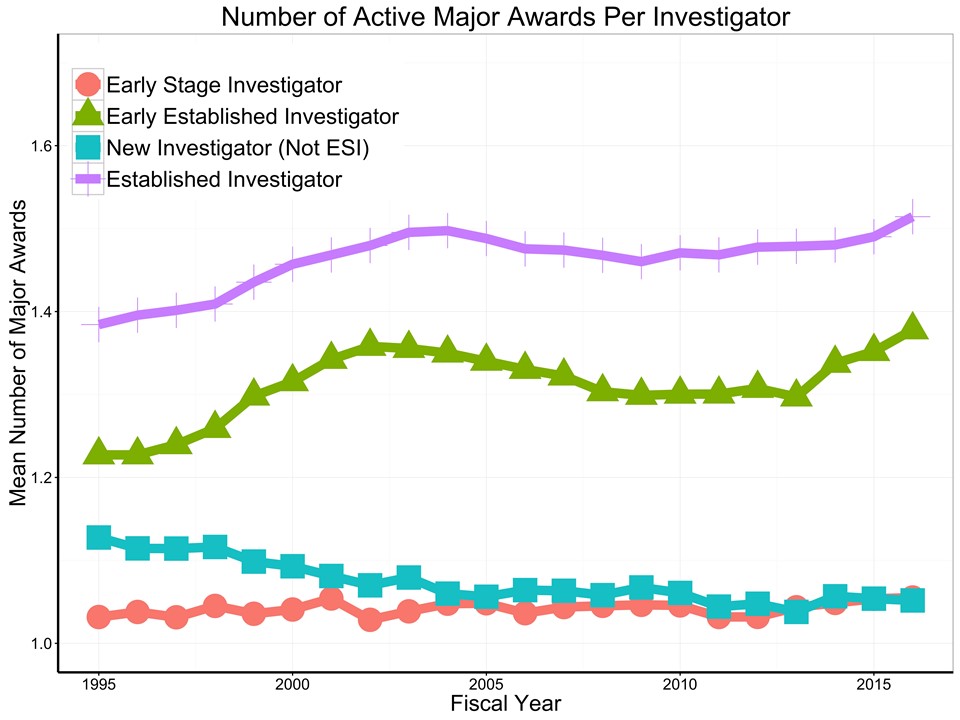
One reason why investigators may leave the NIH grant system is that they are unable to withstand a failed application if they don’t have other active awards to fall back on. Figure 7 shows the average number of active substantial awards, according to career stage. As expected, Early Stage Investigators and New Investigators who are not ESIs do not have many active awards. Established Investigators have more active awards and this has increased somewhat over time. Thus, Established Investigators may have an easier time staying in the system.
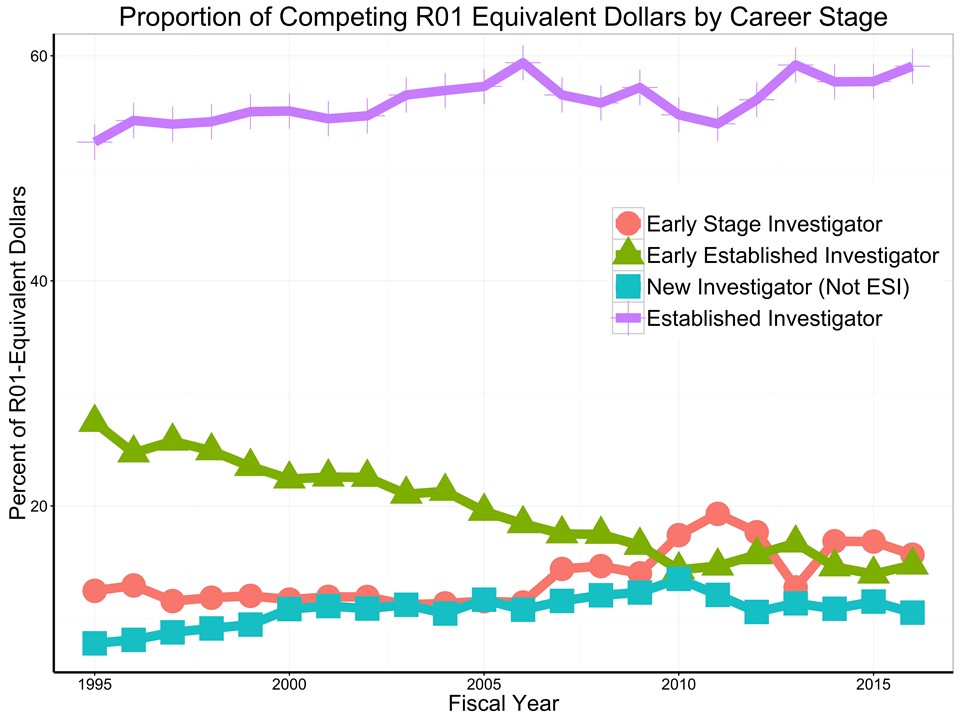
Established Investigators not only make up a greater proportion of awardees (Figure 5), they also secure, to an even greater extent, a larger proportion of competing award dollars (Figure 8).
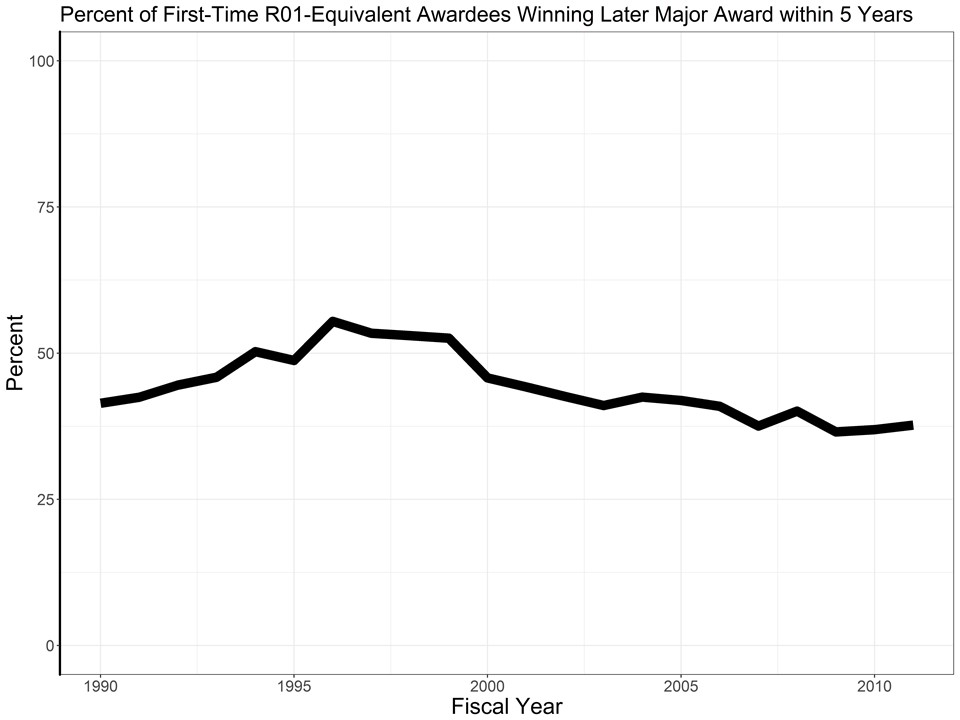
Finally, Figure 9 shows the percent of all first-time R01-equivalent awardees who go on to receive at least one more second substantial award within 5 years. For those he received their first award in 1996, over 55% went received at least one substantial award. For first-time awardees in 2011 that value fell to only 38% (and this even accounts for ARRA and the multi-PI policy).
In summary, consistent with changes in demographics, we have seen substantial changes in the career stage composition of R01-equivalent applicants and awardees. As the Next Generation Researchers’ Initiative will focus on increasing funding for Early Stage Investigators and Early Established Investigators, we may see some turning of the curves.
Many thanks to the Statistical Analysis and Reporting Branch of the NIH Office of Extramural Research for their work on this analysis.
Thanks for these data, Mike. Is it possible to post the mean and median ages for the different career stages presented in Fig. 1?
Data tables for the graphs shown are available on RePORT. Here is a direct link to the Excel file:https://RePORT.nih.gov/FileLink.aspx?rid=950
Looking at these data, it is truly chilling to see what a wonderful world the NI group lives in — representing nearly 25% of the entire workforce (6000 applicants) with the lowest funding rate (15% vs 25% for ESI vs 30% for EEI)– apparently the most struggling group yet NIH just leaves them in cold, unbelievable!!
Established investigators are by far the most likely candidates to get new R-01 funding. New investigators and early stage investigators have a steep hill to scale. They cannot get funded because they have no established track record and they can’t have the track record unless someone gives them a break!! All of us would agree that research costs a lot of money- good research means quality data and animal models etc…no wonder I am beginning to feel that philanthropic support is the future of research funding.
The fault lies with the NIH reviewers who do not follow guidelines for whatever type of grant they are reviewing. Such as giving better scores for grants with preliminary data and low innovation even when it is stated that preliminary data is not needed and innovation is the key focus. Fault also lies with NIH staff who do not enforce the rules for specific RFPs.
Isn’t it likely that the negative sloping ESI and EEI curves in Figure 3 are caused by longer and longer postdoctoral periods? A new faculty member that did a 7-8 year postdoc only has 2-3 years to secure an R01 as PI, if they don’t then they automatically age out of the ESI AND EEI categories. Thus increasing postdotoral periods over the shown time frame would explain these negative slopes. Perhaps the the “new investigator” status should be based on first faculty appointment rather than time from terminal degree OR the new investigator time period from terminal degree (10 years) should be more in alignment with the average postdoctoral time period, whatever that may be.
In short, we produce PhD’s at a much faster rate than faculty positions, thus as the number of postdocs increases relative to available faculty positions the postdoctoral time period will continue to increase with time, which causes a decrease in the ability of new faculty to get a R01 within 10 years of their PhD.
Replace “new investigator” in my above response with ESI.
It would be interesting to see also the distribution of applicants and awardees in terms of gender within each group.
As with every other pursuit in life, the 1%-ers appear to be taken care off well. However, there is a new emphasis on making it ‘easier’ on the new/early career investigators. Many assistant profs are suddenly getting funded, despite having relatively mediocre programs. Some of this is because of misguided altruism. And some of this is because the 1%-ers are attempting to push their agendas through their academic progeny. It is also making it complicated during tenure decisions, particularly at mid-level institutions. There, decisions rely heavily on the ability to procure funding. As a result, many mediocre junior faculty who get NIH funding can now win tenure and then either abandon scholarly pursuits or fail to produce any substantial findings later.
Established investigators have not verified this data, but nonetheless I find your findings very interesting.
Would it be possible to divide the data into different demographic subcategories as gender, age, race, houseincome, etc.? Nevertheless I would find that very interresting!
Is there data available on the number of years an assistant prof has on faculty before receiving an R grant? (Rather than number of years post-doc?)