
27 Comments
Let’s delve a bit deeper into one of your and my favorite topics: success rates. Most of you monitor success rates as an indicator of NIH funding trends but also as the main way to determine your chances of receiving an NIH award. But what exactly do these rates mean? Our official success rates for the fiscal year – as defined here – are based on the number of awards made divided by the sum of the applications reviewed that fiscal year where revisions submitted in the same fiscal year are collapsed and counted as one application. We calculate success rates this way because historically we have been interested in the success of a project or an idea getting funded, rather than of the success of the individual application submission. But what is the likelihood of an individual application submission getting funded? This is pertinent because applicants often hear about individual institutes or centers with much lower paylines than the overall NIH success rate, and paylines are based on all the application submissions being considered by an institute or center. We call this an “award rate” – the number of awards made in a fiscal year divided by the absolute number of applications where we don’t combine resubmissions (A1s) that come in during the same fiscal year. The award rate calculation obviously increases the denominator (applications) for the same number of awards (in the numerator).
Another related term that I’ve discussed before is funding rate, which references the number of individual investigators that are seeking and getting funding, in a given fiscal year. As a person-based rather than application-based statistic, this metric counts applicants as funded whether they receive one or multiple awards in the same fiscal year. The numerator is the number of applicants receiving any funding that fiscal year, and the denominator is the number of applicants for that fiscal year. Funding rates, which are higher than either award or success rates, paint a more promising picture for your prospects of receiving NIH funding. You can find funding rate data for RPGs and R01-equivalents below and in the NIH Data Book.
Here are graphs of funding, success, and award rates for Research Project grants and for R01-equivalents only:
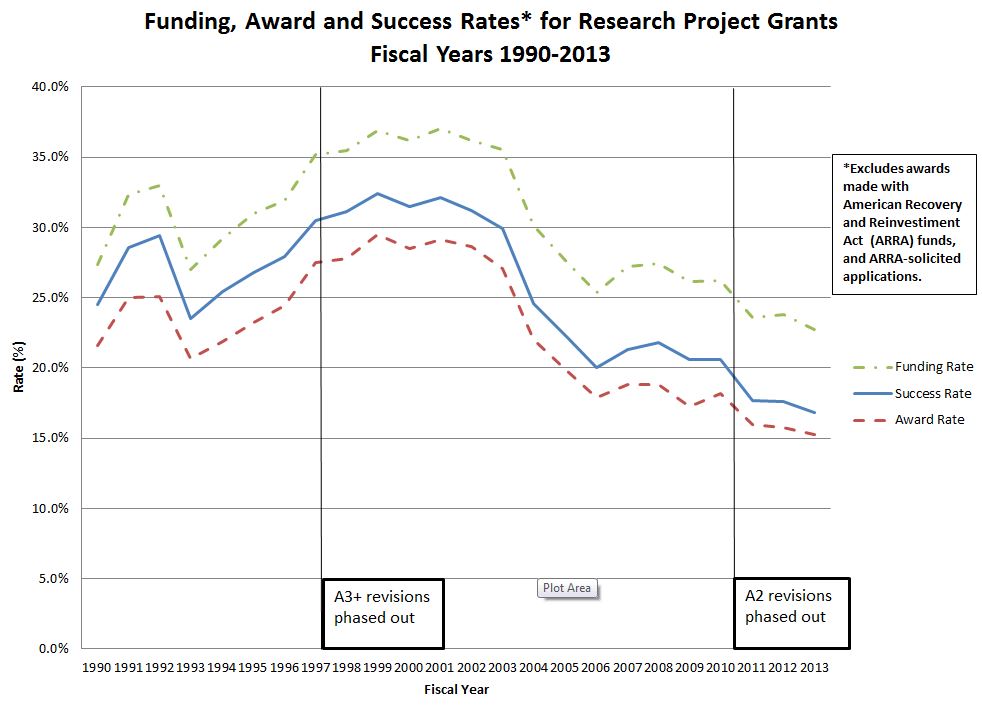
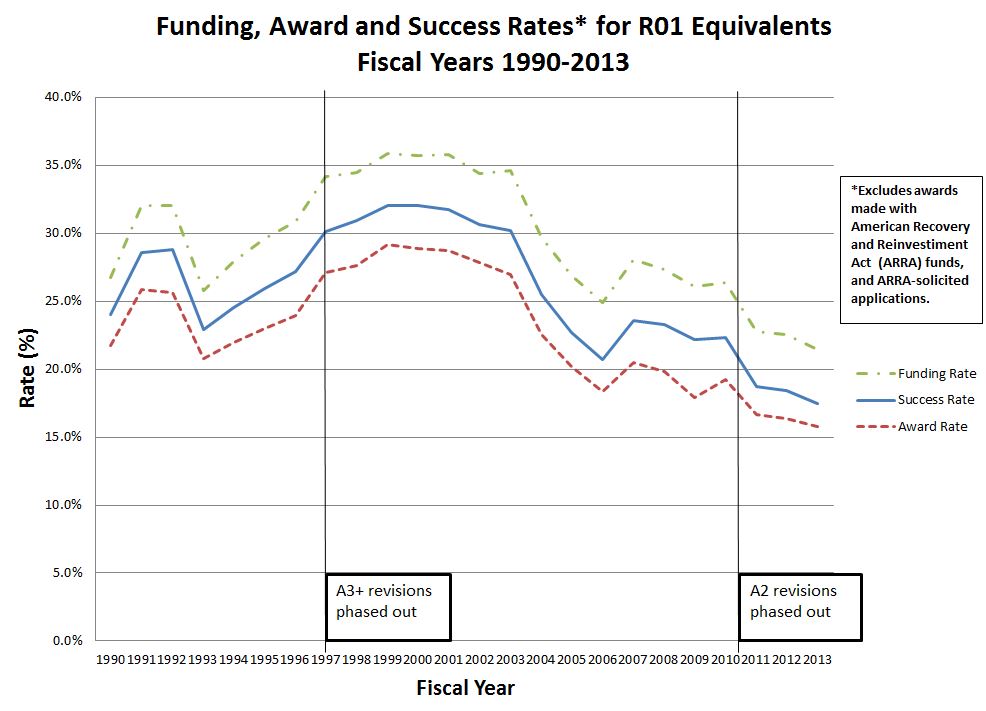
As you can see award rates are consistently lower than success rates each year, by about 3-5%, even when we’ve changed the number of resubmissions NIH will accept.
In summary, success rates, award rates, and funding rates each describe the “success” of NIH applicants in distinct and important ways. The choice of which rate to use depends on whether you are interested in the success of applicants by project, by submission, or by person.
Could the Rock Blog team provide a similar graphic with the funding rate, success rate, and award rate numbers for early stage investigators. I am curious to see if the differential narrows between the funding rate and the award rate, as early stage investigators might not be able to submit as many R01 applications on different projects, thus might not benefit from the higher funding rate levels observed in the graph above.
The NIH used to publish success rates of resubmissions for the same project, which typically went up indicating that submissions improved after a first review, and were accordingly rated higher. Is this still true? If success rates on resubmission were the same as on initial submission, that might indicate a serious failure of the review process, or at least indicate to researchers that it is not worth putting much effort into revision of proposals for resubmission. I have tried to get this statistic from the CIHR in Canada, unsuccessfully so far.
You can find data on success rates of research project grants (RPGs) and R01-equivalent grants, by submission number, on the RePORT “Success Rates” page.
How do multi-PI projects influence any of these rates (funding, success, and award)? Or maybe a better way of putting it is what fraction of R01 equivalents have multiple PIs on them – is this an increasing trend, and are these applications typically more or less successful than those with one PI?
Hmmm…so…no matter how you look at the numbers, this is the worst level of funding in at least 20+ years. Is this clear downward trend expected to continue? If so, are there any plans in the works to try and save the relevance of the NIH? Also, although I appreciate Dr. Rockey’s attempt at putting a positive spin on this by stating, “Funding rates, which are higher than either award or success rates, paint a more promising picture for your prospects of receiving NIH funding.”, it’s clear that even the ‘funding rate’ has declined by ~15% over the last 10-12 years and doesn’t exactly show any sign of leveling off. Not exactly a ‘promising picture’ any scientist can hang on their wall.
Along the same lines, I would be very interested in the statistics regarding the success rates for established women investigators as compared to men in recent years (beyond 2012).
I am glad to see that R01-equivalents with one PI are still being considered. I will keep on plunging along. Possibly, one day, I will reach success. Success, of course is measured by NIH award.,.
When are A1s going to be phased out?
Thanks for the great website. Can you comment on how these rates are likely to change in FY 13 versus FY 14? The sequester and its effects have all of those pretty confused as to what 2013 numbers really mean.
The way to read these data is the ratio of peak-to-trough values. Compared to a decade ago, support levels have dropped by half. What young person in the face of this reality would choose a career based on likelihood of a clearly catastrophic decline in NIH support? Why should a career in bio-medical research be encouraged in the face of this historic decline in likelihood of career success?
The award rate is certainly getting closer to the reality that we actually face, but it is still less than what the graph shows. Tell the dozens of PIs, including myself, that have received 10-15% and the NCI says we fall below the funding rate. The funding rate for the NCI is less than 10%. This is ridiculous when we have colleagues getting grants from other institutions after getting 10-15%. Their labs are not closing. Their PIs do not have to fire staff that took years to train. Something more drastic needs to be done. Great labs are shutting down and NIH keeps showing graphs that funding is not as bad as we know it is. NIH has had years to adjust to this downturn in funding, but they are not making decisions fast enough. For example, why is NIH still not capping faculty salaries at 50% or less, capping indirect rates at 25%-30%, and shutting down unsuccessful huge programs such as SPORES. History shows that R01s made the discoveries that got us here today. Everything needs to be done to increase funding for R01s to at least 18-20% for all institutes.
Dr. Rockey,
Thank you for this information. However, but I want to point out that discussing success rates is not my favorite subject by a long shot. I would much rather be teaching my students, doing actual experiments (if I can remember how), and publishing our findings. These are things that will actually help my career and hopefully benefit our society as well. However, because the subject of R01 success rates has a direct effect on the career that I’ve carefully worked to develop over 20 years and my family’s well-being I take a keen interest in any bit of information that may conceivably help.
I spend most days writing and re-writing grants in an attempt to basically guess what an unknown reviewer will think is significant or innovative enough to deem worthy of 1’s. I constantly solicit grant writing help from well-established senior faculty who are themselves struggling to retain or re-establish funding, which as a junior faculty member scares the hell out me. I get no credit for how many grants I write or how close I get to the payline, so each unsuccessful proposal represents weeks or months wasted. By extension, each decrease in percentage points these success rates represents literally years of person hours of time lost.
I wake up in the middle of the night worried that if I don’t pull the golden ticket and win the grant lottery soon that my Chair will ask me to lock my lab door and kindly leave the keys with him, leaving me without a career and my family without an income. The people that are represented in your graphs all have these fears and worries, and our lives and livelihoods depend on these little colored dashed lines you have presented. Please keep this in mind that this subject is most definitely not academic to us but has a direct impact on the lives of real people and has a real and lasting effect the long-term well being of scientific research in our country.
I totally concur with your comments. And suggest that all scientists polish their cv’s. I have an active R01 grant and was still non-renewed. My employment ends June 30. Even with an active R01 grant, I have not been successful at obtaining another position because the hiring environment is tight everywhere. As the sole income earner in my family, I wake up a lot in the middle of the night. And I struggle to be positive, because the anger and cynacism clouds are constantly raining on me.
It would seem to me that with the data available to you while the graphics on the success rate, award rates and funding rates provide important information on a global/pooled level, however, one may need to dissect the whole data into its individual components to decipher and be more informative. This can be based upon segregation of the pool into its three main components, viz., early investigators, mid-career investigators, and advanced career investigators. These three categories can be defined as you wish i.e., age range or some other definition that you may wish to utilize. The analysis should incorporate/integrate into the equation also what the total NIH dollars used for each of the three categories. Such analysis in my view will highlight critical elements as to how the tax payer’s money is spent and its distribution amongst investigators of totally different capacities to contribute fundamentally to the biomedical research and drug discovery.
The graphics of success, award and funding rates between 1990 – 2013 has some major alarming implications which should have been predicted by the NIH community and everyone else involved. If companies and industries operated the same way they will all become bankrupt. It is no surprise that the analysis and graphs show the trends that they do whereby with the “doubling of the NIH budget” success, award and funding rates peak and during that period the system also simultaneously introduced into the PI category large number of new investigators who otherwise would have been postdocs since they were too young and inexperienced to really do independent research. This led to the exponential increase in the NIH funded PIs and hence the decline in the trend of overall success, award and funding rates since 2006.
The irony is the fact that the funding was much better with $13.5 billion NIH budget up to 1998 than after the doubling of NIH budget since 2006 with current $30 billion. Based on these facts and errors made it would be difficult to convince anyone that significant increase in the NIH budget will make things better, it would only be temporary and with even greater negative impact thereafter . The mistake was doubling the budget in too short a time, if it was spread over much longer period but with still significant increases every year the problems of today would not have been existed.
Why did I decide to be a PI? Hmm. I keep asking myself that question… but over a decade ago when i started my PhD, everyone was still optimistic. My advisor would say “these things move in cycles, it’ll be on the upswing when you are looking for jobs.” Unfortunately the trend has continued in a downward death spiral. If I would have known the challenges that lie ahead for me now as a young PI, I might have chosen a different path. I find it hard to encourage a student with good conscience to pursue an academic career. It seems that research is a different world now.
R01s really were the backbone of original research and we need to leave most of these huge big data projects, which suck up tremendous amounts of money, to industry. This has become more of a business, rather than a resource to fund research, then I think it was ever meant to be. Collaborative, multidisciplinary proposals are also important and needed, but it seems that it is becoming more of an expectation… again too much business takes the focus away from doing the real meaningful research. Needless to say, I will be trying to get more of my money from other sources rather than NIH, if possible. Or else I will start a landscaping business and live a simpler life…
There have been several mistakes in process and management of NIH funding, some of which have already been discussed above. Interesting that the major milestones noted on the graphic are the elimination of A3 and more recently A2 submissions. In my opinion, elimination of the A2 has been a critical mistake. Many successful grants (defined by results and papers) resulted from repeated tailoring induced by thoughtful peer review through to a third round. In this particularly harsh review climate, very good ideas are just missing the funding level after 2 reviews, and are then dropped, given the new rules. Scientific discovery in this country gets a further hit because this requires talented scientists to go back to the drawing board, devise a new enough proposal that would not be flagged by the system as a covert A2, and start the 2-cycle process over. Thus, years are spent writing up good ideas that go unfunded rather than actually doing the science. It is a trajedy for science that hopefully someone in leadership is working on correcting.
Interesting that the major milestones noted on the graphic are the elimination of A3 and more recently A2 submissions.
Interesting as in misleading? The A3 elimination was also during the doubling, an event that many would suggest had a great effect on success rates. The A2 elimination came just after the ARRA boost (which very likely disrupted a trend and perhaps worsened the post-ARRA result) which might also be seen as having significant effects. Do be careful with correlations and the assumption of causation.
I don’t see a way out of this mess unless NIH requires that institutions make a commitment to actually PAY the people they hire. Soft-money positions break the link between supply and demand.
Thanks for the info. If I understand correctly, per your definition, the denominator in the “official success rates for the fiscal year” calculation only includes the “sum of the applications reviewed.” It would be of interest to include all the triaged grants in the denominator as well, to see how big of an effect this has? In my experience, because everyone is now so stressed and pressed for time, an increasing number of applications seem to be getting triaged in the panels I am on.
I also agree that the process and management of NIH funding, does not seem appropriate. Interesting the elimination of A3 and more recently A2 submissions also has come at a time when there is decreased funds available. In my opinion, elimination of the A2 has been a critical mistake; I was initially funded on an A2 submission so I totally understand how important this submission can be. I also agree that many successful grants (defined by results and papers) resulted from repeated tailoring induced by thoughtful peer review through to a third round. In this particularly harsh review climate, very good ideas are just missing the funding level after 2 reviews, and are then dropped, given the new rules. I wonder if A2s could be allowed for submissions above a certain percentage range (say above 20%) that way those that just missed the funding line could be considered in a third submission but not all scored A1s. Thus, those investigators with great ideas they have been improving over several years could still be considered in a third rounds.
The numerator is the number of applicants receiving any funding that fiscal year, and the denominator is the number of applicants for that fiscal year.
Is this supposed to read any new funding? Because an additional key analysis relates to the longer term success of individual PIs. In any given 1 or 5 year interval, how many PIs have at least some continual support, how many are never successful and what is the turnover rate over time? Dr. Berg posted an analysis of the number of PIs who held R funding in one Fiscal Year that no longer had funding the next and vice versa. I’d like to see more of this type of analysis from the Rock Talking staff.
As with other comments above, I also think it would be great to see a breakdown of these investigator numbers by (chronological) age cohort and/or first-appearance as an applicant (career cohort).
One of the reasons the funding rate is higher than success rates or award rates is that someone who has a grant is less likely to apply for a grant. So I disagree with the statement: “paint a more promising picture for your prospects of receiving NIH funding”.
Someone should predict what is going to happen to America’s biomedical scientists when in the next 3-5 years when those with funding have to reapply and success has remained at the current diminished rate.
It is my experience that study sections are only able to determine what are the best 25-33% of the grants submitted. In other words, the top 33% are usually very, very good (or what we called excellent to outstanding in the old days) and are being written by outstanding scientists with great ideas that should be funded. Think about it…these grants are coming from <0.02% of the United States population (50,000 RPG grants/year divide by 350 million Americans) who have dedicated their lives to their training and performing research.
However, study section results are not interpreted by institutes/agencies correctly. The institutes/agencies think that the new scoring system clearly distinguishes a 5 or 25 percentile score, and is functional. The difference between a 5 and 25 percentile is arbitrary and now simply a matter of luck.
Dr. Rock, Thank you for sharing the data. Both graphs show clearly that funding by NIH has decreased by 42-47% from year 2000 to 2013. That is very scary. If Americans do not pay attention to education and provide necessary resources for science, we will fall much further behind in the coming decades……
I agree 100% that it was a mistake to eliminate the A2 submissions; however, I would also like to see some discussion regarding the high level of turnover on review committees. It appears as though there is little commitment to keep reviewers consistent (or at least somewhat consistent) across submissions. I understand that there are some logistical issues that come into play; however, with only one resubmission possible, I have encountered several instances where a the make-up of a review committee is almost entirely different from the previous submission. In my opinion, this only further decreases changes of funding. In particular, I have seen reviews where new reviewers indicate that researchers were highly responsive to reviewer feedback but then offer a series of completely new comments that prevent the application from being scored at a high level or even discussed (even in cases where the application was discussed previously). Does NIMH see this as a problem and are there any plans to address it?
Does NIH have ANY policy thoughts for sustaining the PIs who propose the best work?
Just funding a few great projects, randomly scattered across an unsustainable number of PIs, can’t be a foundation for anyone’s career. It can’t even give meaningful guidance about how to become one of the successful few — and therefore whether to bet one’s career on biomedical research.
Wasting several years of a grad student’s or postdoc’s life isn’t doing her/him, or America, any good at all. Whether or not we need (say) more landscaping businesses, we surely don’t need to put their owners through several years of biomedical PhD programs first!
I am seeing a disturbing trend, not just for my own applications, but for those of colleagues. It appears that some significant Catch-22s are emerging. The reviewers are using metrics related to past funding-success as part of the review process. My last two grants were down-graded because currently I don’t have an R01. If this is going to be a criterion for funding, there really is no reason to submit an application. Further, productivity depends to a large extent on having funding to do research. Without funding, productivity goes down, but then productivity is used as a metric in the evaluation process. Continuation of these trends will concentrate funding into an ever-shrinking pool of investigators.
Regarding your definition of “Funding Rate”: You say that the denominator is the number of distinct applicants. Technically an “applicant” is an institute or organization. An “applicant” (e.g. University of CA Irvine) could submit multiple applications, each with a different PI. Is the denominator of Funding Rate truly the number of distinct applicants (i.e.applicant institutions) or is it the number of distinct PIs proposed in those applications?